Ethnic groups in Latin America


The inhabitants of Latin America are from a variety of ancestries, ethnic groups and races, making the region one of the most diverse in the world.[1] The specific composition of the group varies from country to country. Many have a predominance of European-Amerindian or Mestizo population; in others, Amerindians are a majority; some are dominated by inhabitants of European ancestry; and some countries' populations have large Black or Mulatto populations.
Ethnic groups
- Native American. The indigenous population of Latin America, the Native Americans, arrived during the Lithic stage. In post-Columbian times they experienced tremendous population decline, particularly in the early decades of colonization. They have since recovered in numbers, surpassing sixty million by some estimates.[2] With the growth of other groups, they now compose a majority only in Bolivia and Guatemala, and possibly in Peru. In Ecuador, Native Americans are a large minority who comprise two-fifths of the population. Mexico's 14%[3] (9.8% in the official 2005 census) is the next largest population, and one of the largest Amerindian populations in the Americas in absolute numbers. Most of the remaining countries have Native American minorities, in every case making up less than one-tenth of the respective country's population. In many countries, people of mixed Native American and European ancestry make up the majority of the population (see Mestizo).
- Asians. People of Asian descent number several million in Latin America. The first Asians to settle in the region were Filipino, as a result of Spain trading in Asia and the Americas. The majority of Asian Latin Americans are of Japanese or Chinese ancestry and reside mainly in Brazil and Peru; there is also a growing Chinese minority in Panama. Brazil is home to about two million people of Asian descent; this includes the largest ethnic Japanese community outside of Japan itself (estimated as high as 1.5 million), and about 200,000 ethnic Chinese and 100,000 ethnic Koreans.[4][5] Ethnic Koreans also number tens of thousands in Argentina and Mexico.[6] Peru, with 1.47 million people of Asian descent,[7][8] has one of the largest Chinese communities in the world, with nearly one million Peruvians being of Chinese ancestry. There is a strong ethnic-Japanese presence in Peru, where a past president and a number of politicians are of Japanese descent. The Martiniquais population includes an African-White-Indian mixed population, and an East Indian (Asian Indian) population.[9] The Guadeloupe an East Indian population is estimated at 14% of the population.
- Blacks. Millions of African slaves were brought to Latin America from the 16th century onward, the majority of whom were sent to the Caribbean region and Brazil. Today, people identified as "Black" are most numerous in Brazil (more than 10 million) and in Haiti (more than 7 million).[10] Among the Hispanic nations and Brazil, Puerto Rico leads this category in relative numbers with 15% of the population being Afro-Latin American. Significant populations are also found in Cuba, Dominican Republic, Ecuador, Panama, Colombia, and Venezuela. Latin Americans of mixed Black and White ancestry, called Mulattoes, are far more numerous than Blacks.
- Mestizos. Intermixing between Europeans and Native Americans began early in the colonial period and was extensive. The resulting people, known as Mestizos, make up the majority of the population in half of the countries of Latin America. Additionally, Mestizos compose large minorities in nearly all the other mainland countries.
- Mulattoes. Mulattoes are people of mixed European and African ancestry. In Latin America, Mulattoes descend primarily from Spanish or Portuguese settlers on one side, and African on the other. Brazil is home to Latin America's largest mulatto population. Mulattoes are a population majority in the Dominican Republic and, depending on the source, Cuba as well. Mulattoes are also numerous in Panama, Costa Rica, Colombia, Puerto Rico, and Ecuador. Smaller populations of mulattoes are found in other Latin American countries.[2]
- Whites. Beginning in the late 15th century, large numbers of Iberian colonists settled in what became Latin America. The Portuguese colonized Brazil primaily, and the Spaniards settled elsewhere in the region. At present, most white Latin Americans are of Spanish or Portuguese origin. Iberians brought the Spanish and Portuguese languages, the Catholic faith, and many Iberian traditions. Argentina, Brazil, and Mexico contain the largest numbers of whites in Latin America.[3] Whites make up the majorities of Argentina, Costa Rica, Puerto Rico, Uruguay, and depending on the source in both Chile and Cuba. Whites make up nearly half of Brazil's population.[3][11][12] Ever since most of Latin America gained independence in the 1810s–1820s, millions of people have immigrated there. Of these immigrants, Italians formed the largest group, and next were Spaniards and Portuguese.[13] Many others arrived, such as French, Germans, Greeks, Poles, Ukrainians, Russians, Estonians, Latvians, Jews, Irish, and Welsh. Also included are Middle Easterners of Lebanese, Syrian, and Palestinian descent; most of them are Christian.[14] Whites presently compose the largest racial group in Latin America (36% in the table herein) and, whether as White, Mestizo, or Mulatto, the vast majority of Latin Americans have white ancestry.[15]
- Zambos: Intermixing between Africans and Native Americans was especially prevalent in Colombia, Nicaragua, Venezuela, and Brazil, often due to slaves's running away (becoming cimarrones: maroons) and being taken in by Amerindian villagers. In Spanish speaking nations, people of this mixed ancestry are known as Zambos[16] in Middle America, and Cafuzos in Brazil.
In addition to the foregoing groups, Latin America also has millions of tri-racial peoples of African, Native American, and European ancestry. Most are found in Dominican Republic, Colombia, Venezuela, Puerto Rico, and Brazil, with a much smaller presence in other countries.
Ethnic groups according to self-identification
The Latinobarómetro surveys have asked respondents in 18 Latin American countries what race they considered themselves to belong to. The figures shown below are averages for 2007 through 2011.[17]
| Country | Mestizo | White | Mulatto | Black | Amerindian | Asian | Other | DK/NR1 |
|---|---|---|---|---|---|---|---|---|
| | 20% | 68% | 1% | 1% | 1% | 0% | 3% | 7% |
| | 60% | 4% | 1% | 0% | 27% | 0% | 1% | 6% |
| | 18% | 45% | 15% | 15% | 2% | 0% | 2% | 2% |
| | 26% | 59% | 1% | 0% | 7% | 1% | 1% | 5% |
| | 43% | 29% | 5% | 7% | 5% | 0% | 1% | 9% |
| | 28% | 46% | 14% | 2% | 3% | 1% | 1% | 6% |
| | 28% | 12% | 25% | 27% | 5% | 2% | 0% | 2% |
| | 78% | 6% | 3% | 3% | 7% | 0% | 0% | 3% |
| | 64% | 10% | 3% | 2% | 5% | 1% | 2% | 12% |
| | 29% | 17% | 2% | 1% | 44% | 1% | 2% | 6% |
| | 56% | 14% | 3% | 3% | 12% | 2% | 1% | 10% |
| | 65% | 15% | 1% | 0% | 16% | 1% | 3% | 2% |
| | 66% | 8% | 3% | 4% | 7% | 1% | 1% | 11% |
| | 55% | 17% | 5% | 11% | 5% | 2% | 1% | 4% |
| | 36% | 35% | 1% | 1% | 2% | 0% | 4% | 20% |
| | 60% | 19% | 2% | 2% | 8% | 0% | 1% | 8% |
| | 6% | 78% | 3% | 2% | 1% | 0% | 3% | 6% |
| | 35% | 30% | 17% | 7% | 4% | 1% | 0% | 5% |
| Weighted average2 | 36% | 31% | 8% | 7% | 7% | 0% | 2% | 8% |
1 Don't know/No response.
2 Weighted using 2011 population.
Ethnic groups according to Dr. Lizcano
The following table contains information based on work by National Autonomous University of Mexico professor Dr. Francisco Lizcano Fernández in 2005, a non genetic based estimate.[3]
| Country | Population 2011[18] |
Whites | Mestizos | Mulattoes | Amerindians | Blacks | Asians | Creoles & Garifunas |
|---|---|---|---|---|---|---|---|---|
| | 41,769,726 | 55.0% | 41.1% | 0.0% | 1.0% | 0.0% | 2.9% | 0.0% |
| | 10,118,683 | 15.0% | 28.0% | 2.0% | 55.0% | 0.0% | 0.0% | 0.0% |
| | 203,429,773 | 49.1% | 0.0% | 43.8% | 0.4% | 6.2% | 0.5% | 0.0% |
| | 16,888,760 | 38.7% | 46.3% | 0.0% | 5.0% | 0.0% | 0.0% | 0.0% |
| | 44,725,543 | 20.0% | 53.2% | 21.0% | 1.8% | 3.9% | 0.0% | 0.1% |
| | 4,576,562 | 52.0% | 45.0% | 0.0% | 0.8% | 0.0% | 0.2% | 2.0% |
| | 11,087,330 | 37.0% | 0.0% | 51.0% | 0.0% | 11.0% | 1.0% | 0.0% |
| | 9,956,648 | 14.6% | 0.0% | 75.0% | 0.0% | 7.7% | 0.4% | 2.3% |
| | 15,007,343 | 9.9% | 41.0% | 5.0% | 39.0% | 5.0% | 0.1% | 0.0% |
| | 6,071,774 | 1.0% | 91.0% | 0.0% | 8.0% | 0.0% | 0.0% | 0.0% |
| | 13,824,463 | 4.0% | 42.0% | 0.0% | 53.0% | 0.0% | 0.8% | 0.2% |
| | 8,143,564 | 1.0% | 85.6% | 1.7% | 7.7% | 0.0% | 0.7% | 3.3% |
| | 113,724,226 | 15.0% | 70.0% | 0.5% | 14.0% | 0.0% | 0.5% | 0.0% |
| | 5,666,301 | 14.0% | 78.3% | 0.0% | 6.9% | 0.0% | 0.2% | 0.6% |
| | 3,460,462 | 10.0% | 32.0% | 27.0% | 8.0% | 5.0% | 4.0% | 14.0% |
| | 6,459,058 | 20.0% | 74.5% | 3.5% | 1.5% | 0.0% | 0.5% | 0.0% |
| | 29,248,943 | 15.0% | 37.0% | 9.7% | 35.5% | 0.0% | 0.8% | 0.0% |
| | 3,989,133 | 74.8% | 0.0% | 10.0% | 0.0% | 15.0% | 0.2% | 0.0% |
| | 3,308,535 | 88.0% | 8.0% | 4.0% | 0.0% | 0.0% | 0.0% | 0.0% |
| | 27,635,743 | 16.9% | 37.7% | 37.7% | 2.7% | 2.8% | 2.2% | 0.0% |
| Total | 579,092,570 | 36.2% | 29.9% | 20.5% | 9.3% | 3.2% | 0.7% | 0.2% |
Note: "Creoles" refer to people of African descent who emigrated from British and French colonies in the Caribbean to Central America.[3]
Ethnic groups according to The World Factbook
The following table shows the different racial groups and their percentages for all Latin American countries and territories, according to information provided by The World Factbook.[2]
| Country | Population (2011)[18] | White | Mestizo | Mulatto | Amerindian | Black | White and mestizo | Mixed | Other1 |
|---|---|---|---|---|---|---|---|---|---|
| | 41,769,726 | 37.0% | 63.0% | ||||||
| | 106,113 | 60.0% | 40.0% | ||||||
| | 10,118,683 | 15.0% | 30.0% | 55.0% | |||||
| | 203,429,773 | 48.5% | 43.7% | 6.2% | 1.6% | ||||
| | 16,888,760 | 4.6% | 95.4% | ||||||
| | 44,725,543 | 20.0% | 58.0% | 14.0% | 1.0% | 4.0% | 3.0% | ||
| | 4,576,562 | 1.0% | 3.0% | 94.0% | 2.0% | ||||
| | 11,087,330 | 65.1% | 10.1% | 24.8% | |||||
| | 144,688 | 100.0% | |||||||
| | 9,956,648 | 16.0% | 11.0% | 73.0% | |||||
| | 15,007,343 | 65.0% | 25.0% | 3.0% | 7.0% | ||||
| | 6,071,774 | 12.7% | 86.3% | 1.0% | [19] | ||||
| | 13,824,463 | 40.5% | 59.4% | 0.1% | |||||
| | 9,719,932 | 95.0% | 5.0% | ||||||
| | 8,143,564 | 1.0% | 90.0% | 7.0% | 2.0% | ||||
| | 113,724,226 | 9.0% | 60.0% | 30.0% | 1.0% | ||||
| | 5,666,301 | 17.0% | 69.0% | 5.0% | 9.0% | ||||
| | 3,460,462 | 10.0% | 70.0% | 6.0% | 14.0% | ||||
| | 6,459,058 | 95.0% | 5.0% | ||||||
| | 29,248,943 | 15.0% | 47.0% | 35.0% | 3.0% | ||||
| | 3,989,133 | 46.2% | 0.2% | 6.9% | 14.4% | 22.3% | |||
| | 7,367 | 100.0% | |||||||
| | 30,615 | 100.0% | |||||||
| | 5,888 | 100.0% | |||||||
| | 3,308,535 | 78.0% | 18.0% | 4.0% | |||||
| | 27,635,743 | 21.0% | 67.0% | 2.0% | 10.0% | ||||
| Total | 589,107,173 | 33.5% | 27.5% | 14.4% | 11.1% | 5.1% | 4.9% | 2.1% | 1.5% |
1 May include one or more of the other groups.
Ethnic groups according to other sources
This is a list of ethnic groups based on national or other sources.
| Country | Amerindian | White | Mestizo | Mulatto | Black | Asian | Pardo or Mixed | Garifuna or Zambo | Montubio | Other | Undeclared | Type of study | Year |
|---|---|---|---|---|---|---|---|---|---|---|---|---|---|
| |
5.600,329 | — | — | — | — | — | — | — | — | — | — | Household survey | 2004-2005 |
| |
49.95% | — | — | — | — | — | — | — | — | — | — | Census | 2001 |
| |
10.28% | 38.43% | — | — | 16.84% | 0.58% | 33.80% | — | — | — | 0.07% | Household survey | 2008 |
| |
28.1% | — | — | — | — | — | — | — | — | — | 71.9% | Household survey | 2011 |
| |
5.0% | 30.0% | 65.0% | — | — | — | — | — | — | — | — | N/A | N/A |
| |
3.43% | — | — | — | 10.62% | — | — | — | — | 0.01% | 85.94% | Census | 2005 |
| |
1.68% | — | — | — | 1.91% | 0.21% | — | — | — | — | 96.21% | Census | 2000 |
| |
— | 65.0% | — | 24.9% | 10.1% | — | — | — | — | — | — | Census | 2002 |
| |
— | 13.6% | — | 67.6% | 18.3% | — | — | — | — | — | — | Household survey | 2006 |
| |
7.0% | 6.1% | 71.9% | — | 7.2% | — | — | — | 7.4% | 0.4% | — | Census | 2010 |
| |
39.4% | — | 60.0% | — | — | — | — | 0.1% | — | 0.5% | — | Census | 2002 |
| |
6.28% | — | — | — | — | — | — | 0.76% | — | — | 92.95% | Census | 2001 |
| |
14.86% | — | — | — | — | — | — | — | — | — | 85.14% | Census | 2010 |
| |
8.63% | — | — | — | — | — | — | — | — | — | 91.37% | Census | 2001 |
| |
11.96% | — | — | — | 8.70% | — | — | — | — | — | 79.33% | Census | 2010 |
| |
1.71% | — | — | — | — | — | — | — | — | — | 98.29% | Census | 2002 |
| |
13.89% | — | — | — | — | — | — | — | — | — | — | Census | 2007 |
| |
20.5% | 35.8% | — | — | 12.4% | 0.2% | 3.3% | — | — | 27.9% | — | Census | 2010 |
| |
0.4% | 87.4% | 2.5% | 6.3% | 2.0% | 0.1% | 0.6% | 0.2% | — | 0.1% | 0.3% | Household survey | 2006 |
| |
2.8% | — | — | — | — | — | — | — | — | — | — | Census | 2011 |
Genetic studies
Argentina
Genetically, the composition of Argentina is mostly European in ancestry, with both Native American and African contributions. A 2009 autosomal DNA study found out the Argentine population 78.5 percent European, 17.3 percent Native American and 4.2 percent sub-Saharan African.[41]
A 2012 autosomal DNA study found out the following composition in Argentina: 65% European, 31% native American and 4% African [42]
It is important to point out that in Argentina a wider populationn consider themselves as white even though they are not. This fact is related to the construction of the national myth of "a European country in South America", built up during the massive European immigration (basically from Italy and Spain) the first half of 20th century. However, besides Buenos Aires and what mainstream media shows, Argentinian population does not differ so much compared to other Latin American countries.
Brazil
Genetic studies have shown the Brazilian population as a whole to have European, African and Native Americans components.
An autosomal study from 2013, with nearly 1300 samples from all of the Brazilian regions, found a pred. degree of European ancestry combined with African and Native American contributions, in varying degrees. 'Following an increasing North to South gradient, European ancestry was the most prevalent in all urban populations (with values up to 74%). The populations in the North consisted of a significant proportion of Native American ancestry that was about two times higher than the African contribution. Conversely, in the Northeast, Center-West and Southeast, African ancestry was the second most prevalent. At an intrapopulation level, all urban populations were highly admixed, and most of the variation in ancestry proportions was observed between individuals within each population rather than among population'.[43]
| Region[44] | European | African | Native American |
|---|---|---|---|
| North Region | 51% | 17% | 32% |
| Northeast Region | 56% | 28% | 16% |
| Central-West Region | 58% | 26% | 16% |
| Southeast Region | 61% | 27% | 12% |
| South Region | 74% | 15% | 11% |
An autosomal DNA study (2011), with nearly 1000 samples from all over the country ("whites", "pardos" and "blacks", according to their respective proportions), found out a major European contribution, followed by a high African contribution and an important Native American component.[45] "In all regions studied, the European ancestry was predominant, with proportions ranging from 60.6% in the Northeast to 77.7% in the South".[46] The 2011 autosomal study samples came from blood donors (the lowest classes constitute the great majority of blood donors in Brazil[47]), and also public health institutions personnel and health students. The study showed that Brazilians from different regions are more homogenous than previously thought by some based on the census alone. "Brazilian homogeneity is, therefore, a lot greater between Brazilian regions than within Brazilian regions".[48]
| Region[45] | European | African | Native American |
|---|---|---|---|
| Northern Brazil | 68,80% | 10,50% | 18,50% |
| Northeast of Brazil | 60,10% | 29,30% | 8,90% |
| Southeast Brazil | 74,20% | 17,30% | 7,30% |
| Southern Brazil | 79,50% | 10,30% | 9,40% |
According to a DNA study from 2010, "a new portrayal of each ethnicity contribution to the DNA of Brazilians, obtained with samples from the five regions of the country, has indicated that, on average, European ancestors are responsible for nearly 80% of the genetic heritage of the population. The variation between the regions is small, with the possible exception of the South, where the European contribution reaches nearly 90%. The results, published by the scientific magazine American Journal of Human Biology by a team of the Catholic University of Brasília, show that, in Brazil, physical indicators such as skin colour, colour of the eyes and colour of the hair have little to do with the genetic ancestry of each person, which has been shown in previous studies (regardless of census classification).[49] "Ancestry informative SNPs can be useful to estimate individual and population biogeographical ancestry. Brazilian population is characterized by a genetic background of three parental populations (European, African, and Brazilian Native Amerindians) with a wide degree and diverse patterns of admixture. In this work we analyzed the information content of 28 ancestry-informative SNPs into multiplexed panels using three parental population sources (African, Amerindian, and European) to infer the genetic admixture in an urban sample of the five Brazilian geopolitical regions. The SNPs assigned apart the parental populations from each other and thus can be applied for ancestry estimation in a three hybrid admixed population. Data was used to infer genetic ancestry in Brazilians with an admixture model. Pairwise estimates of F(st) among the five Brazilian geopolitical regions suggested little genetic differentiation only between the South and the remaining regions. Estimates of ancestry results are consistent with the heterogeneous genetic profile of Brazilian population, with a major contribution of European ancestry (0.771) followed by African (0.143) and Amerindian contributions (0.085). The described multiplexed SNP panels can be useful tool for bioanthropological studies but it can be mainly valuable to control for spurious results in genetic association studies in admixed populations".[50] It is important to note that "the samples came from free of charge paternity test takers, thus as the researchers made it explicit: "the paternity tests were free of charge, the population samples involved people of variable socioeconomic strata, although likely to be leaning slightly towards the ‘‘pardo’’ group".[51]
| Region[51] | European | African | Native American |
|---|---|---|---|
| North Region | 71,10% | 18,20% | 10,70% |
| Northeast Region | 77,40% | 13,60% | 8,90% |
| Central-West Region | 65,90% | 18,70% | 11,80% |
| Southeast Region | 79,90% | 14,10% | 6,10% |
| South Region | 87,70% | 7,70% | 5,20% |
An autosomal DNA study from 2009 found a similar profile "all the Brazilian samples (regions) lie more closely to the European group than to the African populations or to the Mestizos from Mexico".[52]
| Region[53] | European | African | Native American |
|---|---|---|---|
| North Region | 60,6% | 21,3% | 18,1% |
| Northeast Region | 66,7% | 23,3% | 10,0% |
| Central-West Region | 66,3% | 21,7% | 12,0% |
| Southeast Region | 60.7% | 32.0% | 7.3% |
| South Region | 81,5% | 9,3% | 9,2% |
According to another autosomal DNA study from 2008, by the University of Brasília (UnB), European ancestry dominates in the whole of Brazil (in all regions), accounting for 65,90% of heritage of the population, followed by the African contribution (24,80%) and the Native American (9,3%).[54]
São Paulo state, the most populous state in Brazil, with about 40 million people, showed the following composition, according to an autosomal study from 2006: European genes account for 79% of the heritage of the people of São Paulo, 14% are of African origin, and 7% Native American.[55] A more recent study, from 2013, found the following composition in São Paulo state: 61,9% European, 25,5% African and 11,6% native American.[56]
Chile
An autosomal DNA study from 2014 found out Chile to be 44.34% (± 3.9%) native American, 51.85% (± 5.44%) European and 3.81% (± 0.45%) African.[57][58]
A 2015 autosomal DNA study found out Chile to be 42.38% native american, 55.16% european and 2.44% african (using LAMP-LD) and 43.22% native american, 54.38% european and 2.40% african (using RFMix)[59]
Chilean mitochondrial DNA and Y-chromosome studies indicate that European ancestry predominates in the Chilean upper class;[60] in the middle class the European component ranges from 72.3 to 76.8 percent,[60][61] and the Amerindian population ranges from 23.2 to 27.7 percent.[60][61] In the lower socioeconomic class, European ancestry is 62.9%–65 percent[60][61] and Amerindian ancestry is 35–37.1 percent.[60][61]
Colombia
In Colombia, an autosomal study found out the following composition: 60.0% European, 32.0% Native and 8.0% SSA African.[62]
Costa Rica
.svg.png)
While the majority of Costa Ricans identify as of criollo or castizo descent, genetic studies demonstrate considerable pre-Columbian Amerindian and a smaller African ancestry.
According to an autosomal study, the genetic makeup of Costa Rica is 61 percent European, 30 percent Amerindian and nine percent African. Regional variation was observed, with greater European influence in the northern (66%) and central (65%) regions. Increased Amerindian ancestry was found in the south (38%), and a higher African contribution in coastal regions (13% in the Atlantic and 14% in the Pacific).[63]
The Central Valley—where more than half of Costa Ricans live—has a mestizo population with one of the highest European components in Latin America (comparable to Medellin, Colombia and Rio Grande do Sul, Brazil), areas with low pre-Columbian Native ancestry (then occupied by heterogeneous groups of hunter-gatherers) and where the current Native population is sparse. During the Spanish colonization of the Americas, Costa Rica was one of the more isolated regions in the Americas. According to genetic studies, the average Costa Rican from the Central Valley is 75 percent European, 20 percent Native and five percent African.[64] By the late 20th century allusions in textbooks and political discourse to "whiteness" and Spain as the "mother country" of all Costa Ricans were diminishing, replaced with a recognition of the many peoples comprising the nation.[65]
Cuba
An autosomal study from 2014 has found out the genetic ancestry in Cuba to be 72% european, 20% african and 8% native american.[66]
Dominican Republic
According to a recent autosomal study, the genetic composition of the Dominican Republic was 51.2 percent European, 41.8 percent African and eight percent Native.[67]
Mexico
A study by Mexico's National Institute of Genomic Medicine (INMEGEN) reported that mestizo Mexicans are 58.96% European, 35.05% "Asian" (primarily Amerindian) and 5.03 percent African. Sonora has the highest European contribution (70.63 percent) and Guerrero the lowest (51.98 percent, with the highest Asian contribution: 37.17 percent). The African contribution ranges from 2.8 percent in Sonora to 11.13 percent in Veracruz. Eighty percent of the population was classified as mestizo (racially mixed to some degree). The study was conducted among volunteers from six states (Sonora, Zacatecas, Veracruz, Guanajuato, Oaxaca and Yucatan) and an indigenous group, the Zapotecs.[69]
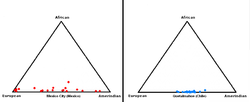
The same study found that the Mexico's haplogroup was most similar to the European group with 81 percent of haplotypes shared, followed by the Asian haplogroup with 74 percent and the African haplogroup with 64 percent. The investigators noted that the African admixture did not generally come from African slaves brought by Europeans, but was part of the genetic admixture of the colonists.[70] A study in Mexico City found that it's mestizo population had the greatest variation in Latin America, with its mestizos being either largely European or Amerindian rather than having an uniform admixture). The study's results are similar to those by INMEGEN on which the European admixture is 56.8 percent, followed by Asian (native American) ancestry with 39.8 percent and an African contribution of 3.4 percent.[68] Additional studies suggest a correlation between greater European admixture with a higher socioeconomic status, and greater Amerindian ancestry with a lower socioeconomic status. A study of low-income Mexicans found the mean admixture to br 0.590, 0.348 and 0.062 Amerindian, European and African respectively,[71] while a study of Mexicans with an inome higher than the mean found their European admixture to be 82 percent.[72]
An autosomal DNA study by the American Journal of Human Genetics estimated that the average admixture of Mexicans is approximately 52% European, 45% Amerindian, and 4% African. Higher Amerindian ancestry on the X chromosome was observed, consistent with predominantly European patrilineal and Native American matrilineal ancestry. [73]
Another autosomal study comparing the ethnic makeup of five different Latin American countries — Mexico, Colombia, Dominican Republic, Ecuador, and Puerto Rico — found Mexico to be 50.1% Native American and 5.6% African, having the highest Native and the lowest African contribution of the sample.[62]
Uruguay
A 2009 DNA study in the American Journal of Human Biology showed the genetic composition of Uruguay as primarily European, with Native American ancestry ranging from one to 20 percent and sub-Saharan African from seven to 15 percent (depending on region).[74]
See also
References
- ↑ La diversidad de identidades étnico-raciales que conviven en América Latina
- ↑ 2.0 2.1 2.2 "CIA — The World Factbook -- Field Listing — Ethnic groups". Retrieved 2008-02-20.
- ↑ 3.0 3.1 3.2 3.3 3.4 Lizcano Fernández, Francisco (May–August 2005). "Composición Étnica de las Tres Áreas Culturales del Continente Americano al Comienzo del Siglo XXI" (PDF). Convergencia (in Spanish) (Mexico: Universidad Autónoma del Estado de México, Centro de Investigación en Ciencias Sociales y Humanidades) 38: 185–232; table on p. 218. ISSN 1405-1435.
- ↑ Shoji, Rafael (2004). "Reinterpretação do Budismo Chinês e Coreano no Brasil". Revista de Estudos da Religião (Nº 3). pp. 74–87. ISSN 1677-1222. Retrieved 2010-06-02{{inconsistent citations}}
- ↑ "Japan-Brazil Relations". MOFA. Retrieved 2012-05-23.
- ↑ "재외동포현황/Current Status of Overseas Compatriots". South Korea: Ministry of Foreign Affairs and Trade. 2009. Retrieved 2009-05-21{{inconsistent citations}}
- ↑ ":: Overseas Compatriot Affairs Commission, R.O.C. ::". Ocac.gov.tw. 2004-08-24. Retrieved 2010-07-26.
- ↑ "DESAFIOS-QUE-NOS-ACERCAN — Noticias — Universia Perú". Universia.edu.pe. Retrieved 2010-07-26.
- ↑ "Martinique". The World Factbook (USA: CIA). 2003. Retrieved 2010-06-02{{inconsistent citations}}
- ↑ "Cronología de la abolición de la esclavitud". Sandiilessa.wordpress.com. Retrieved 2012-05-23.
- ↑ Cap.%202.%20Pensar%20a%20los%20indios,%20tarea%20de%20criollos.pdf massive immigration of European Argentina Uruguay Chile Peru Brazil
- ↑ "Latinoamerican". Revistas.ucm.es. Retrieved 2012-05-23.
- ↑ "South America :: Postindependence overseas immigrants". Britannica Online Encyclopedia. Retrieved 2008-02-10.
- ↑ "En detrimento de Israel Acercamiento arabe a America Latina". Delacole.com. 2011-02-16. Retrieved 2012-05-23.
- ↑ "Latinoamérica" (PDF). Retrieved 2012-05-23.
- ↑ Stranded in Paradise: Shipwrecked Hundreds of Years Ago, the Garifuna Are Still Trying to Find Their Way by Teresa Wiltz, The Washington Post.
- ↑ Informe Latinobarómetro, Latinobarómetro.
- ↑ 18.0 18.1 Population obtained from U.S. Census Bureau, International Data Base, accessed on 5 October 2011.
- ↑ https://www.cia.gov/library/publications/the-world-factbook/geos/es.html
- ↑ Venezuela People 1998, The World Factbook 1998 archive.
- ↑ "Encuesta Complementaria de Pueblos Indígenas 2004-2005" (in Spanish). Instituto Nacional de Estadística y Censos.
- ↑ "CAPÍTULO III: CARACTERÍSTICAS DEMOGRÁFICAS DE LA POBLACIÓN INDÍGENA" (in Spanish). Instituto Nacional de Estadística. p. 88.
- ↑ "Tabela 262 - População residente, por cor ou raça, situação e sexo". IBGE (in Portuguese). Retrieved 2011-11-09.
- ↑ "Casen Survey 2011" (in Spanish). Ministry of Social Development of Chile.
- ↑ "5.2.6. Estructura racial". University of Chile (in Spanish). Retrieved 2007-08-26. (Main page)
- ↑ "COLOMBIA UNA NACIÓN MULTICULTURAL: Su diversidad étnica". 2005 Census (in Spanish). DANE. May 2007. p. 37.
- ↑ "Censo de Población y Vivienda 2000". 2000 Census (in Spanish). ECLAC.
- ↑ "Cuba. Población por Color de la Piel, según Censos" (in Spanish). Oficina Nacional de Estadísticas.
- ↑ "La variable étnico racial en los censos de población en la República Dominicana" (in Spanish). Oficina Nacional de Estadística.
- ↑ "Resultados del Censo 2010". 2010 Census (in Spanish). INEC.
- ↑ "4.12. Pertenencia étnica" (in Spanish). INE. p. 31.
- ↑ "XVI Censo de Población y V de Vivienda 2001". 2001 Census (in Spanish). ECLAC.
- ↑ "Población de 3 años y más en entidades federativas seleccionadas y su distribución porcentual según condición de autoadscripción étnica para cada entidad federativa, sexo y condición de habla indígena". Censo de Población y Vivienda 2010. Cuestionario ampliado (in Spanish). INEGI. 2011. Retrieved 2012-05-22.
- ↑ "Nicaragua - VIII Censo de Población y IV de Vivienda 2005". 2005 Census (in Spanish). ECLAC.
- ↑ "INEC::Panamá - Censo de Población y Vivienda 2010". 2010 Census (in Spanish). ECLAC.
- ↑ "Censo Nacional de Población y Viviendas 2002". 2002 Census (in Spanish). ECLAC.
- ↑ "Atlas sociolingüístico de Pueblos Indígenas de América Latina Fichas nacionales". 2007 Census (in Spanish). UNICEF.
- ↑ "2010 Census: Puerto Rico Profile". United States Census Bureau. 2010.
- ↑ "Tabla 3 - Distribución porcentual de la población según ascendencia y sexo (Uruguay, 2006)". ENHA 2006 (in Spanish). INE. p. 15. Retrieved 2012-05-21.
- ↑ "Primeros Resultados. Censo 2011". 2011 Census (in Spanish). INE. 2012-02-23. Retrieved 2012-05-22.
- ↑ "Inferring Continental Ancestry of Argentineans from Autosomal, Y-Chromosomal and Mitochondrial DNA - Corach - 2009 - Annals of Human Genetics - Wiley Online Library". Onlinelibrary.wiley.com. 2009-12-15. Retrieved 2013-09-06.
- ↑ http://www.plosone.org/article/info%3Adoi%2F10.1371%2Fjournal.pone.0034695
- ↑ http://www.plosone.org/article/fetchObject.action?uri=info%3Adoi%2F10.1371%2Fjournal.pone.0075145&representation=PDF
- ↑ Lins, T. C.; Vieira, R. G.; Abreu, B. S.; Grattapaglia, D.; Pereira, R. W. (March–April 2009). "Genetic composition of Brazilian population samples based on a set of twenty-eight ancestry informative SNPs". American Journal of Human Biology 22 (2): 187–192. doi:10.1002/ajhb.20976. PMID 19639555.
- ↑ 45.0 45.1 PLOS ONE: The Genomic Ancestry of Individuals from Different Geographical Regions of Brazil Is More Uniform Than Expected
- ↑ http://www4.ensp.fiocruz.br/informe/anexos/ric.pdf
- ↑ http://www.amigodoador.com.br/estatisticas.html Profile of the Brazilian blood donor
- ↑ Nossa herança europeia — CH
- ↑ DNA de brasileiro é 80% europeu, indica estudo
- ↑ http://www.ncbi.nlm.nih.gov/pubmed/19639555 Genetic composition of Brazilian population samples based on a set of twenty-eight ancestry informative SNPs
- ↑ 51.0 51.1 Genetic composition of Brazilian population samples based on a set of twenty-eight ancestry informative SNPs - Lins - 2009 - American Journal of Human Biology - Wiley Online L...
- ↑ Allele frequencies of 15 STRs in a re... [Forensic Sci Int Genet. 2010] - PubMed - NCBI
- ↑ Forensic Science International: Genetics. Allele frequencies of 15 STRs in a representative sample of the Brazilian population (inglés) basandos en estudios del IBGE de 2008. Se presentaron muestras de 12.886 individuos de distintas etnias, por regiones, provenían en un 8,26% del Norte, 23,86% del Nordeste, 4,79% del Centro-Oeste, 10,32% del Sudeste y 52,77% del Sur.
- ↑ Untitled Document
- ↑ Genomic ancestry of a sample population from the state of São Paulo, Brazil - Ferreira - 2006 - American Journal of Human Biology - Wiley Online Library
- ↑ PLOS ONE: Revisiting the Genetic Ancestry of Brazilians Using Autosomal AIM-Indels
- ↑ http://www.ncbi.nlm.nih.gov/pubmed/25052264
- ↑ http://www.scielo.cl/pdf/rmc/v142n3/art01.pdf
- ↑ http://www.nature.com/ncomms/2015/150317/ncomms7472/abs/ncomms7472.html
- ↑ 60.0 60.1 60.2 60.3 60.4 "El estrato socioeconómico alto se constituye mayoritariamente por una población caucásica y el estrato bajo por una mezcla de población caucásica 65% y amerindia 35% Revista médica de Chile".
- ↑ 61.0 61.1 61.2 61.3 "Frequency of the hypervariable DNA loci D18S849, D3S1744, D12S1090 and D1S80 in a mixed ancestry population of Chilean blood donors M. Acuña1, H. Jorquera2, L. Cifuentes1 and L. Armanet3 1ICBM Genetic Program and Medical Technology School, Facultad de Medicina, Universidad de Chile".
- ↑ 62.0 62.1 http://www.pnas.org/content/107/Supplement_2/8954.full.pdf
- ↑ Morera, B; Barrantes, R; Marin-Rojas, R (2013-03-25). "Gene admixture in the Costa Rican population". Ann. Hum. Genet. 67 (Pt 1): 71–80. doi:10.1046/j.1469-1809.2003.00010.x. PMID 12556237.
- ↑ Wang, Sijia; Ray, Nicolas; Rojas, Winston; Parra, Maria V.; Bedoya, Gabriel; Gallo, Carla; Poletti, Giovanni; Mazzotti, Guido et al. (2008). "Geographic Patterns of Genome Admixture in Latin American Mestizos". PLoS Genetics 4 (3): e1000037. doi:10.1371/journal.pgen.1000037. PMC 2265669. PMID 18369456.
- ↑ "Culture of Costa Rica - history, people, women, beliefs, food, customs, family, social, marriage". Everyculture.com. Retrieved 2013-09-06.
- ↑ http://www.plosgenetics.org/article/info%3Adoi%2F10.1371%2Fjournal.pgen.1004488#pgen-1004488-g001
- ↑ http://www.pnas.org/content/early/2010/05/05/0914618107.full.pdf
- ↑ 68.0 68.1 "Geographic Patterns of Genome Admixture in Latin American Mestizos". Plos genetics. 2008-03-21. Retrieved 2013-09-09.
- ↑ J.K. Estrada, A. Hidalgo-Miranda, I. Silva-Zolezzi and G. Jimenez-Sanchez. "Evaluation of Ancestry and Linkage Disequilibrium Sharing in Admixed Population in Mexico". ASHG. Retrieved July 18, 2012.
- ↑ "Genoma destapa diferencias de mexicanos". CNN Expansión. 2009-06-06. Retrieved 2013-09-09.
- ↑ Lisker, Rubén; Ramírez, Eva; González-Villalpando, Clicerio; Stern, Michael P. (2005-05-27). "Racial admixture in a Mestizo population from Mexico City". American Journal of Human Biology (Onlinelibrary.willey.com) 7 (2): 213. doi:10.1002/ajhb.1310070210.
- ↑ "Admixture in Mexico City: implications for admixture mapping of Type 2 diabetes genetic risk factors". Utm.utoronto.ca. 2006-10-02. Retrieved 2013-09-09.
- ↑ http://www.ncbi.nlm.nih.gov/pmc/articles/PMC1867092/
- ↑ http://www3.interscience.wiley.com/journal/108068634/abstract/