Essex County Council election, 2013
Essex County Council election, 2013
|
|
|
|
|
|
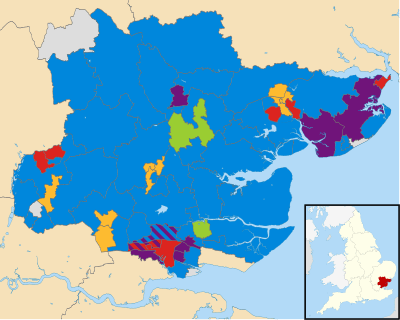
| Map showing the results of the 2013 Essex County Council elections. |
|
An election to Essex County Council took place on 2 May 2013 as part of the United Kingdom local elections, 2013. 75 councillors were elected from 70 electoral divisions, which returned either one or two county councillors each by first-past-the-post voting for a four-year term of office. The electoral divisions were the same as those used at the previous election in 2009. No elections were held in Thurrock or Southend-on-Sea, which are unitary authorities outside the area covered by the County Council.
All locally registered electors (British, Irish, Commonwealth and European Union citizens) who were aged 18 or over on Thursday 2 May 2013 were entitled to vote in the local elections. Those who were temporarily away from their ordinary address (for example, away working, on holiday, in student accommodation or in hospital) were also entitled to vote in the local elections,[1] although those who had moved abroad and registered as overseas electors cannot vote in the local elections. It is possible to register to vote at more than one address (such as a university student who had a term-time address and lives at home during holidays) at the discretion of the local Electoral Register Office, but it remains an offence to vote more than once in the same local government election.[2]
Summary
The election saw the Conservative Party retain overall control of the council, but their majority fell from twenty-two to four councillors. UKIP, Labour and the Liberal Democrats all won nine seats. Of the three second-placed parties who won nine seats, UKIP gained the largest share of the county-wide vote, more than 10% ahead of the Labour party.[3] The Liberal Democrats remain as the official Opposition (entitling them to certain expenses and rights to additional speeches) due to incumbency, despite winning fewer votes.[3] The Green Party gained two seats on the Council, despite its overall share of the vote falling. The Independent Loughton Residents Association and the Canvey Island Independent Party both returned one member and an Independent candidate was also elected.
Results
| Essex County Council election, 2013[4] |
| Party |
Seats |
Gains |
Losses |
Net gain/loss |
Seats % |
Votes % |
Votes |
+/− |
| |
Conservative |
42 |
1 |
19 |
-18 |
56.0 |
34.2 |
112,229 |
-9.3% |
| |
UKIP |
9 |
9 |
1 |
+8 |
12.0 |
27.6 |
90,812 |
+23.2% |
| |
Labour |
9 |
7 |
0 |
+8 |
12.0 |
17.4 |
57,290 |
+5.8% |
| |
Liberal Democrat |
9 |
0 |
2 |
-2 |
12.0 |
10.9 |
35,651 |
-8.9% |
| |
Green |
2 |
2 |
0 |
+2 |
2.7 |
4.6 |
15,187 |
-1.6% |
| |
Tendring First |
1 |
1 |
0 |
+1 |
1.3 |
1.2 |
4,093 |
|
| |
Independent |
1 |
1 |
0 |
+1 |
1.3 |
1.1 |
3,625 |
|
| |
Independent Loughton Residents Association |
1 |
0 |
0 |
0 |
1.3 |
1.0 |
3,286 |
|
| |
Canvey Island Independent Party |
1 |
1 |
0 |
+1 |
1.3 |
0.8 |
2,777 |
|
| |
BNP |
0 |
0 |
0 |
0 |
0.0 |
0.27 |
909 |
|
| |
English Democrats |
0 |
0 |
0 |
0 |
0.0 |
0.24 |
835 |
|
| |
South Woodham Ferrers Independents |
0 |
0 |
0 |
0 |
0.0 |
0.22 |
757 |
|
| |
Trade Unionists and Socialists Against Cuts |
0 |
0 |
0 |
0 |
0.0 |
0.13 |
431 |
|
| |
National Front |
0 |
0 |
0 |
0 |
0.0 |
0.09 |
304 |
|
| |
Community Representatives |
0 |
0 |
0 |
0 |
0.0 |
0.06 |
204 |
|
| |
No label |
0 |
0 |
0 |
0 |
0.0 |
0.007 |
24 |
|
| |
Young People's Party |
0 |
0 |
0 |
0 |
0.0 |
0.006 |
21 |
|
| Total |
75 |
|
328,435 |
|
Results by District
Basildon
| Basildon Westley Heights |
| Party |
Candidate |
Votes |
% |
±% |
|
UKIP |
Kerry James Daryl Luke Smith |
1347 |
29.0 |
+29.0 |
|
Conservative |
John Michael Schofield |
1208 |
26.0 |
-8.6 |
|
Liberal Democrat |
Geoffrey Williams |
1057 |
22.8 |
-7.2 |
|
Labour |
David Edmund Burton-Sampson |
943 |
20.3 |
+8.2 |
|
Green |
Martin Nicholas Wargent |
66 |
1.4 |
+1.4 |
|
No label |
None Of The Above X |
24 |
0.5 |
+0.5 |
| Majority |
139 |
3.0 |
-1.6 |
| Turnout |
4645 |
21.1 |
-14.4 |
|
UKIP gain from Conservative |
Swing |
|
|
Braintree
| Bocking |
| Party |
Candidate |
Votes |
% |
±% |
|
UKIP |
Gordon Kingsley Helm |
1340 |
32.7 |
+15.0 |
|
Conservative |
David John Baugh |
1320 |
32.2 |
-5.1 |
|
Labour |
Lynn Rosemary Watson |
1226 |
29.9 |
+9.4 |
|
Green |
Andrea Hilton Bunn |
126 |
3.1 |
-3.1 |
|
Liberal Democrat |
Pamela Hooper |
91 |
2.2 |
-9.6 |
| Majority |
20 |
0.5 |
-16.3 |
| Turnout |
4103 |
29.0 |
-7.4 |
|
UKIP gain from Conservative |
Swing |
|
|
| Braintree Eastern |
| Party |
Candidate |
Votes |
% |
±% |
|
Conservative |
Patricia Elizabeth Newton |
1605 |
40.6 |
-5.0 |
|
UKIP |
Philip Avramovich Maximenco Palij |
1098 |
27.8 |
+27.8 |
|
Labour |
Moia Thorogood |
790 |
20.0 |
+5.3 |
|
Green |
John Edwin Malam |
233 |
5.9 |
-5.0 |
|
Liberal Democrat |
James William Fleet |
180 |
4.6 |
-7.3 |
|
BNP |
John Alfred Michael Key |
43 |
1.1 |
-6.1 |
| Majority |
507 |
12.8 |
-18.1 |
| Turnout |
3949 |
29.4 |
-10.5 |
|
Conservative hold |
Swing |
|
|
| Three Fields with Great Notley |
| Party |
Candidate |
Votes |
% |
±% |
|
Conservative |
Roger Glyn Walters |
1613 |
47.7 |
-8.2 |
|
UKIP |
Susan Deborah Hoye |
950 |
28.1 |
+28.1 |
|
Labour |
Juliet Clare Walton |
462 |
13.7 |
+7.9 |
|
Green |
Robert James Wright |
207 |
6.1 |
-2.6 |
|
Liberal Democrat |
Derek John Ray |
149 |
4.4 |
-8.5 |
| Majority |
663 |
19.6 |
-23.4 |
| Turnout |
3381 |
27.7 |
-13.2 |
|
Conservative hold |
Swing |
|
|
| Witham Northern |
| Party |
Candidate |
Votes |
% |
±% |
|
Green |
James Edward Abbott |
1209 |
26.4 |
+3.2 |
|
UKIP |
David Hodges |
1148 |
25.0 |
+11.7 |
|
Conservative |
Michael Charles Moore Lager |
1120 |
24.4 |
-7.4 |
|
Labour |
Philip Robert Barlow |
944 |
20.6 |
+3.8 |
|
Liberal Democrat |
David Paul Toombs |
126 |
2.8 |
-5.9 |
|
BNP |
Peter John Stone |
38 |
0.8 |
-5.4 |
| Majority |
61 |
1.3 |
-7.3 |
| Turnout |
4585 |
32.3 |
-9.4 |
|
Green gain from Conservative |
Swing |
|
|
| Witham Southern |
| Party |
Candidate |
Votes |
% |
±% |
|
Conservative |
Derrick Jonathan Louis |
1490 |
37.8 |
-11.5 |
|
UKIP |
Christopher Dennis Warner |
995 |
25.2 |
+25.2 |
|
Labour |
Celia Burne |
932 |
23.6 |
+8.0 |
|
Green |
Philip John Hughes |
244 |
6.2 |
-6.3 |
|
Liberal Democrat |
Barry John Fleet |
227 |
5.8 |
-7.3 |
|
BNP |
Leonard Perry |
54 |
1.4 |
-8.2 |
| Majority |
495 |
12.6 |
-21.1 |
| Turnout |
3942 |
25.8 |
-10.0 |
|
Conservative hold |
Swing |
|
|
Brentwood
| Brentwood Rural |
| Party |
Candidate |
Votes |
% |
±% |
|
Conservative |
Ann Frances Naylor |
1847 |
44.4 |
-4.3 |
|
UKIP |
Yvonne Jeanette Maguire |
1425 |
34.2 |
+12.8 |
|
Liberal Democrat |
Lisa Penelope Barrett |
461 |
11.1 |
-5.2 |
|
Labour |
Julie Morrissey |
304 |
7.3 |
+2.1 |
|
Green |
Howard John Bills |
126 |
3.0 |
+3.0 |
| Majority |
422 |
10.1 |
-17.1 |
| Turnout |
4163 |
29.1 |
-15.3 |
|
Conservative hold |
Swing |
|
|
Castle Point
| Canvey Island East |
| Party |
Candidate |
Votes |
% |
±% |
|
Canvey Island Independent Party |
Dave Blackwell |
1766 |
44.3 |
+9.5 |
|
UKIP |
Brian Sidney Wood |
1145 |
28.7 |
+28.7 |
|
Conservative |
David Thomas Cross |
619 |
15.5 |
-16.0 |
|
Labour Co-op |
Matthew James Reilly |
356 |
8.9 |
-1.9 |
|
BNP |
John Laurence Morgan |
79 |
2.0 |
-14.7 |
|
Liberal Democrat |
Owen Bartholomew |
24 |
0.6 |
-5.6 |
| Majority |
621 |
15.6 |
+12.3 |
| Turnout |
3989 |
26.4 |
-7.8 |
|
Canvey Island Independent Party gain from UKIP |
Swing |
|
|
| Canvey Island West |
| Party |
Candidate |
Votes |
% |
±% |
|
Conservative |
Raymond Charles Howard |
1310 |
37.1 |
-6.0 |
|
Canvey Island Independent Party |
Peter James May |
1011 |
28.6 |
-8.0 |
|
UKIP |
Anna Rosina Wood |
850 |
24.0 |
+24.0 |
|
Labour Co-op |
Esther Akinnuwa |
278 |
7.9 |
+0.9 |
|
BNP |
Stephen Leonard Smith |
59 |
1.7 |
-9.5 |
|
Liberal Democrat |
Paul Westlake |
26 |
0.7 |
-1.5 |
| Majority |
299 |
8.5 |
+2.0 |
| Turnout |
3534 |
26.3 |
-7.9 |
|
Conservative hold |
Swing |
|
|
| Thundersley |
| Party |
Candidate |
Votes |
% |
±% |
|
UKIP |
Jamie David Huntman |
1359 |
39.8 |
+39.8 |
|
Conservative |
William John Craig Dick |
1148 |
33.6 |
-10.3 |
|
Labour Co-op |
Joe Cooke |
635 |
18.6 |
+4.7 |
|
Independent |
Geoff Robinson |
185 |
5.4 |
+5.4 |
|
Liberal Democrat |
Dominic Charles Graham |
50 |
1.5 |
-6.6 |
|
BNP |
Paul Maylin |
41 |
1.2 |
-6.7 |
| Majority |
211 |
6.2 |
-18.4 |
| Turnout |
3418 |
27.7 |
-10.8 |
|
UKIP gain from Conservative |
Swing |
|
|
Chelmsford
| Chelmer |
| Party |
Candidate |
Votes |
% |
±% |
|
Conservative |
John Andrew Spence |
2044 |
49.0 |
-8.9 |
|
UKIP |
Thomas Jones |
1029 |
24.7 |
+24.7 |
|
Labour |
Raymond William Barry |
466 |
11.2 |
+4.8 |
|
Liberal Democrat |
Martin Ashby |
428 |
10.3 |
-9.3 |
|
Green |
Colin Arthur Victor Budgey |
206 |
4.9 |
-5.0 |
| Majority |
1015 |
24.3 |
-14.0 |
| Turnout |
4173 |
25.5 |
-11.4 |
|
Conservative hold |
Swing |
|
|
| Chelmsford Central |
| Party |
Candidate |
Votes |
% |
±% |
|
Conservative |
Dick Alfred Madden |
1233 |
35.8 |
-7.8 |
|
Liberal Democrat |
David George Jones |
895 |
26.0 |
-12.6 |
|
UKIP |
John Anthony Theedom |
711 |
20.6 |
+20.6 |
|
Labour |
Edward Massey |
431 |
12.5 |
-5.3 |
|
Green |
Tony Lane |
175 |
5.1 |
+5.1 |
| Majority |
338 |
9.8 |
+4.7 |
| Turnout |
3454 |
28.2 |
-0.8 |
|
Conservative hold |
Swing |
|
|
| Chelmsford North |
| Party |
Candidate |
Votes |
% |
±% |
|
Liberal Democrat |
Stephen Robinson |
1501 |
37.4 |
-4.7 |
|
Conservative |
Robert Alexander Pontin |
882 |
22.0 |
-2.5 |
|
UKIP |
Leslie George Thomas Retford |
862 |
21.5 |
+10.2 |
|
Labour |
Irene Ferguson |
596 |
14.9 |
-3.6 |
|
Green |
Angela Joan Thomson |
170 |
4.2 |
+0.7 |
| Majority |
619 |
15.4 |
-2.1 |
| Turnout |
4011 |
29.1 |
+0.9 |
|
Liberal Democrat hold |
Swing |
|
|
| South Woodham Ferrers |
| Party |
Candidate |
Votes |
% |
±% |
|
Conservative |
Norman John Hume |
893 |
33.8 |
-10.1 |
|
South Woodham Ferrers Independents |
Ian Roberts |
757 |
28.6 |
+28.6 |
|
UKIP |
Cliff Hammans |
560 |
21.2 |
+21.2 |
|
Labour |
Derek James Barnett |
289 |
10.9 |
+3.8 |
|
Liberal Democrat |
Noel Sutcliffe |
94 |
3.6 |
-5.9 |
|
Green |
Robert Charles King |
51 |
1.9 |
-2.8 |
| Majority |
136 |
5.1 |
-12.6 |
| Turnout |
2644 |
20.7 |
-12.0 |
|
Conservative hold |
Swing |
|
|
Colchester
| Stanway and Pyefleet |
| Party |
Candidate |
Votes |
% |
±% |
|
Conservative |
Kevin Paul Bentley |
1723 |
40.8 |
-3.9 |
|
UKIP |
Imelda Clancy |
929 |
22.0 |
+22.0 |
|
Liberal Democrat |
Jessica Jane Scott-Boutell |
829 |
19.6 |
-9.1 |
|
Labour |
Robert Peter Spademan |
491 |
11.6 |
+1.3 |
|
Green |
Walter Schwarz |
247 |
5.8 |
-4.3 |
| Majority |
794 |
18.8 |
+2.8 |
| Turnout |
4219 |
29.5 |
-8.3 |
|
Conservative hold |
Swing |
|
|
| Wivenhoe St. Andrew |
| Party |
Candidate |
Votes |
% |
±% |
|
Labour |
Julie Ann Young |
1895 |
51.4 |
+16.7 |
|
UKIP |
Graham John Tricker |
599 |
16.2 |
+16.2 |
|
Conservative |
Mo Metcalf-Fisher |
562 |
15.2 |
-7.1 |
|
Liberal Democrat |
Shaun Lee Boughton |
383 |
10.4 |
-15.2 |
|
Green |
Timothy Richard Glover |
248 |
6.7 |
-5.5 |
| Majority |
1296 |
35.2 |
+26.1 |
| Turnout |
3687 |
26.6 |
-6.3 |
|
Labour hold |
Swing |
|
|
Epping Forest
| Buckhurst Hill and Loughton South |
| Party |
Candidate |
Votes |
% |
±% |
|
Conservative |
Valerie Metcalfe |
1530 |
35.8 |
-4.3 |
|
Independent Loughton Residents Association |
Sharon Weston |
1017 |
23.8 |
+23.8 |
|
UKIP |
David Dorrell |
790 |
18.5 |
+8.7 |
|
Labour |
Andrew Forsley |
336 |
7.9 |
+2.4 |
|
Green |
Steven John Sayfritz Neville |
308 |
7.2 |
+1.2 |
|
Liberal Democrat |
Garry Leonard Sadler |
234 |
5.5 |
-24.6 |
|
Independent |
Rodney Travis Law |
38 |
0.9 |
+0.9 |
|
Young People's Party |
Gerard Mark Wadsworth |
21 |
0.5 |
+0.5 |
| Majority |
513 |
12.0 |
+2.0 |
| Turnout |
4274 |
27.0 |
-14.0 |
|
Conservative hold |
Swing |
|
|
| Chigwell and Loughton Broadway |
| Party |
Candidate |
Votes |
% |
±% |
|
Conservative |
John Knapman |
1146 |
38.0 |
-15.2 |
|
UKIP |
Lucy Clare Bostick |
982 |
32.6 |
+32.6 |
|
Independent Loughton Residents Association |
Leon Girling |
324 |
10.8 |
+10.8 |
|
Labour |
Margaret Doris Owen |
319 |
10.6 |
-3.3 |
|
Green |
Christopher John Lord |
114 |
3.8 |
-5.4 |
|
Liberal Democrat |
George Andrew Lund |
93 |
3.1 |
-8.4 |
|
Independent |
Robert Brian Jarvis |
37 |
1.2 |
+1.2 |
| Majority |
164 |
5.4 |
-33.9 |
| Turnout |
3015 |
22.3 |
-11.2 |
|
Conservative hold |
Swing |
|
|
| Epping and Theydon Bois |
| Party |
Candidate |
Votes |
% |
±% |
|
Liberal Democrat |
Jon Whitehouse |
1664 |
37.9 |
-4.5 |
|
Conservative |
Robert James Glozier |
1273 |
29.0 |
-6.5 |
|
UKIP |
Andrew George Smith |
1073 |
24.4 |
+14.5 |
|
Labour |
Simon David Bullough |
240 |
5.5 |
+2.2 |
|
Green |
Barry George Johns |
145 |
3.3 |
-0.4 |
| Majority |
391 |
8.9 |
+2.1 |
| Turnout |
4395 |
33.0 |
-12.4 |
|
Liberal Democrat hold |
Swing |
|
|
| Loughton Central |
| Party |
Candidate |
Votes |
% |
±% |
|
Independent Loughton Residents Association |
Chris Pond |
1,945 |
60.7 |
+5.5 |
|
UKIP |
Reginald Ellis |
615 |
19.2 |
+12.9 |
|
Conservative |
Ivan Kovler |
389 |
12.1 |
-6.1 |
|
Green |
Nicola Fuller |
109 |
3.4 |
+1.0 |
|
Independent |
Paul Morris |
73 |
2.3 |
N/A |
|
Liberal Democrat |
Maureen Jarvis |
72 |
2.2 |
-0.1 |
| Majority |
1330 |
41.5 |
+4.5 |
| Turnout |
3203 |
23.1 |
-14.2 |
|
Independent Loughton Residents Association hold |
Swing |
|
|
| North Weald and Nazeing |
| Party |
Candidate |
Votes |
% |
±% |
|
Conservative |
Anthony James Jackson |
1669 |
47.6 |
-13.4 |
|
UKIP |
Peter John Field |
1170 |
33.4 |
+33.4 |
|
Labour |
David Joseph Mills |
421 |
12.0 |
+3.8 |
|
Green |
Nicola Lesley Mary Barnecutt |
164 |
4.7 |
-3.9 |
|
Liberal Democrat |
Arnold Gregory Verrall |
83 |
2.4 |
-7.8 |
| Majority |
499 |
14.2 |
-34.8 |
| Turnout |
3507 |
24.7 |
-12.8 |
|
Conservative hold |
Swing |
|
|
| Waltham Abbey |
| Party |
Candidate |
Votes |
% |
±% |
|
Conservative |
Ricki Gadsby |
1378 |
40.8 |
-9.7 |
|
UKIP |
Rod Butler |
1221 |
36.1 |
+36.1 |
|
Labour |
Robert Frederick Greyson |
505 |
14.9 |
+6.2 |
|
Liberal Democrat |
Timothy Vaughan |
100 |
3.0 |
-10.4 |
|
Green |
Murray Sackwild |
89 |
2.6 |
-3.7 |
|
BNP |
Patricia Hazel Richardson |
87 |
2.6 |
-18.4 |
| Majority |
157 |
4.6 |
-24.9 |
| Turnout |
3380 |
20.5 |
-10.7 |
|
Conservative hold |
Swing |
|
|
Harlow
| Harlow North |
| Party |
Candidate |
Votes |
% |
±% |
|
Labour |
Michael Ralph Danvers |
1637 |
37.0 |
+12.1 |
|
Conservative |
Michael George Garnett |
1229 |
27.8 |
-5.4 |
|
UKIP |
Bill Pryor |
1147 |
25.9 |
+25.9 |
|
Liberal Democrat |
Mary Helen Wiltshire |
205 |
4.6 |
-15.8 |
|
Green |
Howard Robert Seymour Reed |
115 |
2.6 |
-5.9 |
|
Trade Unionists and Socialists Against Cuts |
Paul Lenihan |
88 |
2.0 |
+2.0 |
| Majority |
408 |
9.2 |
+0.9 |
| Turnout |
4421 |
26.6 |
-14.1 |
|
Labour gain from Conservative |
Swing |
|
|
| Harlow South East |
| Party |
Candidate |
Votes |
% |
±% |
|
Conservative |
Edward C. Johnson |
1346 |
32.5 |
-8.3 |
|
Labour |
Daniella Pritchard |
1325 |
32.0 |
+11.5 |
|
UKIP |
Mark Robert Edward Gough |
1254 |
30.3 |
+30.3 |
|
Liberal Democrat |
Christopher Millington |
131 |
3.2 |
-14.7 |
|
Green |
Nicholas David Scales |
82 |
2.0 |
-4.7 |
| Majority |
21 |
0.5 |
-19.8 |
| Turnout |
4138 |
27.4 |
-9.5 |
|
Conservative hold |
Swing |
|
|
Maldon
| Heybridge and Tollesbury |
| Party |
Candidate |
Votes |
% |
±% |
|
Conservative |
Rodney Bass |
2,300 |
46.3 |
-7.6 |
|
UKIP |
Beverley Acevedo |
1,202 |
24.2 |
N/A |
|
Labour |
Stevan Slodzik |
822 |
16.5 |
+8.9 |
|
Green |
Robert Graves |
417 |
8.4 |
-4.6 |
|
BNP |
Richard Perry |
230 |
4.6 |
-4.8 |
| Majority |
1,098 |
22.1 |
-15.8 |
| Turnout |
4,971 |
31.1 |
-8.4 |
|
Conservative hold |
Swing |
|
|
| Maldon |
| Party |
Candidate |
Votes |
% |
±% |
|
Conservative |
Penny Channer |
1,994 |
47.7 |
+6.1 |
|
UKIP |
Geoffrey Dickman |
1,052 |
25.2 |
N/A |
|
Labour |
Madeline Diamond |
574 |
13.7 |
+4.6 |
|
Green |
Janet Carden |
470 |
11.2 |
+0.6 |
|
BNP |
Mark Burmby |
87 |
2.1 |
-4.8 |
| Majority |
942 |
22.6 |
+1.7 |
| Turnout |
4,177 |
28.7 |
-10.4 |
|
Conservative hold |
Swing |
|
|
| Southminster |
| Party |
Candidate |
Votes |
% |
±% |
|
Conservative |
Robert George Boyce |
1844 |
39.8 |
-5.0 |
|
UKIP |
Tim Drain |
1805 |
38.9 |
+17.0 |
|
Labour |
Leslie Allan McDonald |
643 |
13.9 |
+5.1 |
|
Green |
Jonathan King |
276 |
6.0 |
-1.0 |
|
BNP |
Nathan Mitchell Stone |
68 |
1.5 |
-6.3 |
| Majority |
39 |
0.8 |
-22.1 |
| Turnout |
4636 |
26.2 |
-9.6 |
|
Conservative hold |
Swing |
|
|
Rochford
| Rayleigh South |
| Party |
Candidate |
Votes |
% |
±% |
|
UKIP |
Keith Anthony Gibbs |
1379 |
39.8 |
+39.8 |
|
Conservative |
John Christopher Flack |
1194 |
34.4 |
-14.5 |
|
Liberal Democrat |
Pam Waldie |
563 |
16.2 |
-1.4 |
|
Labour |
Cameron Scott |
331 |
9.6 |
+3.1 |
| Majority |
185 |
5.3 |
-24.4 |
| Turnout |
3467 |
26.8 |
-8.2 |
|
UKIP gain from Conservative |
Swing |
|
|
| Rochford South |
| Party |
Candidate |
Votes |
% |
±% |
|
Conservative |
Colin George Seagers |
1085 |
36.4 |
-14.7 |
|
Labour |
Jerry Gibson |
1005 |
33.7 |
+21.1 |
|
UKIP |
Peter James Van De Vyver |
804 |
27.0 |
+27.0 |
|
Liberal Democrat |
Angela Marguerite Robinson |
89 |
3.0 |
-6.1 |
| Majority |
80 |
2.7 |
-34.4 |
| Turnout |
2983 |
24.0 |
-7.8 |
|
Conservative hold |
Swing |
|
|
Tendring
| Brightlingsea |
| Party |
Candidate |
Votes |
% |
±% |
|
UKIP |
Roger Lord |
1,429 |
30.4 |
+30.4 |
|
Liberal Democrat |
Gary Scott |
1,264 |
26.9 |
-1.5 |
|
Conservative |
Lynda McWilliams |
1,156 |
24.6 |
-18.4 |
|
Labour |
Colin Olivier |
585 |
12.4 |
+1.8 |
|
Green |
Maria Iacovou |
165 |
3.5 |
-4.9 |
|
Tendring First |
Terry Allen |
102 |
2.2 |
N/A |
| Majority |
165 |
3.5 |
-11.1 |
| Turnout |
4,701 |
32.2 |
-6.6 |
|
UKIP gain from Conservative |
Swing |
|
|
| Clacton East |
| Party |
Candidate |
Votes |
% |
±% |
|
Tendring First |
Pierre Oxley |
1528 |
34.3 |
+8.8 |
|
Conservative |
Peter Halliday |
1194 |
26.8 |
-15.8 |
|
UKIP |
Sandy White |
1106 |
24.8 |
+24.8 |
|
Labour |
Norman Jacobs |
477 |
10.7 |
+1.2 |
|
Liberal Democrat |
Brian Whitson |
77 |
1.7 |
-2.8 |
|
Green |
Eleanor Mary Gordon |
70 |
1.6 |
-4.5 |
| Majority |
621 |
7.5 |
-9.6 |
| Turnout |
4452 |
33.7 |
-6.9 |
|
Tendring First gain from Conservative |
Swing |
|
|
| Clacton North |
| Party |
Candidate |
Votes |
% |
±% |
|
Conservative |
Andy Wood |
929 |
29.3 |
-10.5 |
|
Labour |
Sam Atkinson |
790 |
24.9 |
+8.4 |
|
UKIP |
Anne Poonian |
789 |
24.9 |
N/A |
|
Tendring First |
Mark Stephenson |
396 |
12.5 |
N/A |
|
Liberal Democrat |
Harry Shearing |
191 |
6.0 |
-13.9 |
|
Green |
James Horsler |
75 |
2.4 |
-4.8 |
| Majority |
139 |
4.4 |
-15.6 |
| Turnout |
3,170 |
24.2 |
-7.0 |
|
Conservative hold |
Swing |
|
|
| Clacton West |
| Party |
Candidate |
Votes |
% |
±% |
|
Conservative |
Paul Honeywood |
1,251 |
38.2 |
-1.8 |
|
UKIP |
Chris Cotter |
1031 |
31.4 |
N/A |
|
Labour |
Linda Jacobs |
671 |
20.5 |
+9.1 |
|
Tendring First |
Christopher Keston |
158 |
4.8 |
-12.1 |
|
Liberal Democrat |
Ann Whitson |
85 |
2.6 |
-5.9 |
|
Green |
Clare Palmer |
83 |
2.5 |
-2.9 |
| Majority |
220 |
6.7 |
-16.3 |
| Turnout |
3279 |
27.1 |
-8.2 |
|
Conservative hold |
Swing |
|
|
| Frinton and Walton |
| Party |
Candidate |
Votes |
% |
±% |
|
Conservative |
Michael Page |
2,095 |
37.7 |
-8.5 |
|
UKIP |
Simon Ashley |
1,588 |
28.6 |
N/A |
|
Tendring First |
Iris Johnson |
1,085 |
19.5 |
-12.9 |
|
Labour |
Rose Lawes |
619 |
11.2 |
+4.1 |
|
Green |
Howard Mettler |
84 |
1.5 |
-5.7 |
|
Liberal Democrat |
Jo Hayes |
81 |
1.5 |
N/A |
| Majority |
507 |
9.1 |
-4.7 |
| Turnout |
5,552 |
35.7 |
-9.7 |
|
Conservative hold |
Swing |
|
|
| Tendring Rural East |
| Party |
Candidate |
Votes |
% |
±% |
|
UKIP |
Andrew Erskine |
1,552 |
35.0 |
|
|
Conservative |
Michael Skeels |
1,278 |
28.8 |
-6.9 |
|
Labour |
Mark Morley-Souter |
681 |
15.3 |
+4.8 |
|
Tendring First |
Mark Cossens |
654 |
14.7 |
-8.0 |
|
Green |
Chris Southall |
176 |
4.0 |
-4.0 |
|
Liberal Democrat |
Dennis Cook |
100 |
2.2 |
-7.2 |
| Majority |
274 |
6.2 |
-6.9 |
| Turnout |
4,441 |
30.1 |
-8.4 |
|
UKIP gain from Conservative |
Swing |
|
|
| Tendring Rural West |
| Party |
Candidate |
Votes |
% |
±% |
|
Conservative |
Carlo Guglielmi |
1,515 |
37.9 |
-2.9 |
|
UKIP |
Dennis Carr |
1,141 |
28.5 |
+11.9 |
|
Liberal Democrat |
Rosemary Smith |
728 |
18.2 |
0.0 |
|
Green |
Duncan Gordon |
343 |
8.6 |
+0.5 |
|
Tendring First |
David Oxley |
147 |
3.7 |
-1.6 |
|
Independent |
Jim Clifton |
128 |
3.2 |
N/A |
| Majority |
374 |
9.3 |
-13.2 |
| Turnout |
4,002 |
29.5 |
-11.3 |
|
Conservative hold |
Swing |
|
|
Uttlesford
| Saffron Walden |
| Party |
Candidate |
Votes |
% |
±% |
|
Independent |
John Lodge |
2,079 |
34.3 |
N/A |
|
Conservative |
Robert Chambers |
2,031 |
33.5 |
-17.1 |
|
UKIP |
Barry Tyler |
609 |
10.0 |
N/A |
|
Liberal Democrat |
Richard Freeman |
607 |
10.0 |
-13.2 |
|
Labour |
Jane Berney |
491 |
8.1 |
+0.7 |
|
Green |
Trilby Roberts |
244 |
4.0 |
-9.7 |
| Majority |
48 |
0.8 |
-26.6 |
| Turnout |
6,061 |
37.7 |
-4.4 |
|
Independent gain from Conservative |
Swing |
|
|
References
External links