Epidemiology of depression

Depression is a major cause of morbidity worldwide.[2] Lifetime prevalence varies widely, from 3% in Japan to 17% in the US. In most countries the number of people who would suffer from depression during their lives falls within an 8–12% range.[3][4]
In North America the probability of having a major depressive episode within any year-long period is 3–5% for males and 8–10% for females.[5][6]
Demographic dynamics
Population studies have consistently shown major depression to be about twice as common in women as in men, although it is unclear why this is so, and whether factors unaccounted for are contributing to this.[7] The relative increase in occurrence is related to pubertal development rather than chronological age, reaches adult ratios between the ages of 15 and 18, and appears associated with psychosocial more than hormonal factors.[7]
People are most likely to suffer their first depressive episode between the ages of 30 and 40, and there is a second, smaller peak of incidence between ages 50 and 60.[8] The risk of major depression is increased with neurological conditions such as stroke, Parkinson's disease, or multiple sclerosis and during the first year after childbirth.[9]
It is also more common after cardiovascular illnesses, and is related more to a poor outcome than to a better one.[10][11] Studies conflict on the prevalence of depression in the elderly, but most data suggest there is a reduction in this age group.[12] Depressive disorders are most common to observe in urban than in rural population and the prevalence is in groups with stronger socioeconomic factors i.e. homelessness [13]
Data on the relative prevalence of major depression among different ethnic groups have reached no clear consensus. However, the only known study to have covered dysthymia specifically found it to be more common in African and Mexican Americans than in European Americans.[14]
By country
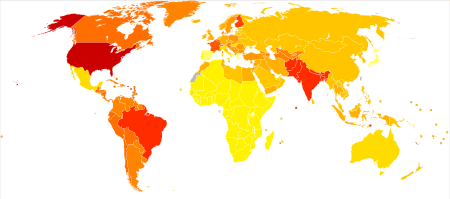
Age-standardised disability-adjusted life year (DALY) rates per 100,000 inhabitants[15]
|
|
|
See also
References
- ↑ "The scope and concerns of public health". Oxford University Press: OUP.COM. March 5, 2009. Retrieved December 3, 2010.
- ↑ World Health Organization. The world health report 2001 – Mental Health: New Understanding, New Hope; 2001 [Retrieved 2008-10-19].
- ↑ Andrade L, Caraveo-A.. Epidemiology of major depressive episodes: Results from the International Consortium of Psychiatric Epidemiology (ICPE) Surveys . Int J Methods Psychiatr Res. 2003;12(1):3–21. doi:10.1002/mpr.138. PMID 12830306.
- ↑ Kessler RC, Berglund P, Demler O. The epidemiology of major depressive disorder: Results from the National Comorbidity Survey Replication (NCS-R). JAMA. 2003;289(203):3095–105. doi:10.1001/jama.289.23.3095. PMID 12813115.
- ↑ Kessler RC, Berglund P, Demler O, Jin R, Merikangas KR, Walters EE. Lifetime prevalence and age-of-onset distributions of DSM-IV disorders in the National Comorbidity Survey Replication. Archives of General Psychiatry. 2005;62(6):593–602. doi:10.1001/archpsyc.62.6.593. PMID 15939837.
- ↑ Murphy JM, Laird NM, Monson RR, Sobol AM, Leighton AH. A 40-year perspective on the prevalence of depression: The Stirling County Study. Archives of General Psychiatry. 2000;57(3):209–15. doi:10.1001/archpsyc.57.3.209. PMID 10711905.
- ↑ 7.0 7.1 Gender differences in unipolar depression: An update of epidemiological findings and possible explanations. Acta Psychiatrica Scandinavica. 2003;108(3):163–74. doi:10.1034/j.1600-0447.2003.00204.x. PMID 12890270.
- ↑ Eaton WW, Anthony JC, Gallo J. Natural history of diagnostic interview schedule/DSM-IV major depression. The Baltimore Epidemiologic Catchment Area follow-up. Archives of General Psychiatry. 1997;54(11):993–99. doi:10.1001/archpsyc.1997.01830230023003. PMID 9366655.
- ↑ Rickards H. Depression in neurological disorders: Parkinson's disease, multiple sclerosis, and stroke. Journal of Neurology Neurosurgery and Psychiatry. 2005;76:i48–i52. doi:10.1136/jnnp.2004.060426. PMID 15718222. PMC 1765679.
- ↑ Alboni P, Favaron E, Paparella N, Sciammarella M, Pedaci M. Is there an association between depression and cardiovascular mortality or sudden death?. Journal of cardiovascular medicine (Hagerstown, Md.). 2008;9(4):356–62. doi:10.2459/JCM.0b013e3282785240. PMID 18334889.
- ↑ Strik JJ, Honig A, Maes M. Depression and myocardial infarction: relationship between heart and mind. Progress in neuro-psychopharmacology & biological psychiatry. 2001;25(4):879–92. doi:10.1016/S0278-5846(01)00150-6. PMID 11383983.
- ↑ Jorm AF. Does old age reduce the risk of anxiety and depression? A review of epidemiological studies across the adult life span. Psychological Medicine. 2000;30(1):11–22. doi:10.1017/S0033291799001452. PMID 10722172.
- ↑ Gelder, M., Mayou, R. and Geddes, J. 2005. Psychiatry. 3rd ed. New York: Oxford. pp105.
- ↑ Stephanie A. Riolo et al. (June 2005). "Prevalence of Depression by Race/Ethnicity: Findings From the National Health and Nutrition Examination Survey III". U.S. National Library of Medicine. Retrieved January 18, 2014.
- ↑ World Health Organization (WHO). Age-standardized DALYs per 100,000 by cause, and Member State, 2004; 2004 [Retrieved 2011-03-31].