Encephalization quotient
| Species | Encephalization quotient (EQ)[1] |
|---|---|
| Human | 7.4–7.8 |
| Tucuxi | 4.56[2] |
| Bottlenose dolphin | 4.14[3] |
| Orca | 2.57–3.3[3][4] |
| Chimpanzee | 2.2–2.5[5] |
| Rhesus monkey | 2.1 |
| Elephant | 1.13–2.36[6] |
| Dog | 1.2 |
| Squirrel | 1.1 |
| Cat | 1.00 |
| Horse | 0.9 |
| Sheep | 0.8 |
| Mouse | 0.5 |
| Rat | 0.4 |
| Rabbit | 0.4 |
Encephalization Quotient (EQ), or encephalization level is a measure of relative brain size defined as the ratio between actual brain mass and predicted brain mass for an animal of a given size, which is hypothesized to be a rough estimate of the intelligence or cognition of the animal.[7]
This is a more refined measurement than the raw brain-to-body mass ratio, as it takes into account allometric effects. The relationship, expressed as a formula, has been developed for mammals, and may not yield relevant results when applied outside this group.[8]
Additionally to volume, mass or cell count, the energy expenditure of the brain could be compared with that of the rest of the body.
Brain-body size relationship
| Species | Simple brain-to-body ratio (E/S)[9] |
|---|---|
| small birds | 1/12 |
| human | 1/40 |
| mouse | 1/40 |
| dolphin | 1/50 |
| cat | 1/100 |
| chimpanzee | 1/113 |
| dog | 1/125 |
| frog | 1/172 |
| lion | 1/550 |
| elephant | 1/560 |
| horse | 1/600 |
| shark | 1/2496 |
| hippopotamus | 1/2789 |
Brain size usually increases with body size in animals (is positively correlated), i.e. large animals usually have larger brains than smaller animals.[9] The relationship is not linear, however. Generally, small mammals have relatively larger brains than big ones. Mice have a direct brain/body size ratio similar to humans (1/40), while elephants have a comparatively small brain/body size (1/560), despite being quite intelligent animals.[9][10]
Several reasons for this trend are possible, one of which is that neural cells have a relative constant size. Some brain functions, like the brain pathway responsible for a basic task like drawing breath, are basically similar in a mouse and an elephant. Thus, the same amount of brain matter can govern breathing in a large or a small body. While not all control functions are independent of body size, some are, and hence large animals need comparatively less brain than small animals. This phenomenon has been called the cephalization factor: E = CS2, where E and S are brain and body weights respectively, and C is the cephalization factor.[11] To compensate for this factor, a formula has been devised by plotting the brain/body weight of various mammals against each other and a curve fitted so as to give best fit to the data.[12]
The cephalization factor and the subsequent encephalization quotient was developed by H.J. Jerison in the late 1960s.[13] The formula for the curve varies, but an empirical fitting of the formula to a sample of mammals gives 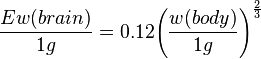 .[8] As this formula is based on data from mammals, it should be applied to other animals with caution. For some of the other vertebrate classes the power of 3/4 rather than 2/3 is sometimes used, and for many groups of invertebrates the formula may give no meaningful results at all.[8]
EQ and intelligence in mammals
Intelligence in animals is hard to establish, but the larger the brain is relative to the body, the more brain weight might be available for more complex cognitive tasks. The EQ formula, as opposed to the method of simply measuring raw brain weight or brain weight to body weight, makes for a ranking of animals that coincide better with observed complexity of behaviour.
Mean EQ for mammals is around 1, with carnivorans, cetaceans and primates above 1, and insectivores and herbivores below. This reflects two major trends. One is that brain matter is extremely costly in terms of energy needed to sustain it.[14] Animals which live on relatively nutrient poor diets (plants, insects) have relatively little energy to spare for a large brain, while animals living from energy-rich food (meat, fish, fruit) can grow larger brains. The other factor is the brain power needed to catch food. Carnivores generally need to find and kill their prey, which presumably requires more cognitive power than browsing or grazing.[15][16]
Another factor affecting relative brain size is sociality and flock size.[17] Similarly, dogs (a social species) have a higher EQ than cats (a mostly solitary species). Animals with very large flock size and/or complex social systems consistently score high EQ, with dolphins and orcas having the highest EQ of all cetaceans,[4] and humans with their extremely large societies and complex social life topping the list by a good margin.[1]
Comparisons with non-mammalian animals
Manta rays have the highest for a fish,[18] and either octopuses[11] or jumping spiders[19] have the highest for an invertebrate. Despite the jumping spider having a huge brain for its size, it is minuscule in absolute terms, and humans have a much higher EQ, despite having a lower raw brain-to-body weight ratio.[20][21][22] Mean EQ for reptiles are about one tenth of the EQ for mammals. EQ in birds (and estimated EQ in dinosaurs) generally also falls below that of mammals, possibly due to lower thermoregulation and/or motor control demands.[23] Estimation of brain size in the oldest known bird, Archaeopteryx, shows it had an EQ well above the reptilian range, and just below that of living birds.[24]
Biologist Stephen Jay Gould has noted that if one looks at vertebrates with very low encephalization quotients, their brains are slightly less massive than their spinal cords. Theoretically, intelligence might correlate with the absolute amount of brain an animal has after subtracting the weight of the spinal cord from the brain.[25] This formula is useless for invertebrates because they do not have spinal cords or, in some cases, central nervous systems.
EQ in paleoneurology
Behavioural complexity in living animals can to some degree be observed directly, making the predictive power of the encephalization quotient less relevant. It is however central in paleoneurology, where the endocast of the brain cavity and estimated body weight of an animal is all one has to work from. The behaviour of extinct mammals and dinosaurs are typically investigated using EQ formulas.[13]
Criticism
Recent research indicates that whole brain size is a better measure of cognitive abilities than EQ for primates at least.[26] The relationship between brain-to-body mass ratio and complexity are not alone in influencing intelligence. Other factors, such as the recent evolution of the cerebral cortex and different degrees of brain folding,[27] which increases the surface area (and volume) of the cortex, is positively correlated to intelligence in humans.[28]
See also
- Brain-to-body mass ratio
- Cranial capacity
- Encephalization
- Neuroscience and intelligence
References
- ↑ 1.0 1.1 Gerhard Roth und Ursula Dicke (May 2005). "Evolution of the brain and Intelligence". TRENDS in Cognitive Sciences 9 (5): 250–7. doi:10.1016/j.tics.2005.03.005. PMID 15866152.
- ↑ William Perrin. Encyclopedia of Marine Mammals. p. 150.
- ↑ 3.0 3.1 Marino, Lori (2004). "Cetacean Brain Evolution: Multiplication Generates Complexity" (PDF). International Society for Comparative Psychology (The International Society for Comparative Psychology) (17): 1–16. Retrieved 2010-08-29.
- ↑ 4.0 4.1 Marino, L. and Sol, D. and Toren, K. and Lefebvre, L. (2006). "Does diving limit brain size in cetaceans?". Marine Mammal Science 22 (2): 413–425. doi:10.1111/j.1748-7692.2006.00042.x.
- ↑ Hill, Kyle. "How science could make a chimp like Dawn of the Planet of the Apes’ Caesar's". The Nerdist. Retrieved 10 December 2014.
- ↑ Shoshani, Jeheskel; Kupsky, William J.; Marchant, Gary H. (30 June 2006). "Elephant brain Part I: Gross morphology, functions,comparative anatomy, and evolution". Brain Research Bulletin 70 (2): 124–157. doi:10.1016/j.brainresbull.2006.03.016. PMID 16782503.
- ↑ G.Rieke. "Natural Sciences 102: Lecture Notes: Emergence of Intelligence". Retrieved 2011-02-12.
- ↑ 8.0 8.1 8.2 Moore, J. (1999): Allometry, University of California, San Diego
- ↑ 9.0 9.1 9.2 http://serendip.brynmawr.edu/bb/kinser/Int3.html
- ↑ Hart, B. L.; Hart, L. A.; McCoy, M.; Sarath, C. R. (November 2001). "Cognitive behaviour in Asian elephants: use and modification of branches for fly switching". Animal Behaviour (Academic Press) 62 (5): 839–847. doi:10.1006/anbe.2001.1815. Retrieved 2007-10-30.
- ↑ 11.0 11.1 Gould (1977) Ever since Darwin, c7s1
- ↑ Jerison, H.F. (1983). Eisenberg, J.F. & Kleiman, D.G., ed. Advances in the Study of Mammalian Behavior. Pittsburgh: Special Publication of the American Society of Mammalogists, nr. 7. pp. 113–146.
- ↑ 13.0 13.1 Brett-Surman, Michael K.; Holtz, Thomas R.; Farlow, James O. (eds.). The complete dinosaur. Illustrated by Bob Walters (2nd ed.). Bloomington, Ind.: Indiana University Press. pp. 191–208. ISBN 978-0-253-00849-7.
- ↑ Isler, K.; van Schaik; C. P (22 December 2006). "Metabolic costs of brain size evolution". Biology Letters 2 (4): 557–560. doi:10.1098/rsbl.2006.0538. PMC 1834002. PMID 17148287.
- ↑ Savage, J.G. (1977). "Evolution in carnivorous mammals". Palaentology. 20, part 2: 237–271. Retrieved 19 February 2013.
- ↑ Lefebvre, Louis; Reader, Simon M.; Sol, Daniel (1 January 2004). "Brains, Innovations and Evolution in Birds and Primates". Brain, Behavior and Evolution 63 (4): 233–246. doi:10.1159/000076784. Retrieved 19 February 2013.
- ↑ Susanne Shultz and R.I.M Dunbar. "Both social and ecological factors predict ungulate brain size". doi:10.1098/rspb.2005.3283.
- ↑ Striedter, Georg F. (2005). Principles of brain evolution. Sunderland, Mass.: Sinauer. ISBN 0-87893-820-6.
- ↑ "Jumping Spider Vision". Retrieved 2009-10-28.
- ↑ Meyer, W., Schlesinger, C., Poehling, H.M. & Ruge, W. (1984): Comparative and quantitative aspects of putative neurotransmitters in the central nervous system of spiders (Arachnida: Araneida). Comparative Biochemical Physiology no 78 (C series): pp 357-62.
- ↑ James K. Riling; Insel, TR (1999). "The Primate Neocortex in Comparative Perspective using Magnetic Resonance Imaging". Journal of Human Evolution 37 (2): 191–223. doi:10.1006/jhev.1999.0313. PMID 10444351.
- ↑ Suzana Herculano-Houzel (2009). "The Human Brain in Numbers- A Linearly Scaled-Up Primae Brain". Frontiers in Human Neuroscience 3: 1–11 (2). doi:10.3389/neuro.09.031.2009. PMC 2776484. PMID 19915731.
- ↑ Paul, Gregory S. (1988) Predatory dinosaurs of the world. Simon and Schuster. ISBN 0-671-61946-2
- ↑ Hopson J.A. (1977). "Relative Brain Size and Behavior in Archosaurian Reptiles". Annual Review of Ecology and Systematics 8: 429–448. doi:10.1146/annurev.es.08.110177.002241.
- ↑ Bligh's Bounty at the Wayback Machine (archived July 9, 2001)
- ↑ "Overall Brain Size, and Not Encephalization Quotient, Best Predicts Cognitive Ability across Non-Human Primates". Brain Behav Evol 70: 115–124. 2007. doi:10.1159/000102973.
- ↑ "Cortical Folding and Intelligence". Retrieved 2008-09-15.
- ↑ Haier, R.J., Jung, R.E., Yeo, R.C., Head, K. and Alkired, M.T. (Sep 2004). "Structural brain variation and general intelligence". NeuroImage 23 (1): 425–33. doi:10.1016/j.neuroimage.2004.04.025. PMID 15325390.