Electricity sector in Germany
- Nuclear: 91.8 TWh (17.2%)
- Brown Coal: 140.7 TWh (26.4%)
- Hard Coal: 110.1 TWh (20.7%)
- Natural Gas: 33.9 TWh (6.4%)
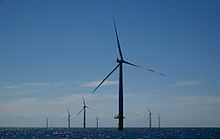
- Wind: 51.4 TWh (9.7%)
- Solar: 32.8 TWh (6.2%)
- Biomass: 53 TWh (10.0%)
- Hydro: 18.5 TWh (3.5%)
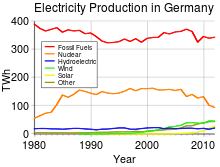
In 2014, the electricity sector in Germany was composed of 53% fossil, 17% nuclear and 30% renewable energy sources. Renewables increased their production by 6 terawatt-hours (TWh) or 4% compared to 2013, and accounted for a total of 156 TWh or about 30% of net-generated electricity, despite the fact that hydroelectricity recorded a decrease in production due to unfavorable weather conditions.[1]
While nuclear's power production decreased only slightly when comparing 2014 to 2013, electricity generated from brown coal, hard coal and gas-fired power plants significantly decreased by 3%, 9.5% and 13.8%, respectively.[1]
Germany has defined a planned policy of phasing-out nuclear power by 2022.
Consumption
Germany produced power per person in 2008 equal to EU15 average (EU15: 7,409 kWh/person) and 77% of the OECD average (8,991 kWh/person).[3]
Electricity trade in Germany
Germany, the largest exporter of electricity with 10% of the overall exports, reinforced its position as a net exporter by 20% during the year 2010[4]
Electricity per person and by power source
As of November 2014 Swedish authorities have not published "Electricity production by power source in different countries" after year 2009.
According to the Guardian there were days in summer 2014 when Germany generated 75% of its power from the wind and the sun.[5]
| colspan="13" align="center" style=”background:#BFD7FF;”"background-color: #ddf;" |Electricity per person in Germany* (kWh/inhabitant)[3][6] | ||||||||||||
|---|---|---|---|---|---|---|---|---|---|---|---|---|
| Use | Production | Export | Exp. % | Fossil | Nuclear | Nuc. % | Other RE* | Bio+waste | Wind | Non RE use* | RE % | |
| 2004 | 7,445 | 7,476 | 32 | 0.4% | 4,603 | 2,025 | 27.2% | 654 | 194 | 6,597 | 11.4% | |
| 2005 | 7,468 | 7,523 | 55 | 0.7% | 4,674 | 1,977 | 26.5% | 670 | 201 | 6,597 | 11.7% | |
| 2006 | 7,528 | 7,727 | 199 | 2.6% | 4,796 | 1,706 | 22.7% | 856 | 369 | 6,303 | 16.3% | |
| 2008 | 7,450 | 7,693 | 243 | 3.3% | 4,635 | 1,804 | 24.2% | 873 | 381 | 6,196 | 16.8% | |
| 2009 | 7,051 | 7,200 | 149 | 2.1% | 4,314 | 1,644 | 23.3% | 288* | 491 | 461* | 5,811 | 17.6% |
| * This data for Germany is extracted from the international column of a Swedish report * Other RE is waterpower, solar and geothermal electricity and wind power until 2008 * Non RE use = use – production of renewable electricity * RE % = (production of RE / use) * 100% Note: European Union calculates the share of renewable energies in gross electrical consumption. | ||||||||||||
Mode of production
According to the IEA the gross production of electricity was 631 TWh in 2008 which gave the 7 th position among the world top producers in 2010. The top seven countries produced 59% of electricity in 2008. The top producers were the United States (21.5%), China (17.1%), Japan (5.3%), Russia (5.1%), India (4.1%), Canada (3.2%) and Germany (3.1%).[7]
Coal
In 2008, power generation from coal contributed 291 terawatt-hours (TWh) or 46% to the overall production of 631 TWh. Germany remains one of the world's largest power producer from coal besides China (2,733 TWh), USA (2,133 TWh) and India (569 TWh).[7]
Nuclear power
Germany has defined a firm active phase-out policy of nuclear power. Eight nuclear power plants were shut down after the Fukushima accident for ever. All nuclear power plants will be phased out by the end of 2022. According to BMU this is an opportunity for future generations.[8]
Siemens is the only significant nuclear constructor in Germany and nuclears share was 3% of their business in 2000.[9] In 2006 the large international bribes of Siemens in the energy and telecommunication business were revealed. The case was investigated e.g. in Nigeria, the United States, Greece and South Korea.[10]
The installed nuclear power capacity in Germany was 20 GW in 2008 and 21 GW in 2004. The production of nuclear power was 148 TWh in 2008 (6 th top by 5.4% of world total) and 167 TWh in 2004 (4 th top by 6.1% of world total).[7][11]
In 2009 compared to 2004 the nuclear power was produced 19% less and its share had declined smoothly with time from 27% units to 23% units. The share of renewable electricity increased substituting the nuclear power.[3]
Renewable electricity
Renewable electricity in 2010 was 101.7 TWh including wind power 36.5 TWh, biomass and biowaste 33.5 TWh, hydropower 19.7 TWh and photovoltage solar power 12.0 TWh.[12] In the first half of 2012, 25.1% of the German electricity demand was generated by renewable energies.[13]
According to the Öko-Institut the renewable electricity share could be increased from 6% in 2000 to 35% in 2020.[14] According to BMU the share was ca 16% in 2009. Erneuerbare-Energien-Gesetz (EEG) provide the power connection and feed-in tariff (since 1991) for the renewable energy. The renewable electricity mix in 2009 included wind power 38 TWh, biomass 25 TWh, hydropower 19 TWh, photovoltage solar power 6 TWh and biowaste 5 TWh, According to BMU the share of renewable electricity increased 7% between 2009 and 2004 and 10% in 2000-2009.[15]
Up to 2009, providers of German wind power were Enercon 60%, Vestas 19% and REpower Systems 9%.[16] Installed wind power in Germany was 27.214 GW at the end of 2010 and 25.777 GW at the end of 2009. The share of wind power in the end of 2010 was in average 9.4% of electricity need. This was 5 th top in Europe behind Denmark (24% of electricity), Spain (14.4%), Portugal(14%) and Ireland (10.1%).[16]
Grid
Grid owners included in 2008 RWE, EnBW, Vattenfall and E.ON. According to the European Commission the electricity producers should not own the electricity grid to ensure free electricity competition. The European Commission accused E.ON of the misuse of markets in February 2008. Consequently, E.ON sold its share of the grid network.[17]
- 50Hertz Transmission GmbH (owned by Elia, formerly owned by Vattenfall)
- Amprion GmbH (RWE)
- Tennet TSO GmbH (owned by TenneT, formerly owned by EON)
- EnBW TNG (EnBW)
In Germany, there exist also a single-phase AC grid operated with 16.7 Hz for power supply of railway lines, see List of installations for 15kV AC railway electrification in Germany, Austria and Switzerland.
See also
| Wikimedia Commons has media related to Power plants in Germany. |
References
- ↑ 1.0 1.1 1.2 "Electricity production from solar and wind in Germany in 2014 (German version)" (PDF). http://www.ise.fraunhofer.de/''. Fraunhofer Institute, Germany. 5 January 2015. pp. 2,3. Retrieved 5 January 2015.
- ↑ U.S. Energy Information Administration International Energy Statistics - Electricity Generation, 2011
- ↑ 3.0 3.1 3.2 German numbers extracted from Energy in Sweden, Facts and figures, The Swedish Energy Agency, (in Swedish: Energiläget i siffror), Table: Specific electricity production per inhabitant with breakdown by power source (kWh/person), Source: IEA/OECD 2006 T23, 2007 T25, 2008 T26, 2009 T25 and 2010 T49.
- ↑ .Germany Power Market, Enerdata Yearbook Publication 2011
- ↑ The IPCC is stern on climate change – but it still underestimates the situation The Guardian, Sunday 2 November 2014
- ↑ Energy in Sweden - facts and figures 2012 - Figures for 2009 Table 53: Electricity production by power source, 2009, in kWh/capita, page 59, 2012
- ↑ 7.0 7.1 7.2 IEA Key stats 2010 pages electricity 27 gas 13,25 fossil 25 nuclear 17
- ↑ The path to the energy of the future - safe, affordable and environmentally sound June 2011 BMU Germany
- ↑ Climate Change and Nuclear Power WWF pages 21, 22
- ↑ [Siemensin lahjusskandaali paisuu edelleen] yle 23.11.2006
- ↑ IEA Key energy statistics 2006
- ↑ Renewable energy sources 2010 23 March 2011Federal Ministry for Environment, Nature Conservation and Nuclear Safety
- ↑ http://www.bdew.de/internet.nsf/id/20120726-pi-erneuerbare-energien-liefern-mehr-als-ein-viertel-des-stroms-de/$file/Strom_Erneuerbaren_Energien_1_Halbjahr_2012.pdf Electricity - Renewable Energies in the first half of 2012
- ↑ Climate Change and Nuclear Power WWF 2000 page 17
- ↑ Development of renewable energy sources in Germany in 2009 - Graphics and tables BMU 18.3.2010 page10
- ↑ 16.0 16.1 Wind in power 2010 European statistics EWEA February 2011 pages 11, 17
- ↑ Lehmänkaupat hämmentävät EU:n energianeuvotteluja, Helsingin Sanomat 1.3.2008 B11
| ||||||||||||||||||