Electricity sector in France
 |
|
 | |
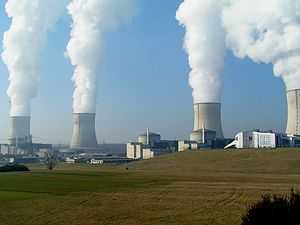
| Left: The Cattenom Nuclear Power Plant site near Luxemburg Right: Wind turbines in Lower Normandy Bottom: The Cruas Nuclear Power Station at night | |
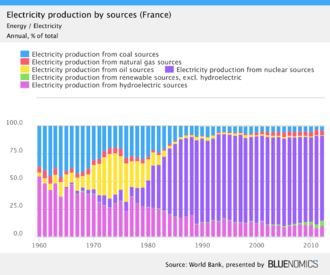
The electricity sector in France is dominated by nuclear power, which accounted for 77% of total production in 2012, while renewables and fossil fuels accounted for 15% and 8%, respectively.[1] France has the largest share of nuclear electricity in the world. The country is also among the world's biggest net exporters of electricity. The French nuclear power sector is almost entirely owned by the French government and the degree of the government subsidy is difficult to ascertain because of a lack of transparency.[2] The production of the nuclear power in France decreased 12% in 2009 compared to 2004 equivalent to 8% units share less nuclear power. It was almost equal to the 7% drop in electricity export.
Consumption

In 2008 consumption of electricity was on average 8,233 kWh/person. This corresponded to 110% of the EU15 average (7,409 kWh/person) and 91% of the OECD average (8,991 kWh/person).[3]
Electricity per person and by power source
| Electricity per capita in France (kWh/ hab.)[3] | ||||||||||||
|---|---|---|---|---|---|---|---|---|---|---|---|---|
| Use | Production | Export | Exp. % | Fossil | Nuclear | Nuc. % | Other RE* | Bio+waste | Wind | Non RE use* | RE %* | |
| 2004 | 8,204 | 9,203 | 999 | 12.2% | 849 | 7,209 | 87.9% | 1,061 | 83 | 7,060 | 13.9% | |
| 2005 | 8,215 | 9,176 | 961 | 11.7% | 970 | 7,201 | 87.7% | 924 | 81 | 7,210 | 12.2% | |
| 2006 | 8,140 | 9,041 | 901 | 11.1% | 897 | 6,977 | 85.7% | 1,083 | 85 | 6,972 | 14.3% | |
| 2008 | 8,233 | 8,984 | 751 | 9.1% | 853 | 6,872 | 83.5% | 1,168 | 91 | 6,974 | 15.3% | |
| 2009 | 7,951 | 8,351 | 400 | 5.0% | 871 | 6,371 | 80.1% | 897* | 93 | 121* | 6,840 | 14.0% |
| * Other RE is waterpower, solar and geothermal electricity and wind power until 2008 * Non RE use = use – production of renewable electricity * RE % = (production of RE / use) * 100% Note: European Union calculates the share of renewable energies in gross electrical consumption. | ||||||||||||
Mode of production
Coal (4.08%) |
Natural gas (3.69%) |
|
|
According to the IEA, French gross production of electricity amounted to 559 terawatt-hours (TWh) in 2012,[4]:17 slightly down from 570 and 567 TWh produced in 2008 and 2004, respectively.
France is the world's 8th largest producer of electricity. In 2012, the top ten countries prodcued 7,290 TWh, or 66.7% of global electricity production of 22,668 TWh. These countries were China (22%), followed by the United States (18.8%), India (5.0%), Russia (4.7%), Japan (4.5%), Canada (2.8%), Germany (2.7%), France (2.5%), Brazil (2.4%), and South Korea (2.3%). The rest of the world produced 32.3%.[4]:27[5]
France is also the world's second largest producer of nuclear electricity, behind the United States and ahead of Russia and Korea. In terms of nuclear's share on the total domestic electricity generation, France has by far the highest percentage portion of any country in the world (76%, also see chart "Electricity production by source").[4]:17
Maybe contrary to expectation, France imported 23 megatonnes (Mt) of oil products in 2012, making it Europe's largest, and the world's 5th largest net-importer of fossil oil, behind Japan (37 Mt), Indonesia (27 Mt), China (25 Mt), and Mexico (24 Mt).[4]:21
Nuclear power
The French nuclear power is almost entirely owned by the French government and its electricity is sold to the government. According to Al Gore the degree of the government subsidy is difficult to ascertain because of a lack of transparencies in the finances of the operation.[2]
France has the largest share of electricity from nuclear power in the world. According to the IEA 77% of its domestic electricity was generated by nuclear power in 2013. The second was Belgium 52.1%, third Slovakia 51.7% and followed by Hungary 50.7%, Ukraine 43.6%, Sweden 42.7%, Switzerland 36.4%, the Czech Republic 35.9%, Slovenia 33.6% and Finland 33.3%[6]
In terms of installed capacity and produced power in 2013 France was the top second nuclear electricity country in the world behind the United States. Installed nuclear capacity was 63.1 GW and power production 403.7 TWh.[6]
The Commissariat à l’Énergie Atomique is the national authority in France. Nuclear companies include EdF and Areva. Électricité de France (EdF) is the main electricity producer. Eurodif is the uranium enrichment plant. Areva NC (France) and Rio Tinto (UK) are the top uranium companies of the world.
France reprocesses its nuclear waste to retrieve plutonium and uranium for use as additional fuel. Fission products are stored in La Hague facility until a deep geological repository for high-level waste can be constructed. A repository for low-level and short-lived intermediate-level nuclear waste is already operational.[7]
The European Pressurized Reactor (EPR) at Flamanville, the first new nuclear reactor to be built in France in 15 years, is now expected to open in 2016 instead of the original starting date of 2012, and will cost €8.5bn instead of the original estimate of €3.3bn.[8]
Hydro power
Installed hydro electricity power capacity was 25 GW in 2007.[9]
Wind power
Installed wind power in France was 5,660 MW at the end of 2010 and 4,574 MW at the end of 2009. The share of wind power in the end of 2010 was in average 2.3% of electricity need.[10]
In 2013 electric energy from wind power in France was only produced in onshore wind farms. However, on January 25, 2011, President Nicolas Sarkozy confirmed the tendering process to build France's first five offshore wind farms, expected to have a capacity of 3GW and to be sited off the Atlantic coast between Saint-Nazaire and Dieppe/Le Tréport.[11][12] Tender documents were to be sent out on April 1, with the winning bid announced in early 2012.[12] A second round of bidding to provide a further 3GW of capacity is expected in 2012.[12]
| EU and France Wind Energy Capacity (MW)[13][14][15][16] | ||||||||||||||||
|---|---|---|---|---|---|---|---|---|---|---|---|---|---|---|---|---|
| No | Country | 2012 | 2011 | 2010 | 2009 | 2008 | 2007 | 2006 | 2005 | 2004 | 2003 | 2002 | 2001 | 2000 | 1999 | 1998 |
| - | EU-27 | 105,696 | 93,957 | 84,074 | 74,767 | 64,712 | 56,517 | 48,069 | 40,511 | 34,383 | 28,599 | 23,159 | 17,315 | 12,887 | 9,678 | 6,453 |
| 5 | France | 7,196 | 6,800 | 5,660 | 4,492 | 3,404 | 2,454 | 1,567 | 757 | 390 | 257 | 148 | 93 | 66 | 25 | 19 |
Solar power
France had 4.028 GW of photovoltaics at the end of 2012, installing 1.079 GW that year. The electricity generated in France by photovoltaics was 4,000 GWh in 2011.[17] The largest completed solar park is the 115 MW Toul-Rosières Solar Park.[18]
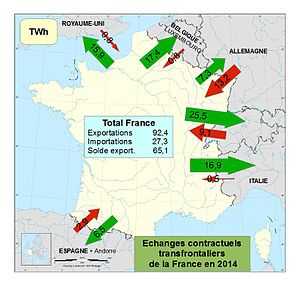
Export
France was the leader in the export of electricity in 2008: 48 TWh followed by Paraguay 46 TWh and Canada 32 TWh.[9]
Power stations
See also
| Wikimedia Commons has media related to Power plants in France. |
References
- ↑ 1.0 1.1 Electricity production by sources in France 1960–2012, 6 November 2014, http://www.bluenomics.com
- ↑ 2.0 2.1 Al Gore: Our Choice, A plan to solve the climate crises, Bloomsbury 2009 page 156
- ↑ 3.0 3.1 Energy in Sweden, Facts and figures, The Swedish Energy Agency, (in Swedish: Energiläget i siffror), Table: Specific electricity production per inhabitant with breakdown by power source (kWh/person), Source: IEA/OECD 2006 T23, 2007 T25, 2008 T26, 2009 T25 and 2010 T49.
- ↑ 4.0 4.1 4.2 4.3 International Energy Ageny, IEA—Key World Energy Statistics 2012, published 2014
- ↑ IEA Key energy statistics 2006
- ↑ 6.0 6.1 IEA Nuclear Share of Electricity Generation in 2013
- ↑ "Nuclear Power in France". WNA. April 2001. Retrieved 02-06-2011. Check date values in:
|accessdate=(help) - ↑ "EDF raises French EPR reactor cost to over $11 billion". Reuters. 3 December 2012. Retrieved 31 March 2013.
- ↑ 9.0 9.1 IEA Key stats 2010 pages electricity 27 gas 13,25 fossil 25 nuclear 17
- ↑ Wind in power 2010 European statistics EWEA February 2011 pages 11, 17
- ↑ Sarkozy confirms €10bn offshore wind plan BusinessGreen, published 2011-01-25, accessed 2011-05-10
- ↑ 12.0 12.1 12.2 Wind energy fans welcome sarkozy plans but question timing Actmedia, published 2011-01-27, accessed 2011-05-10
- ↑ EWEA Staff (2010). "Cumulative installed capacity per EU Member State 1998 - 2009 (MW)". European Wind Energy Association. Retrieved 2010-05-22.
- ↑ EWEA Staff (February 2011). "EWEA Annual Statistics 2010" (PDF). European Wind Energy Association. Retrieved 2011-01-31.
- ↑ EWEA Staff (February 2012). "EWEA Annual Statistics 2011" (PDF). European Wind Energy Association. Retrieved 2011-02-18.
- ↑ Wind in power: 2012 European statistics February 2013
- ↑ Photovoltaic Barometer
- ↑ Marguerite Fund Buys Into France’s Largest Solar Park
| ||||||||||||||||||
