Electoral results of the Portuguese Communist Party
| Portuguese Communist Party |
|
Communist Youth |
|
Avante! |
|
Communism |
| Communism Portal |
This is a table of the electoral results of the Portuguese Communist Party. Despite the Party had been founded in 1921, the party experienced little time as a legal party, being forced into clandestinity after a military coup in 1926. In the following decades, Portugal was dominated by the dictatorial regime led by António Oliveira Salazar, that kept the Party illegal. Although the regime allowed elections during some periods, the Party, given its illegal status, could never legally enter the electoral process and the heavy manipulation of the electoral results never allowed a democratic candidate to win. The regime would only end in 1974, with the Carnation Revolution, that implemented broad democratic changes in the country.
Since then, four types of elections are held with different periodicity. The head of state, the President of the Republic, is elected for a five-year term, the Parliament is elected for a four-year term, like the municipal administrations, that since 1985, are also elected for a four-year term. Azores and Madeira elect a regional parliament each four years. Along with these, European elections are also held with a periodicity of five years since the country joined the European Union in 1986.
Since the revolution, the Party participated in every election, from the late 1970s until 1987, it ran in coalition with the Portuguese Democratic Movement in the United People Alliance (APU). In 1987, the APU was disbanded and since then, the Party participated in coalition with the Ecologist Party "The Greens" inside the Unitarian Democratic Coalition (CDU). The peak of the Party's electoral influence was from the Carnation Revolution until the early 1980s, since then, and mainly after the fall of the Socialist bloc in eastern Europe, the Party's electoral success was reduced, however, it still keeps a presence in the Parliament and still holds the presidency of 34 municipalities and several parishes.
Results
Results in parliamentary elections
| Results in Parliamentary Elections (year links to election page) | ||||||||
|---|---|---|---|---|---|---|---|---|
| Year | Coalition | Votes | % | Mandates | ||||
| 1976 | |
|
|
| ||||
| 1979 | |
|
|
| ||||
| 1980 | |
|
|
| ||||
| 1983 | |
|
|
| ||||
| 1985 | |
|
|
| ||||
| 1987 | |
|
|
| ||||
| 1991 | |
|
|
| ||||
| 1995 | |
|
|
| ||||
| 1999 | |
|
|
| ||||
| 2002 | |
|
|
| ||||
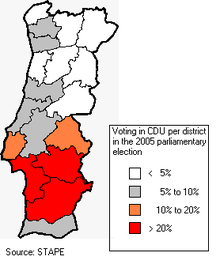
| 2005 | |
|
|
| ||||
| 2009 | |
|
|
| ||||
| 2011 | |
|
|
| ||||
Note:
- In 1991 the overall number of MPs changed from the original 250 to 230.
Results in local elections
| Results in Local Elections (year links to election page) | ||||||||
|---|---|---|---|---|---|---|---|---|
| Year | Coalition | Votes | % | Mandates | ||||
| 1976 | |
|
|
| ||||
| 1979 | |
|
|
| ||||
| 1982 | |
|
|
| ||||
| 1985 | |
|
|
| ||||
| 1989 | |
|
|
| ||||
| 1993 | |
|
|
| ||||
| 1997 | |
|
|
| ||||
| 2001 | |
|
|
| ||||
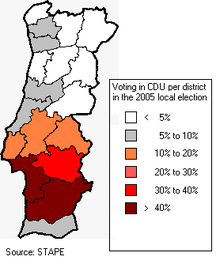
| 2005 | |
|
|
| ||||
| 2009 | |
|
|
| ||||
| 2013 | |
|
|
| ||||
Results in European Parliament elections
- These are the results for Democratic Unitarian Coalition, composed of the PCP, the PEV and the ID.
| Election year | # of overall votes |
% of overall vote |
# of overall seats won |
+/- | Notes |
|---|---|---|---|---|---|
| 1987 | 646,640 | 11.50 (#4) | 3 / 24 |
||
| 1989 | 594,961 | 14.41 (#3) | 4 / 24 |
|
|
| 1994 | 339,283 | 11.19 (#4) | 3 / 25 |
|
|
| 1999 | 357,575 | 10.32 (#3) | 2 / 25 |
|
|
| 2004 | 309,406 | 9.09 (#3) | 2 / 24 |
|
|
| 2009 | 379,787 | 10.64 (#4) | 2 / 22 |
|
|
| 2014 | 416,446 | 12.68 (#3) | 3 / 21 |
|
(source: Portuguese Electoral Commission)
Note:
- In 2004, after the enlargement of the European Union, the number of MEPs elected by Portugal decreased from the original 25 to 24, to 22 in 2009 and it further decreased to 21 in 2014.
Coalitions Info:
- The FEPU was composed of the PCP, the MDP/CDE and the FSP;
- The APU was composed of the PCP and the MDP/CDE, later it included the PEV;
- The CDU is composed of the PCP and the PEV.
Further notes:
- The election of 1975 was not a regular legislative election, but instead was an election of a Constituent Assembly.
- The Local election results report the voting for the Municipal Chambers only and don't include occasional coalitions in some municipalities, e.g. in Lisbon, between 1989 and 2001. Voting for the Municipal Assemblies and Parish Assemblies is usually higher (11.7% and 12.0%, respectively, in 2005).
- The number of mandates denotes the number of councillors in Local elections, MPs in Parliamentary elections and MEPs in European Parliament elections.
Results in presidential elections
| Results in Presidential Elections (year links to election page) | ||||||||
|---|---|---|---|---|---|---|---|---|
| Year | Candidate supported | Votes | % | Elected? | ||||
| 1976 | |
|
|
| ||||
| 1980 | |
|
|
| ||||
| 1986 | |
|
|
| ||||
| 1991 | |
|
|
| ||||
| 1996 | |
|
|
| ||||
| 2001 | |
|
|
| ||||
| 2006 | |
|
|
| ||||
| 2011 | |
|
|
| ||||
Notes:
- In 1980, Carlos Brito withdrew in favour of Ramalho Eanes.
- In 1986, the Party's first candidate was Ângelo Veloso, that later withdrew in favour of Salgado Zenha.
- In 1986, in the second round, the Party supported Mário Soares.
- In 1996, Jerónimo de Sousa withdrew in favour of Jorge Sampaio.
References
- "CNE Resultados". Comissão Nacional de Eleições. Retrieved 2005-05-17.
See also
- Portuguese Communist Party
- History of the Portuguese Communist Party
- History of Portugal
- Carnation Revolution
External links
In Portuguese:
- Portuguese Communist Party official web site
- History section of the Party's official website
- Avante Festival! official website
- Avante! newspaper online edition
- PCP's short biography by the Carnation Revolution archive center
In English: