Electoral district of Lee
| Lee South Australia—House of Assembly | |
|---|---|
|
Electoral district of Lee (green) in the Greater Adelaide area | |
| State | South Australia |
| Created | 1993 |
| MP | Stephen Mullighan |
| Party | Australian Labor Party |
| Namesake | Mary Lee |
| Electors | 25,971 (2014) |
| Area | 19.7 km2 (7.6 sq mi) |
| Demographic | Metropolitan |
| Coordinates | 34°51′31″S 138°29′56″E / 34.85861°S 138.49889°ECoordinates: 34°51′31″S 138°29′56″E / 34.85861°S 138.49889°E |
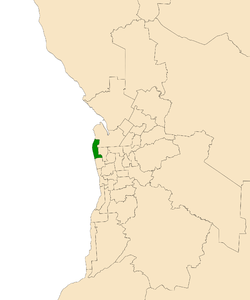
Lee is an electoral district of the House of Assembly in the Australian state of South Australia. Named after the women's suffrage campaigner Mary Lee, it is a 19.7 km² urban electorate on Adelaide's north-western beaches, taking in the suburbs of Birkenhead, Ethelton, Exeter, Glanville, Largs Bay, New Port, Peterhead, Semaphore, Semaphore Park, Semaphore South, Tennyson, West Lakes and West Lakes Shore, as well as parts of Grange and Seaton.
Lee was created as a safe seat for the Australian Labor Party in the 1991 electoral distribution to replace the abolished Albert Park. The first member for Lee, elected at the 1993 state election, was controversial Liberal MP Joe Rossi, holding the most marginal government seat on 1.1 percent. Rossi's election was unexpected but part of a large swing away from Labor throughout the state. The 1997 state election saw large swings back to Labor, Rossi's small margin meant he was one of the first to be defeated. Michael Wright reclaimed the seat for Labor.
Port Adelaide Enfield Mayor Gary Johanson who contested the 2012 Port Adelaide by-election as an independent contested Lee at the 2014 state election.[1] Wright did not re-contest his seat in 2014, Stephen Mullighan retained the seat for Labor.
Members for Lee
| Member | Party | Term | |
|---|---|---|---|
| Joe Rossi | Liberal Party of Australia | 1993–1997 | |
| Michael Wright | Australian Labor Party | 1997–2014 | |
| Stephen Mullighan | Australian Labor Party | 2014–present | |
Election results
| South Australian state election, 2014: Lee[2][3] | |||||
|---|---|---|---|---|---|
| Party | Candidate | Votes | % | ±% | |
| Labor | Stephen Mullighan | 9,418 | 41.0 | −5.8 | |
| Liberal | Liz Davies | 8,216 | 35.7 | +1.5 | |
| Independent | Gary Johanson | 2,581 | 11.2 | +11.2 | |
| Greens | Jo Seater | 1,794 | 7.8 | −0.2 | |
| Family First | Denis Power | 686 | 3.0 | −0.7 | |
| Independent | Melita Calone | 301 | 1.3 | +1.3 | |
| Total formal votes | 22,996 | 96.4 | +1.1 | ||
| Informal votes | 861 | 3.6 | −1.1 | ||
| Turnout | 23,857 | 91.9 | −1.4 | ||
| Two-party-preferred result | |||||
| Labor | Stephen Mullighan | 12,530 | 54.5 | −3.2 | |
| Liberal | Liz Davies | 10,466 | 45.5 | +3.2 | |
| Labor hold | Swing | −3.2 | |||
Notes
References
| ||||||