Elections in Brazil
 |
| This article is part of a series on the politics and government of Brazil |
|
|
|
Administrative divisions
|
| Foreign relations |
|
Politics portal |
Brazil elects on the national level a head of state – the president – and a legislature. The president is elected to a four-year term by absolute majority vote through a two-round system. The National Congress (Congresso Nacional) has two chambers. The Chamber of Deputies (Câmara dos Deputados) has 513 members, elected to a four-year term by proportional representation. The Federal Senate (Senado Federal) has 81 members, elected to an eight-year term, with elections every four years for alternatively one-third and two-third of the seats. Brazil has a multi-party system, with such numerous parties that often no one party has a chance of gaining power alone, and so they must work with each other to form coalition governments.
Schedule
Election
| Position | 2010 | 2011 | 2012 | 2013 | 2014 | 2015 | 2016 | 2017 |
|---|---|---|---|---|---|---|---|---|
| Type | Presidential (October) National Congress (October) Gubernatorial (October) States and Federal District Parliaments (October) | None | Mayors (October) City Councils (October) | None | Presidential (October) National Congress (October) Gubernatorial (October) States and Federal District Parliaments (October) | None | Mayors (October) City Councils (October) | None |
| President and vice president |
President and vice president | None | President and vice president | None | ||||
| National Congress | All seats (Chamber of Deputies) Two thirds (Federal Senate) | None | All seats (Chamber of Deputies) One third (Federal Senate) | None | ||||
| States, cities and municipalities | All positions (States and Federal District) | None | All positions (Municipalities) | None | All positions (States and Federal District) | None | All positions (Municipalities) | None |
Inauguration
| Position | 2011 | 2012 | 2013 | 2014 | 2015 | 2016 | 2017 | 2018 |
|---|---|---|---|---|---|---|---|---|
| Type | Presidential (January) National Congress (January) Gubernatorial (January) States and Federal District Parliaments (January) | None | Mayors (January) City Councils (January) | None | Presidential (January) National Congress (January) Gubernatorial (January) States and Federal District Parliaments (January) | None | Mayors (January) City Councils (January) | None |
| President and vice president |
1 January | None | 1 January | None | ||||
| National Congress | 1 January | None | 1 January | None | ||||
| States, cities and municipalities | 1 January | None | 1 January | None | 1 January | None | 1 January | None |
Electoral systems
Deputies are elected to the Chamber of Deputies using a form of party-list proportional representation known as the "open list."[1]
Senators are elected to the Federal Senate with a plurality of the vote in a first-past-the-post system, which is not proportional.[2] Three senators are elected for each state and for the Federal District.[3]
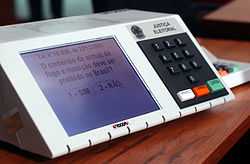
The Brazilian voting machines
Electronic voting was first introduced to Brazil in 1996; with the first tests carried out in the state of Santa Catarina. The primary design goal of the Brazilian voting machine is extreme simplicity, the model being a public phone booth.
The first Brazilian voting machines were developed in 1996 by a Brazilian partnership of three companies OMNITECH (previously known as TDA), Microbase and Unisys do Brasil attending the TSE RFP for the Brazilian Elections in 1996. This machine was a modified IBM PC 80386 compatible clone, known as UE96. In 1998, Diebold-Procomp, Microbase and Samurai (formerly known as OMNITECH) partnered to produce UE98. In 2000, Microbase and Diebold-Procomp developed the UE2000 together. In 2000, Brazil completed the first completely automated election.
The original operating system was VirtuOS, similar to DOS and includes multitasking support, was developed by Microbase. It was used in the 1996, 1998 and 2000 elections. In 2002, Unisys was unable to renew their partnership with Microbase, and were unable to reuse the VirtuOS based code. Microsoft stepped in, and provided licenses Windows CE operating system free of charge. In 2008, Diebold-Procomp migrated to a Linux OS to reduce costs.[4]
The Brazilian voting machine accomplishes three steps (voter identification, secure voting and tallying) in a single process, eliminating fraud based on forged or falsified public documents. Political parties have access to the voting machine's programs before the election for auditing. There still remain some questions about the security of the electronic voting system, but no case of election fraud has been uncovered:
- Critics argue that the voting machines do not produce receipt for the voter, nor maintain an internal paper based journal which would allow for vote auditing. This makes them highly dependent on trusting the software. The application program which verifies the internal integrity of the system is itself vulnerable to modification. An inspection by the City of Sto. Estevão, Bahia described the system of seals and closure of the machine as simple, and allowed easy access to the internal memory slot.
- There is the possibility to violate the voting, because the voter number is typed in one machine which is connected to the voting machine, but it is not possible to know that it means that it is the same name (person)clarify.
- Election workers could vote in place absent voters without their permission. However, as voting sections are composed of multiple workers drawn at random from the population as a means of preventing this type of fraud.

On the eve of an election, the election authorities in each State select a number of voting machines by lot (all available voting machines take part in that lot, identified by their serial number), and those machines so selected, instead of being used in actual pooling stations, are retained in the seat of the State's Regional Electoral Court for a "parallel voting", conducted for audit purposes in the presence of representatives designated by the political parties. The audit vote takes place on the same date as the election. This parallel voting is a mock election but the votes entered in the voting machine are not secret, instead they are witnessed by all party representatives present at the audit process. The whole audit is filmed, and the representatives of the political parties present for the audit direct publicly that a random quantity of votes are to be inserted in the machine for each candidate. A tally is kept of the instructions received from each party representative. Each party representative orders a number of votes to be inserted at the machine, but he only reveals that number, and the recipients, during the audit. So, the numbers are not previously known, because the only way they could be known by others is if there were a collusion between rival parties. At the end of the process, then, when all the parties have directed that certain number of votes then chosen are to be registered for each candidate in the audit vote, the votes ordered to be inserted by each party representative for each candidate are added up, and the total number of votes of the mock election is known, as well as the total number of votes of each candidate. Once the mock votes end and the profile of the vote is known, the electronic counting of the votes contained in the voting machines used during the audit takes place. The result indicated by the voting machines software has to correspond to the previously known result. As the machines were selected at random by lot, if the result given by the software corresponds to the previously known result resulting from the sum of the parties's public instructions (which has happened in all elections so far), the system is deemed by the election authorities as reliable for receiving, properly registering and accurately tallying the votes. Given that the machines are chosen at random, the reliability of the chosen ones is deemed to represent the reliability of the others. If the audit failed to produce a positive result (the matching of the votes counted to the sum of the instructions), then the whole election in the State in question would be void.
The voting system has been widely accepted, due in great part to the fact that it speeds up the vote count tremendously. In the 1989 presidential election between Fernando Collor de Mello and Luiz Inácio Lula da Silva, the vote count required nine days. In the 2002 general election, the count required less than 12 hours. In some smaller towns the election results are known minutes after the closing of the ballots.
Supporters of the electronic vote claim that unless the fraud were intentionally designed into the machines, it would be impossible to carry an extensive fraud in such a small amount of time. The Brazilian Supreme Electoral Court (TSE) regularly funds research aimed at improving security. The source code to the voting software is proprietary and the public is not able to examine it. In order to be able to recount the votes, a printing system has been developed and a new electoral registration system is planned.[5][6]
Brazil loans the machines to other countries. They have been used for elections in Paraguay and Ecuador, and there are plans to export the patented machines.
A new biometrics-based voting machine, with an additional apparatus that does the voter's fingerprint recognition before allowing the ballot to be cast, started being used in 2012.[7] TSE is gradually gathering the fingerprints of all registered voters to spread the process, that will be used by 22 million voters in the 2014 general election.[8]
2010 general election
Presidential election
| Presidential candidate | Running mate | 1st Round October 3 |
2nd Round October 31 | ||
|---|---|---|---|---|---|
| Popular vote | |||||
| Absolute | Percentage | Absolute | Percentage | ||
| Dilma Rousseff (PT) | Michel Temer (PMDB) | 47,651,434 | 46.91% | 55,752,529 | 56.05% |
| José Serra (PSDB) | Indio da Costa (DEM) | 33,132,283 | 32.61% | 43,711,388 | 43.95% |
| Marina Silva (PV) | Guilherme Leal (PV) | 19,636,359 | 19.33% | — | |
| Plínio de Arruda Sampaio (PSOL) | Hamilton Assis (PSOL) | 886,816 | 0.87% | — | |
| José Maria Eymael (PSDC) | José Paulo da Silva Neto (PSDC) | 89,350 | 0.09% | — | |
| José Maria de Almeida (PSTU) | Cláudia Durans (PSTU) | 84,609 | 0.08% | — | |
| Levy Fidélix (PRTB) | Luiz Eduardo Ayres Duarte (PRTB) | 57,960 | 0.06% | — | |
| Ivan Pinheiro (PCB) | Edmilson Costa (PCB) | 39,136 | 0.04% | — | |
| Rui Costa Pimenta (PCO) | Edson Dorta Silva (PCO) | 12,206 | 0.01% | — | |
| Valid votes | 101,590,153 | 91.36% | 99,463,917 | 93.30% | |
| → Blank votes | 3,479,340 | 3.13% | 2,452,597 | 2.30% | |
| → Null votes | 6,124,254 | 5.51% | 4,689,428 | 4.40% | |
| Total votes | 111,193,747 | 81.88% | 106,606,214 | 78.50% | |
| → Abstention | 24,610,296 | 18.12% | 29,197,152 | 21.50% | |
| Electorate | 135,804,433 | 100.00% | 135,804,433 | 100.00% | |
Parliamentary election
Summary of the 3 October 2010 National Congress election results
| Coalition | Parties | Chamber | Senate | ||||||
|---|---|---|---|---|---|---|---|---|---|
| Seats | % of seats | +/– | Elected seats | Total seats | % of seats | +/– | |||
| Lulista | PT | 88 | 17.1 | +5 | 12 | 15 | 18.5 | +7 | |
| PMDB | 79 | 15.3 | −10 | 16 | 20 | 24.6 | +3 | ||
| PR | 41 | 7.9 | +16 | 3 | 4 | 4.9 | — | ||
| PSB | 34 | 6.6 | +7 | 3 | 3 | 3.7 | — | ||
| PDT | 28 | 5.4 | +4 | 2 | 4 | 4.9 | −2 | ||
| PSC | 17 | 3.3 | +8 | 1 | 1 | 1.2 | — | ||
| PCdoB | 15 | 2.9 | +2 | 1 | 2 | 2.4 | +1 | ||
| PRB | 8 | 1.5 | +7 | 1 | 1 | 1.2 | −1 | ||
| PTC | 1 | 0.1 | −2 | 0 | 0 | 0.0 | — | ||
| PTN | 0 | 0.0 | — | 0 | 0 | 0.0 | — | ||
| Total | 311 | 60.6 | +37 | 39 | 50 | 61.7 | +8 | ||
| Opposition Centre-right |
PSDB | 53 | 10.3 | −13 | 5 | 11 | 13.5 | −5 | |
| DEM | 43 | 8.3 | −22 | 2 | 6 | 7.4 | −7 | ||
| PTB | 21 | 4.0 | −2 | 1 | 6 | 7.4 | −1 | ||
| PPS | 12 | 2.3 | −10 | 1 | 1 | 1.2 | +1 | ||
| PMN | 4 | 0.7 | +1 | 1 | 1 | 1.2 | +1 | ||
| PTdoB | 3 | 0.5 | +2 | 0 | 0 | 0.0 | — | ||
| Total | 136 | 26.5 | –44 | 10 | 25 | 30.8 | –11 | ||
| Lulista Out of coalition |
PP | 41 | 7.9 | — | 3 | 4 | 4.9 | +3 | |
| Opposition Out of coalition |
PV | 15 | 2.9 | +2 | 0 | 0 | 0.0 | −1 | |
| Opposition Out of coalition |
PSOL | 3 | 0.5 | — | 2 | 2 | 2.4 | +1 | |
| Lulista Out of coalition |
PHS | 2 | 0.3 | — | 0 | 0 | 0.0 | — | |
| Lulista Out of coalition |
PRP | 2 | 0.3 | +2 | 0 | 0 | 0.0 | — | |
| Lulista Out of coalition |
PRTB | 2 | 0.3 | +2 | 0 | 0 | 0.0 | — | |
| Lulista Out of coalition |
PSL | 1 | 0.1 | +1 | 0 | 0 | 0.0 | — | |
Past elections and referendums
| ||||||||||||||||||||||
Election results 1982–2014
Brazilian legislative elections (Chamber of Deputies), 1982–2014
| Parties | 1982 | 1986 | 1990 | 1994 | 1998 | 2002 | 2006 | 2010 | 2014 |
|---|---|---|---|---|---|---|---|---|---|
| Workers' Party | 3.5 | 6.9 | 10.2 | 12.8 | 13.2 | 18.4 | 15.0 | 16.9 | 14.0 |
| Brazilian Democratic Movement Party | 43.0 | 48.1 | 19.3 | 20.3 | 15.2 | 13.4 | 14.6 | 13.0 | 11.1 |
| Brazilian Social Democracy Party | - | - | 8.7 | 13.9 | 17.5 | 14.3 | 13.6 | 11.9 | 11.4 |
| Liberal Front Party/Democrats | - | 17.7 | 12.4 | 12.9 | 17.3 | 13.4 | 10.9 | 7.6 | 4.2 |
| Liberal Party / Republic Party | - | 2.8 | 4.3 | 3.5 | 2.5 | 4.3 | 4.4 | 7.6 | 5.8 |
| Brazilian Socialist Party | - | 0.9 | 1.9 | 2.2 | 3.4 | 5.3 | 6.2 | 7.1 | 6.5 |
| Progressive Party | - | - | - | 6.9 | 11.3 | 7.8 | 7.1 | 6.6 | 6.4 |
| Democratic Labour Party | 5.8 | 6.5 | 10.0 | 7.2 | 5.7 | 5.1 | 5.2 | 5.0 | 3.6 |
| Brazilian Labour Party | 4.5 | 4.5 | 5.6 | 5.2 | 5.7 | 4.6 | 4.7 | 4.2 | 4.0 |
| Green Party | - | - | - | 0.1 | 0.4 | 1.3 | 3.6 | 3.8 | 2.1 |
| Social Christian Party | - | - | 0.8 | 0.5 | 0.7 | 0.6 | 1.9 | 3.2 | 2.5 |
| Communist Party of Brazil | - | 0.8 | 0.9 | 1.2 | 1.3 | 2.2 | 2.1 | 2.8 | 2.0 |
| Popular Socialist Party | - | 0.9 | 1.0 | 0.6 | 1.3 | 3.1 | 3.9 | 2.6 | 2.0 |
| Brazilian Republican Party | - | - | - | - | - | - | 0.3 | 1.7 | 4.5 |
| Socialism and Freedom Party | - | - | - | - | - | - | 1.2 | 1.2 | 1.8 |
| Party of National Mobilization | - | - | 0.6 | 0.6 | 0.5 | 0.3 | 0.9 | 1.1 | 0.5 |
| Democratic Social / Reform Progressive Party | 43.2 | 7.8 | 8.9 | 9.4 | - | - | - | - | - |
| National Reconstruction Party / Christian Labour Party | - | - | 8.3 | 0.4 | 0.1 | 0.1 | 0.9 | 0.6 | 0.7 |
| Christian Democratic Party / Christian Social Democratic Party | - | 1.2 | 3.0 | - | 0.1 | 0.2 | 0.4 | 0.2 | 0.5 |
| Party of the Reconstruction of the National Order | - | - | - | 0.7 | 0.9 | 2.1 | 1.0 | - | - |
| Social Democratic Party | - | - | - | - | - | - | - | - | 6.2 |
| Republican Party of the Social Order | - | - | - | - | - | - | - | - | 2.0 |
| Solidarity | - | - | - | - | - | - | - | - | 2.7 |
| National Labour Party | - | - | - | - | 0.1 | 0.1 | 0.2 | 0.2 | 0.4 |
| National Ecologic Party | - | - | - | - | - | - | - | - | 0.7 |
| Labour Party of Brazil | - | - | 0.2 | - | 0.3 | 0.2 | 0.3 | 0.7 | 0.8 |
| Humanist Party of Solidarity | - | - | - | - | - | 0.3 | 0.5 | 0.8 | 0.9 |
| Progressive Republican Party | - | - | 0.2 | 0.5 | 0.4 | 0.3 | 0.3 | 0.3 | 0.7 |
| Social Liberal Party | - | - | - | - | 0.3 | 0.5 | 0.2 | 0.5 | 0.8 |
| Brazilian Labour Renewal Party | - | - | - | 0.1 | 0.1 | 0.3 | 0.2 | 0.3 | 0.5 |
| Others | 0.0 | 2.8 | 3.7 | 0.7 | 1.7 | 1.5 | 0.4 | 0.0 | 0.7 |
Referendums
Brazil has held three national referendums in its history. In the first, held on January 6, 1963, the people voted for the re-establishment of the presidential system of government (82% of valid ballots), which had been modified by a constitutional amendment in 1961. A second referendum, as ordered by the Federal Constitution of 1988, was held on April 21, 1993, when the voters voted for a republican form of government and reaffirmed the presidential system.
A third national referendum, on the prohibition of the commerce of personal firearms and ammunition, was held on October 23, 2005. The ban proposal was rejected by 64% of the voterate.
See also
- Electoral calendar
- Electoral system
- List of political parties in Brazil
References
- ↑ "Grumpy about voting reform". The Economist. 2011-02-22. Retrieved 2011-05-04.
- ↑ "The Federal Senate". Portal da Câmara dos Deputados. Retrieved 2011-05-04.
- ↑ Andrianantoandro, Andy (2010-10-14). "Brazil's Presidential Hopefuls Face Runoff, National Congress Needs Reform". FairVote.org. Retrieved 2011-05-04.
- ↑ Urna eletrônica troca Windows por software livre (Portuguese)
- ↑ A urna eletrônica pode ser violada?, Superinteressante (Portuguese)
- ↑ Urna eletrônica completa 18 anos com comemoração do TSE e preocupação de especialistas
- ↑
- ↑ Recadastramento Biométrico
External links
- Adam Carr's Election Archive
- Simulated voting machine (Portuguese) Courtesy of the Brazilian Supreme Electoral Court website. (Java required)
- Brief history of electronic voting in Brazil
- Brazil: The Perfect Electoral Crime (II) (Security analysis of the Brazilian voting machines by James Burk, Oct. 21, 2006)
- Electoral Law of Brazil
- Inelegibility Law of Brazil
| ||||||||||||||||||||||
| ||||||||||||||||||||||||||||||||||||||
| ||||||||||