Eddisbury (UK Parliament constituency)
| Eddisbury | |
|---|---|
|
County constituency for the House of Commons | |
|
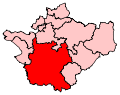
Boundary of Eddisbury in Cheshire. | |
|
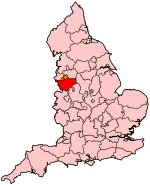
Location of Cheshire within England. | |
| County | Cheshire |
| Electorate | 65,914 (December 2010)[1] |
| Major settlements | Winsford, Audlem, Kelsall, Malpas and Tarporley |
| Current constituency | |
| Created | 1983 |
| Member of parliament | Stephen O'Brien (Conservative) |
| Number of members | One |
| Created from | Nantwich |
| 1885–1950 | |
| Number of members | One |
| Type of constituency | County constituency |
| Overlaps | |
| European Parliament constituency | North West England |
Eddisbury is a constituency[n 1] in Cheshire represented in the House of Commons of the UK Parliament since 1999 by Stephen O'Brien, a Conservative.[n 2]
Boundaries
The constituency is mostly rural, covering the south-west of Cheshire, noted in minerals for salt mining and within easy access to the cities of Liverpool, Manchester and the industrial and manufacturing centres of the Wirral Peninsula and Deeside. To the east of the seat lies part of Delamere Forest. The main town in the constituency is Winsford; other main settlements include Audlem, Kelsall, Malpas and Tarporley.
The seat contains electoral wards:[2]
- Barrow, Farndon, Kelsall, Malpas, Tarvin, Tattenhall, Tilston, and Waverton in the former Chester District
- Acton, Audlem, Bunbury, Minshull, Peckforton, and Wrenbury in the former Crewe and Nantwich Borough
- Cuddington and Oakmere, Davenham and Moulton, Mara, Tarporley and Oulton, Winsford Dene, Winsford Gravel, Winsford Over, Winsford Swanlow, Winsford Verdin, and Winsford Wharton in the former Vale Royal Borough
Latest boundary review
In 2007 the Boundary Commission's review led to minor changes to the existing arrangement as a consequence of population changes.The changes were approved in 2007 and came into effect at the 2010 general election.[3]
History
The constituency was re-established in 1983, largely replacing the former Nantwich constituency and is named for the former hundred of Eddisbury. Since then, it has always been held by a Conservative. Between 1983 and 1999, it was represented by Alastair Goodlad, who resigned upon being appointed the United Kingdom's High Commissioner to Australia. The ensuing by-election was won by Stephen O'Brien, who has held the seat since.
The closest the Labour Party has come to winning the seat was in the 1997 general election, when the Conservative majority was reduced to just 1,185. Eddisbury consists of mainly rural villages and small towns which are favourable to the Conservative party; Labour currently has local councillors only in two wards, in the constituency's largest town, Winsford. Labour fell from second to third place in the 2010 general election — the Conservative candidate held the seat with a majority of over 13,000 and a Liberal Democrat moved into second place.
Members of Parliament
MPs 1885–1950
| Election | Member[4] | Party | |
|---|---|---|---|
| 1885 | Henry James Tollemache | Conservative | |
| 1906 | Arthur Lyulph Stanley | Liberal | |
| 1910 | Harry Barnston | Conservative | |
| 1929 | Richard John Russell | Liberal | |
| 1931 | National Liberal | ||
| 1943 by-election | John Eric Loverseed | Common Wealth | |
| 1944 | Independent | ||
| 1945 | Labour | ||
| 1945 | Sir John Denman Barlow | National Liberal | |
| 1950 | constituency abolished | ||
MPs since 1983
| Election | Member[4] | Party | |
|---|---|---|---|
| 1983 | Alastair Goodlad | Conservative | |
| 1999 by-election | Stephen O'Brien | Conservative | |
Elections
Elections in the 2010s
| General Election 2015: Eddisbury | |||||
|---|---|---|---|---|---|
| Party | Candidate | Votes | % | ±% | |
| CISTA | George Antar | ||||
| Green | Andrew John Garman | ||||
| Labour | James Stewart Laing | ||||
| UKIP | Rob Millington | ||||
| Liberal Democrat | Ian Douglas Priestner | ||||
| Conservative | Antoinette Sandbach | ||||
UKIP originally selected Charles Dodman [5] who was replaced by James Millington.[6]
| General Election 2010: Eddisbury [7] | |||||
|---|---|---|---|---|---|
| Party | Candidate | Votes | % | ±% | |
| Conservative | Stephen O'Brien | 23,472 | 51.7 | +4.8 | |
| Liberal Democrat | Bob Thompson | 10,217 | 22.5 | +4.5 | |
| Labour | Pat Merrick | 9,794 | 21.6 | −10.5 | |
| UKIP | Charles Dodman | 1,931 | 4.3 | +1.3 | |
| Majority | 13,255 | 29.2 | |||
| Turnout | 45,414 | 69.5 | |||
| Conservative hold | Swing | +0.2 | |||
Elections in the 2000s
| General Election 2005: Eddisbury | |||||
|---|---|---|---|---|---|
| Party | Candidate | Votes | % | ±% | |
| Conservative | Stephen O'Brien | 21,181 | 46.4 | +0.1 | |
| Labour | Mark Green | 14,986 | 32.8 | −3.2 | |
| Liberal Democrat | Joanne Crotty | 8,182 | 17.9 | +2.2 | |
| UKIP | Steve Roxborough | 1,325 | 2.9 | +0.9 | |
| Majority | 6,195 | 13.6 | |||
| Turnout | 45,674 | 63.2 | −1.0 | ||
| Conservative hold | Swing | +1.6 | |||
| General Election 2001: Eddisbury | |||||
|---|---|---|---|---|---|
| Party | Candidate | Votes | % | ±% | |
| Conservative | Stephen O'Brien | 20,556 | 46.3 | +3.8 | |
| Labour | George William Eyres | 15,988 | 36.0 | −4.1 | |
| Liberal Democrat | Paul David Roberts | 6,975 | 15.7 | +2.5 | |
| UKIP | David John Edward Carson | 868 | 2.0 | N/A | |
| Majority | 4,568 | 10.3 | |||
| Turnout | 44,387 | 64.2 | −11.5 | ||
| Conservative hold | Swing | ||||
Elections in the 1990s
| Eddisbury by-election, 1999 | |||||
|---|---|---|---|---|---|
| Party | Candidate | Votes | % | ±% | |
| Conservative | Stephen O'Brien | 15,465 | 44.8 | +2.3 | |
| Labour | Mrs. Margaret R. Hanson | 13,859 | 40.2 | +0.1 | |
| Liberal Democrat | Paul D. Roberts | 4,757 | 13.8 | +0.6 | |
| Monster Raving Loony | Alan Hope | 238 | 0.7 | N/A | |
| Independent Conservative | Robert J. Everest | 98 | 0.3 | N/A | |
| Natural Law | Ms. Dinah Grice | 80 | 0.2 | N/A | |
| Majority | 1,606 | 4.7 | |||
| Turnout | 34,497 | 51.4 | −24.4 | ||
| Conservative hold | Swing | ||||
| General Election 1997: Eddisbury | |||||
|---|---|---|---|---|---|
| Party | Candidate | Votes | % | ±% | |
| Conservative | Alastair Goodlad | 21,027 | 42.5 | −8.5 | |
| Labour | Mrs. Margaret R. Hanson | 19,842 | 40.1 | +9.6 | |
| Liberal Democrat | David Reaper | 6,540 | 13.2 | −3.8 | |
| Referendum Party | Mrs. Norine D. Napier | 2,041 | 4.2 | N/A | |
| Majority | 1,185 | 2.4 | |||
| Turnout | 49,450 | 75.8 | |||
| Conservative hold | Swing | −9.1 | |||
| General Election 1992: Eddisbury[8] | |||||
|---|---|---|---|---|---|
| Party | Candidate | Votes | % | ±% | |
| Conservative | Alastair Goodlad | 31,625 | 51.0 | −0.1 | |
| Labour | Ms. Norma M. Edwards | 18,928 | 30.5 | +7.0 | |
| Liberal Democrat | Derrick W. Lyon | 10,543 | 17.0 | −6.6 | |
| Green | Andrew Basden | 783 | 1.3 | −0.4 | |
| Natural Law | Nigel P.J. Pollard | 107 | 0.2 | N/A | |
| Majority | 12,697 | 20.5 | −7.0 | ||
| Turnout | 61,986 | 82.6 | +4.5 | ||
| Conservative hold | Swing | −3.5 | |||
Elections in the 1980s
| General Election 1987: Eddisbury | |||||
|---|---|---|---|---|---|
| Party | Candidate | Votes | % | ±% | |
| Conservative | Alastair Goodlad | 29,474 | 51.1 | −2.4 | |
| Liberal | Roderick Ian Fletcher | 13,639 | 23.7 | −1.8 | |
| Labour | Catriona Grigg | 13,574 | 23.5 | +2.5 | |
| Green | Andrew Basden | 976 | 1.7 | N/A | |
| Majority | 15,835 | 27.5 | |||
| Turnout | 57,663 | 78.0 | |||
| Conservative hold | Swing | −0.3 | |||
| General Election 1983: Eddisbury | |||||
|---|---|---|---|---|---|
| Party | Candidate | Votes | % | ±% | |
| Conservative | Alastair Goodlad | 28,407 | 53.5 | N/A | |
| Liberal | Roderick Ian Fletcher | 13,561 | 25.5 | N/A | |
| Labour | David George Hanson | 11,169 | 21.0 | N/A | |
| Majority | 14,846 | 28.0 | N/A | ||
| Turnout | 53,137 | 74.8 | N/A | ||
| Conservative win (new seat) | |||||
Elections in the 1940s
| General Election 1945: Eddisbury[9]
Electorate 35,224 | |||||
|---|---|---|---|---|---|
| Party | Candidate | Votes | % | ±% | |
| Liberal National | Sir John Denman Barlow | 15,294 | 57.7 | +16.7 | |
| Labour | Warrant Off. John Eric Loverseed | 7,392 | 27.9 | -15.8 | |
| Liberal | Cmdr. Dunstan Michael Carr Curtis | 3,808 | 14.4 | -0.9 | |
| Majority | 7,902 | 29.8 | |||
| Turnout | 26,494 | 75.2 | 32.5 | ||
| Liberal National gain from Common Wealth | Swing | +16.2 | |||
| Eddisbury by-election, 1943[10]
Electorate | |||||
|---|---|---|---|---|---|
| Party | Candidate | Votes | % | ±% | |
| Common Wealth | Warrant Off. John Eric Loverseed | 8,023 | 43.7 | n/a | |
| Liberal National | Thomas Peacock | 7,537 | 41.0 | n/a | |
| Independent Liberal | Harold Heathcote Williams | 2,803 | 15.3 | n/a | |
| Majority | 486 | 2.7 | n/a | ||
| Turnout | 18,363 | 56.1 | n/a | ||
| Common Wealth gain from Liberal National | Swing | n/a | |||
General Election 1939/40: Another general election was required to take place before the end of 1940. The political parties had been making preparations for an election to take place from 1939 and by the end of this year, the following candidates had been selected; Liberal National: Richard John Russell, Liberal: William Gretton Ward.
Elections in the 1930s
| General Election 1935
Electorate 31,901 | |||||
|---|---|---|---|---|---|
| Party | Candidate | Votes | % | ±% | |
| Liberal National | Richard John Russell | unopposed | n/a | n/a | |
| Liberal National hold | Swing | n/a | |||
Elections in the 1920s
| General Election 1929
Electorate 30,592 | |||||
|---|---|---|---|---|---|
| Party | Candidate | Votes | % | ±% | |
| Liberal | Richard John Russell | 13,688 | 51.6 | -1.8 | |
| Unionist | Roderick George Fenwick-Palmer | 12,862 | 48.4 | +1.8 | |
| Majority | 3.2 | 826 | -3.6 | ||
| Turnout | 86.8 | +6.2 | |||
| Liberal hold | Swing | -1.8 | |||
| Eddisbury by-election, 1929
Electorate 23,760 | |||||
|---|---|---|---|---|---|
| Party | Candidate | Votes | % | ±% | |
| Liberal | Richard John Russell | 10,223 | 53.4 | +7.5 | |
| Unionist | Roderick George Fenwick-Palmer | 8,931 | 46.6 | -7.5 | |
| Majority | 1,292 | 6.8 | |||
| Turnout | 80.6 | -6.3 | |||
| Liberal gain from Unionist | Swing | +7.5 | |||
| General Election 1924
Electorate 23,409 | |||||
|---|---|---|---|---|---|
| Party | Candidate | Votes | % | ±% | |
| Unionist | Sir Harry Barnston | 11,006 | 54.1 | ||
| Liberal | Richard John Russell | 9,337 | 45.9 | ||
| Majority | 1,689 | 8.2 | |||
| Turnout | 86.9 | ||||
| Unionist hold | Swing | ||||
Elections in the 1900s
| General Election 1906 Eddisbury[11]
Electorate 10,988 | |||||
|---|---|---|---|---|---|
| Party | Candidate | Votes | % | ±% | |
| Liberal | Hon. Arthur Lyulph Stanley | 5,315 | 55.9 | n/a | |
| Conservative | Edward Thomas Davenant Cotton-Jodrell | 4,192 | 44.1 | n/a | |
| Majority | 1,123 | 11.8 | n/a | ||
| Turnout | 86.5 | n/a | |||
| Liberal gain from Conservative | Swing | n/a | |||
See also
Notes and references
- Notes
- References
Craig, F. W. S. (1983). British parliamentary election results 1918-1949 (3 ed.). Chichester: Parliamentary Research Services. ISBN 0-900178-06-X.
- ↑ "Electorate Figures - Boundary Commission for England". 2011 Electorate Figures. Boundary Commission for England. 4 March 2011. Retrieved 13 March 2011.
- ↑ The districts of Chester, of Crewe and Nantwich (Borough) and of Vale Royal (Borough) were abolished on 1 April 2009 when they became part of the new unitary authorities of Cheshire West and Chester and Cheshire East; however, the boundaries of the parliamentary constituency remain fixed according to the wards in operation at 12 April 2005
- ↑ The Parliamentary Constituencies (England) Order 2007, S.I. 2007/1681
- ↑ 4.0 4.1 Leigh Rayment's Historical List of MPs – Constituencies beginning with "E" (part 1)
- ↑ http://www.northwichguardian.co.uk/news/11768471.print/
- ↑ http://www.myukip.com/parliamentary-candidates-c-e.html
- ↑ Boundary change information . Results from BBC Website
- ↑ "UK General Election results April 1992". Richard Kimber's Political Science Resources. Politics Resources. 9 April 1992. Retrieved 2010-12-06.
- ↑ F W S Craig, British Parliamentary Election Results 1918-1949; Political Reference Publications, Glasgow 1949
- ↑ F W S Craig, British Parliamentary Election Results 1918-1949; Political Reference Publications, Glasgow 1949
- ↑ British parliamentary election results, 1885-1918 (Craig)