Economy of the Philippines
| Economy of the Philippines | |
|---|---|
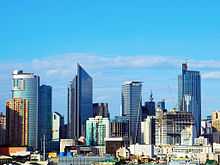
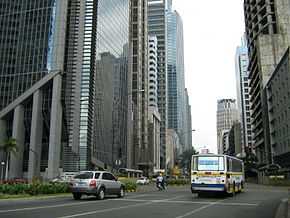 Makati, the financial capital of the Philippines | |
| Currency | Philippine peso (Filipino: piso; sign: ₱; code: PHP) |
| Calendar year | |
Trade organisations | APEC, ASEAN, WTO, EAS, AFTA, ADB, and others |
| Statistics | |
| GDP |
$330.259 billion nominal (2015)[1] $751.770 billion PPP (2015)[1] |
| GDP rank |
|
GDP growth |
|
GDP per capita |
$2,913.344 (2014)[1] (nominal 126th) |
GDP by sector |
11.2% agriculture 31.6% industry 57.2% services (2013 est.)[3] |
|
| |
Population below poverty line | 24.9%[5] |
| 43.0 (2009)[6] | |
Labour force | 59.81 million (2011 est.)[7] |
Labour force by occupation | services: 53%, agriculture: 32%, industry: 15% (2012 est.)[8] |
| Unemployment |
|
Main industries | electronics assembly, Business Process Outsourcing, garments, footwear, pharmaceuticals, chemicals, wood products, food processing, petroleum refining, fishing[7] |
|
| |
| External | |
| Exports | $61.8 billion (2014)[11] |
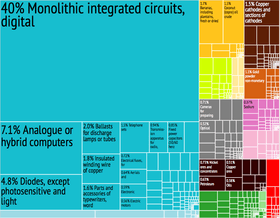
Export goods | semiconductors and electronic products, transport equipment, garments, copper products, petroleum products, coconut oil, fruits[7] |
Main export partners |
|
| Imports | $61.71 billion (2013)[13] |
Import goods | electronic products, mineral fuels, machinery and transport equipment, iron and steel, textile fabrics, grains, chemicals, plastic[7] |
Main import partners |
|
Gross external debt |
|
| Public finances | |
| 39.7 % of GDP (Q3 2013)[16] | |
| Revenues | $34.58 billion (2013) |
| Expenses | $45.60 billion (2013)[17] |
| Economic aid | $1.67 billion[18] |
| |
Foreign reserves |
|
|
All values, unless otherwise stated, are in US dollars. | |
The Economy of the Philippines is the 39th largest in the world, according to 2013 World Bank statistics, and is also one of the emerging markets.[24] The Philippines is considered as a newly industrialized country, which has been transitioning from being one based on agriculture to one based more on services and manufacturing. According to the International Monetary Fund estimates, the 2015 GDP (purchasing power parity) is $751.770 billion.[25] Goldman Sachs estimates that by the year 2050, the Philippines will be the 14th largest economy in the world, Goldman Sachs also included the Philippines in its list of the Next Eleven economies. In 2014, the Philippines was Asia's second-fastest growing economy next only to China.[26] According to HSBC, the Philippine economy will become the 16th largest economy in the world, 5th largest economy in Asia and the largest economy in the Southeast Asian region by 2050.[27]
Primary exports include semiconductors and electronic products, transport equipment, garments, copper products, petroleum products, coconut oil, and fruits. Major trading partners include the United States, Japan, China, Singapore, South Korea, the Netherlands, Hong Kong, Germany, Taiwan, and Thailand. The Philippines has been named as one of the Tiger Cub Economies together with Indonesia, and Thailand. It is currently one of Asia's fastest growing economies. However, major problems remain, mainly having to do with alleviating the wide income and growth disparities between the country's different regions and socioeconomic classes, reducing corruption, and investing in the infrastructure necessary to ensure future growth.
Macroeconomic trends
The Philippine economy has been growing steadily over decades and the International Monetary Fund in 2014 reported it as the 39th largest economy in the world. However its growth has been behind that of many of its Asian neighbors, the so-called Asian Tigers, and it is not a part of the Group of 20 nations. Instead it is open grouped in a second tier of emerging markets or of newly industrialized countries. Depending upon the analyst, this second tier can go by the name the Next Eleven or the Tiger Cub Economies.
In the years 2012 and 2013, the Philippines posted high GDP growth rates, reaching 6.8% in 2012 and 7.2% in 2013,[28][29][30] the highest GDP growth rates in Asia for the first two quarters of 2013, followed by China and Indonesia.[31]
A chart of selected statistics showing trends in the gross domestic product of the Philippines using data taken from the International Monetary Fund.[32][33]
| Year | GDP growth in percent (constant prices, base year = 2000) | GDP in PHP Billion (current prices) | GDP in USD Billion (current prices) | GDP per capita in USD (current prices) | GDP in USD Billion (PPP) | GDP per capita in USD (PPP) | Peso vs Dollar Exchange Rate |
|---|---|---|---|---|---|---|---|
| 1980 | 5.15 | 270.1 | 35.9 | 744 | 64.4 | 1334 | 7.51 |
| 1981 | 3.42 | 312.0 | 39.5 | 797 | 72.9 | 1471 | 7.90 |
| 1982 | 3.62 | 351.4 | 41.1 | 810 | 80.1 | 1578 | 8.54 |
| 1983 | 1.88 | 408.9 | 36.8 | 707 | 84.9 | 1630 | 11.11 |
| 1984 | -7.32 | 581.1 | 34.8 | 652 | 81.6 | 1530 | 16.70 |
| 1985 | -7.31 | 633.6 | 34.1 | 623 | 77.9 | 1426 | 18.61 |
| 1986 | 3.42 | 674.6 | 33.1 | 591 | 82.4 | 1471 | 20.39 |
| 1987 | 4.31 | 756.5 | 36.8 | 641 | 88.4 | 1540 | 20.57 |
| 1988 | 6.75 | 885.5 | 42.0 | 715 | 97.6 | 1663 | 21.09 |
| 1989 | 6.21 | 1025.3 | 47.3 | 786 | 107.6 | 1791 | 21.70 |
| 1990 | 3.04 | 1190.5 | 48.9 | 796 | 115.2 | 1873 | 24.33 |
| 1991 | -0.58 | 1379.9 | 50.2 | 797 | 118.6 | 1882 | 27.48 |
| 1992 | 0.34 | 1497.5 | 58.7 | 912 | 121.8 | 1891 | 25.51 |
| 1993 | 2.12 | 1633.6 | 60.2 | 914 | 127.1 | 1929 | 27.12 |
| 1994 | 4.39 | 1875.7 | 71.0 | 1052 | 135.5 | 2007 | 26.42 |
| 1995 | 4.68 | 2111.7 | 83.7 | 1224 | 144.8 | 2118 | 25.24 |
| 1996 | 5.85 | 2406.4 | 93.5 | 1336 | 156.1 | 2232 | 26.22 |
| 1997 | 5.19 | 2688.7 | 92.8 | 1297 | 167.1 | 2336 | 28.98 |
| 1998 | -0.58 | 2952.8 | 73.8 | 1009 | 168.1 | 2297 | 40.02 |
| 1999 | 3.08 | 3244.2 | 83.0 | 1110 | 175.8 | 2352 | 39.09 |
| 2000 | 4.41 | 3580.7 | 81.0 | 1053 | 187.5 | 2437 | 44.19 |
| 2001 | 2.89 | 3888.8 | 76.3 | 971 | 197.3 | 2511 | 50.99 |
| 2002 | 3.65 | 4198.3 | 81.4 | 1014 | 207.8 | 2591 | 51.60 |
| 2003 | 4.97 | 4548.1 | 83.9 | 1025 | 222.7 | 2720 | 54.20 |
| 2004 | 6.70 | 5120.4 | 91.4 | 1093 | 242.7 | 2905 | 56.04 |
| 2005 | 4.78 | 5677.8 | 103.1 | 1209 | 261.0 | 3061 | 55.09 |
| 2006 | 5.24 | 6271.2 | 122.2 | 1405 | 283.5 | 3255 | 51.31 |
| 2007 | 6.62 | 6892.7 | 149.4 | 1684 | 309.9 | 3493 | 46.15 |
| 2008 | 4.15 | 7720.9 | 173.6 | 1919 | 329.0 | 3636 | 44.47 |
| 2009 | 1.15 | 8026.1 | 168.5 | 1851 | 335.4 | 3685 | 47.64 |
| 2010 | 7.63 | 9003.5 | 199.6 | 2155 | 365.3 | 3945 | 45.11 |
| 2011 | 3.64 | 9706.3 | 224.1 | 2379 | 386.1 | 4098 | 43.31 |
| 2012[34] | 6.82 | 10564.9 | 250.2 | 2611 | 419.6 | 4380 | 42.23 |
| 2013[35] | 7.16 | 11546.1 | 272.2 | 2792 | 454.3 | 4660 | 42.45 |
| 2014[36] | 6.10 |
GDP growth at constant 1985 prices in Philippine pesos:[32][37][38]
| Year | 1970 | 1971 | 1972 | 1973 | 1974 | 1975 | 1976 | 1977 | 1978 | 1979 |
|---|---|---|---|---|---|---|---|---|---|---|
| GDP growth % | 4.6 | 4.9 | 4.8 | 9.2 | 5 | 6.4 | 8 | 5.6 | 5.2 | 5.6 |
| Year | 1980 | 1981 | 1982 | 1983 | 1984 | 1985 | 1986 | 1987 | 1988 | 1989 |
|---|---|---|---|---|---|---|---|---|---|---|
| GDP growth % | 5.149 | 3.423 | 3.619 | 1.875 | -7.324 | -7.307 | 3.417 | 4.312 | 6.753 | 6.205 |
| Year | 1990 | 1991 | 1992 | 1993 | 1994 | 1995 | 1996 | 1997 | 1998 | 1999 |
|---|---|---|---|---|---|---|---|---|---|---|
| GDP growth % | 3.037 | -0.578 | 0.338 | 2.116 | 4.388 | 4.679 | 5.846 | 5.185 | -0.577 | 3.082 |
| Year | 2000 | 2001 | 2002 | 2003 | 2004 | 2005 | 2006 | 2007 | 2008 | 2009 | 2010 | 2011 | 2012 | 2013 | 2014 |
|---|---|---|---|---|---|---|---|---|---|---|---|---|---|---|---|
| GDP growth % | 4.411 | 2.894 | 3.646 | 4.970 | 6.698 | 4.778 | 5.243 | 7.117 | 4.153 | 1.148 | 7.632 | 3.6 | 6.8 | 7.2 | 6.1[36] |
Composition by sector
As a newly industrialized country, the Philippines is still an economy with a large agricultural sector; however, services have come to dominate the economy. Much of the industrial sector is based on processing and assembly operations in the manufacturing of electronics and other high-tech components, usually from foreign multinational corporations.
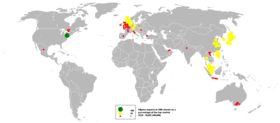
Filipinos who go aboard to work–-known as Overseas Filipino Workers or OFWs—are a significant contributor to the economy but are not reflected in the below sectoral discussion of the domestic economy. OFW remittances is also credited for the Philippines' recent economic growth resulting to investment status upgrades from credit ratings agencies such as the Fitch Group and Standard & Poor's.[39] In 1994, more than $2 billion USD worth of remittance from Overseas Filipinos were sent to the Philippines.[40] In 2012, Filipino Americans sent 43% of all remittances sent to the Philippines, totaling to $10.6 billion USD.[41]
Agriculture

Agriculture employs 32% of the Filipino workforce as of 2013, according to World Bank statistics.[42] Agriculture accounts for 12% of Philippines GDP as of 2013, according to the World Bank.[43] The type of activity ranges from small subsistence farming and fishing to large commercial ventures with significant export focus.
The Philippines is the world's largest producer of coconuts producing 19,500,000 tons in 2009. Coconut production in the Philippines is generally concentrated in medium-sized farms.[44] By 1995, the production of coconut in the Philippines had experienced a 6.5% annual growth and later surpassed Indonesia in total output in the world.[45] The Philippines is also the world's largest producer of pineapples, producing 2,198 thousand metric tons in 2009.[46]
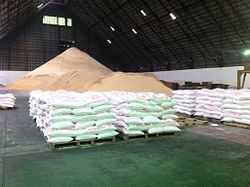
Rice production in the Philippines is important to the food supply in the country and economy. The country is the 8th largest rice producer in the world, accounting for 2.8% of global rice production.[47] The Philippines was also the world's largest rice importer in 2010.[48] Rice is the most important food crop, a staple food in most of the country. It is produced extensively in Luzon, the Western Visayas, Southern Mindanao, and Central Mindanao.
The Philippines is one of the largest producers of sugar in the world according to Food and Agriculture Organization of the United Nations Statistics Division.[49] At least 17 provinces located in 8 regions of the country have grown sugarcane crops, of which Negros island accounts for half of the country’s total production. As of Crop Year 2012-2013, 29 mills are operational divided as follows: 6 mills in Luzon, 13 mills in Negros, 4 mills in Panay, 3 mills in Eastern Visayas and 3 mills in Mindanao.[50] A range from 360,000 to 390,000 hectares are devoted to sugarcane production. The largest sugarcane areas are found in Negros which accounts for 51% of sugarcane areas planted. This is followed by Mindanao which accounts for 20%; Luzon, 17%; Panay islands, 7% and Eastern Visayas, 4%.[51]
Shipbuilding and repair
The Philippines is a major player in the global shipbuilding industry with shipyards in Subic, Cebu, General Santos City and Batangas.[52][53] It became the fourth largest shipbuilding nation in 2010.[54][55] Subic-made cargo vessels are now exported to countries where shipping operators are based. South Korea's Hanjin started production in Subic in 2007 of the 20 ships ordered by German and Greek shipping operators.[56] The country’s shipyards are now building ships like bulk carriers, container ships and big passenger ferries. General Santos' shipyard is mainly for ship repair and maintenance.[57]
Being surrounded by waters, the country has abundant natural deep-sea ports ideal for development as production, construction and repair sites. On top of the current operating shipyards, two additional shipyards in Misamis Oriental and Cagayan province are being expanded to support future locators. It has a vast manpower pool of 60,000 certified welders that comprise the bulk of workers in shipbuilding.
In the ship repair sector, the Navotas complex in Metro Manila is expected to accommodate 96 vessels for repair.[58]
Automotive
The ABS used in Mercedes-Benz, BMW, and Volvo cars are made in the Philippines. Ford,[59] Toyota,[60] Mitsubishi, Nissan and Honda are the most prominent automakers manufacturing cars in the country. Kia and Suzuki produce small cars in the country. Isuzu also produces SUVs in the country. Honda and Suzuki produce motorcycles in the country. A 2003 Canadian market research report predicted that further investments in this sector were expected to grow in the following years. Toyota sells the most vehicles in the country.[61] By 2011, China's Chery Automobile company is going to build their assembly plant in Laguna, that will serve and export cars to other countries in the region if monthly sales would reach 1,000 units.[62] Automotive sales in the Philippines moved up from 165,056 units in 2011 to over 180,000 in 2012. Japan’s automotive manufacturing giant Mitsubishi Motors has announced that it will be expanding its operations in the Philippines.[63]
Aerospace
Aerospace products in the Philippines are mainly for the export market and include manufacturing parts for aircraft built by both Boeing and Airbus. Moog is the biggest aerospace manufacturer with base in Baguio in the Cordillera region. The company produces aircraft actuators in their manufacturing facility.
In 2011, the total export output of aerospace products in the Philippines reached US $3 billion.[64]
Electronics
A Texas Instruments plant in Baguio has been operating for 20 years and is the largest producer of DSP chips in the world.[65] Texas Instruments' Baguio plant produces all the chips used in Nokia cell phones and 80% of chips used in Ericsson cell phones in the world.[66] Until 2005, Toshiba laptops were produced in Santa Rosa, Laguna. Presently the Philippine plant's focus is in the production of hard disk drives. Printer manufacturer Lexmark has a factory in Mactan in the Cebu region. Electronics and other light industries are concentrated in Laguna, Cavite, Batangas and other CALABARZON provinces with sizable numbers found in Southern Philippines that account for most of the country's export
Mining and extraction
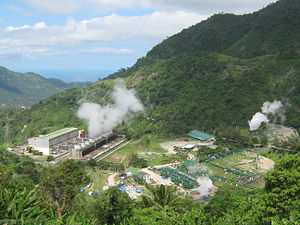
The country is rich with mineral and geothermal energy resources. In 2003, it produced 1931 MW of electricity from geothermal sources (27% of total electricity production), second only to the United States,[67] and a recent discovery of natural gas reserves in the Malampaya oil fields off the island of Palawan is already being used to generate electricity in three gas-powered plants. Philippine gold, nickel, copper and chromite deposits are among the largest in the world. Other important minerals include silver, coal, gypsum, and sulphur. Significant deposits of clay, limestone, marble, silica, and phosphate exist.
About 60% of total mining production are accounted for by non-metallic minerals, which contributed substantially to the industry's steady output growth between 1993 and 1998, with the value of production growing 58%. In 1999, however, mineral production declined 16% to $793 million. Mineral exports have generally slowed since 1996. Led by copper cathodes, Philippine mineral exports amounted to $650 million in 2000, barely up from 1999 levels. Low metal prices, high production costs, lack of investment in infrastructure, and a challenge to the new mining law have contributed to the mining industry's overall decline.
The industry rebounded starting in late 2004 when the Supreme Court upheld the constitutionality of an important law permitting foreign ownership of Philippines mining companies. However, the DENR has yet to approve the revised Department Administrative Order (DAO) that will provide the Implementing Rules and Regulations of the Financial and Technical Assistance Agreement (FTAA), the specific part of the 1994 Mining Act that allows 100% foreign ownership of Philippines mines.
Offshoring & outsourcing
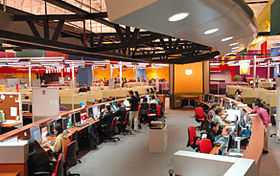
In 2008, the Philippines has surpassed India as the world leader in business process outsourcing.[68][69] The majority of the top ten BPO firms of the United States operate in the Philippines. Total jobs in the industry grew to 100,000 and total revenues were placed at $960 million for 2005. In 2012, BPO sector employment ballooned to over 700,000 people and is contributing to a growing middle class. BPO facilities are located mainly in Metro Manila and Cebu City although other regional areas such as Baguio, Bacolod, Cagayan de Oro, Clark Freeport Zone, Dagupan, Davao City, Legazpi, Dumaguete, Lipa, Iloilo City, and CamSur are now being promoted and developed for BPO operations.
Call centers began in the Philippines as plain providers of email response and managing services and is now a major source of employment. Call center services include customer relations, ranging from travel services, technical support, education, customer care, financial services, online business to customer support, and online business to business support. Business process outsourcing (BPO) is regarded as one of the fastest growing industries in the world. The Philippines is also considered as location of choice due to its many outsourcing benefits such as less expensive operational and labor costs and high proficiency in spoken English and highly educated labor pool. In 2011, the business process outsourcing industry in the Philippines generated 700 thousand jobs[70] and some US$11 billion in revenue,[71] 24 percent higher than 2010. By 2016, the industry is projected to reach US$27.4 billion in revenue with employment generation to almost double at 1.3 million workers.[72]
BPOs and the call center industry in general is also credited for the Philippines' recent economic growth resulting to investment status upgrades from credit ratings agencies such as Fitch and S&P.[39]
Regional Accounts
Gross Regional Domestic Product (GRDP) is GDP measured at regional levels. Figures below are for the year 2013:
| Region | GRDP (in billion PHP) | % of GRDP | Agriculture (in billion PHP) | % of GRDP | Industry (in billion PHP) | % of GRDP | Services (in billion PHP) | % of GRDP | per capita GRDP |
|---|---|---|---|---|---|---|---|---|---|
| Metro Manila | 3,479.905 | 35.744 | 17.891 | 0.51 | 591.035 | 16.98 | 2,870.979 | 82.50 | 288,062 |
| Cordillera | 210.079 | 2.158 | 21.082 | 10.04 | 116.522 | 55.47 | 72.474 | 34.50 | 127,614 |
| Ilocos | 293.918 | 3.019 | 75.097 | 25.55 | 79.448 | 27.03 | 139.372 | 47.42 | 71,076 |
| Cagayan Valley | 167.492 | 1.72 | 71.769 | 42.85 | 17.805 | 10.63 | 77.919 | 46.52 | 51,100 |
| Central Luzon | 882.806 | 9.068 | 145.975 | 16.54 | 373.250 | 42.28 | 363.580 | 41.18 | 85,186 |
| CALABARZON | 1,644.843 | 16.895 | 108.940 | 6.62 | 1,015.501 | 61.74 | 520.401 | 31.64 | 126,589 |
| MIMAROPA | 176.176 | 1.81 | 48.028 | 27.26 | 65.135 | 36.97 | 63.013 | 35.77 | 62,995 |
| Bicol | 206.619 | 2.122 | 57.728 | 27.94 | 44.855 | 21.71 | 104.036 | 50.35 | 37,526 |
| Western Visayas | 395.417 | 4.062 | 115.613 | 29.24 | 66.238 | 16.75 | 213.565 | 54.01 | 54,870 |
| Central Visayas | 601.880 | 6.182 | 51.890 | 8.62 | 213.968 | 35.55 | 336.023 | 55.83 | 86,880 |
| Eastern Visayas | 242.594 | 2.492 | 58.434 | 24.09 | 104.207 | 42.96 | 79.952 | 32.96 | 58,335 |
| Zamboanga Peninsula | 200.883 | 2.063 | 66.206 | 32.96 | 51.762 | 25.77 | 82.915 | 41.28 | 57,815 |
| Northern Mindanao | 467.100 | 4.798 | 115.283 | 31.40 | 102.251 | 27.85 | 149.566 | 40.74 | 93,628 |
| Davao Region | 408.450 | 4.195 | 104.792 | 25.66 | 112.821 | 27.62 | 190.837 | 46.72 | 89,552 |
| SOCCSKSARGEN | 261.548 | 2.687 | 97.932 | 37.44 | 71.445 | 27.32 | 97.171 | 35.24 | 62,080 |
| Caraga | 99.037 | 1.017 | 30.248 | 27.56 | 26.583 | 24.22 | 52.934 | 48.22 | 44,472 |
| Muslim Mindanao | 86.048 | 0.884 | 58.287 | 67.74 | 3.641 | 4.23 | 24.120 | 28.03 | 26,004 |
| Total | 9,735.521 | 100 | 1,245.196 | 12.79 | 3,056.468 | 31.40 | 5,433.857 | 55.81 | 103,366 |
Note: Green-colored cells indicate higher value or best performance in index, while yellow-colored cells indicate the opposite.
Economic indicators and international rankings
Statistics
| Economic growth[97][98][99] | ||
|---|---|---|
| Year | % GDP | % GNI |
| 1999 | 3.1 | 2.7 |
| 2000 | 4.4 | 7.7 |
| 2001 | 2.9 | 3.6 |
| 2002 | 3.6 | 4.1 |
| 2003 | 5.0 | 8.5 |
| 2004 | 6.7 | 7.1 |
| 2005 | 4.8 | 7.0 |
| 2006 | 5.2 | 5.0 |
| 2007 | 7.1 | 6.2 |
| 2008 | 4.2 | 5.0 |
| 2009 | 1.1 | 6.1 |
| 2010 | 7.6 | 8.2 |
| 2011 | 3.7 | 2.6 |
| 2012[36] | 6.8 | 6.5 |
| 2013[36] | 7.2 | 7.5 |
| 2014[36] | 6.1 | |
| * Computed at Constant 2000 Prices | ||
| ** Source: NEDA and NSCB | ||
Most of the following statistics are sourced from the International Monetary Fund - Philippines (as of 2012; figures are in US dollars unless otherwise indicated).
- GDP - purchasing power parity: $ 751.770 billion (2015)
- GDP - real growth rate: 6.1% (2014)
- GDP per capita purchasing power parity: $6,985.680 (2014)
- GDP nominal: $330.259 billion (2015)
- GDP per capita: $2,913.344 (2014)[100]
- GDP - composition by sector:
- agriculture: 11.2%
- industry: 31.6%
- services: 57.2% (2013 est.)[7]
- Population below poverty line: less than $1.25 / 10.41% (2009)
less than $2 / 25.2% (2012),[101] 26.3% (2009),[101] 32.9% (2006 est.)[7] - Household income or consumption by percentage share:
- lowest 10%: 2.4%
- highest 10%: 31.2% (2006)[7]
- Inflation rate (consumer prices): 2.4% (March 2015) 3.9% (March 2014),[101] 5.3% (2011 est.),[7] 3.5% (September 2010)[102]
- Labor force: 59.81 million (2011 est.)[7]
- Labor force by occupation:
- agriculture 32%
- industry 15%
- services 53% (2012 est.)[7]
- Unemployment rate:6.0% (January 2015) 7.5% (January 2014),[101][103] 7.5% (April 2013),[103] 6.9% (April 2012),[103] 7.2% (April 2011)[104]
- Budget:
- Foreign Reserves: US$85.761 billion (January 2013)[106]
- Industries: electronics assembly, garments, footwear, pharmaceuticals, chemicals, wood products, food processing, petroleum refining, fishing
- Industrial production growth rate: 12.1% (2010 est.)[7]
- Electricity - production: 59.19 billion kWh (2009 est.)[7]
- Electricity - consumption: 54.4 billion kWh (2009 est.)[7]
- Electricity - exports: 0 kWh (2007)[7]
- Electricity - imports: 0 kWh (2007)[7]
- Agriculture - products: sugarcane, coconuts, rice, corn, bananas, cassavas, pineapples, mangoes; pork, eggs, beef; fish[7]
- Exports: $53.98 billion (2013)[107]$54.17 billion (2011 est.); $69.46 billion (2010 est.)[7][108]
- Exports - commodities: semiconductors and electronic products, transport equipment, garments, copper products, petroleum products, coconut oil, fruits[7]
- Exports - partners: China 19%, United States 13.4%, Singapore 13.2%, Japan 12.8%, Hong Kong 7.6%, Germany 4.2%, South Korea 4.1% (2010)[7]
- Imports: $61.831 billion (2013),[107] $68.84 billion (2011 est.)[7]
- Imports - commodities: electronic products, mineral fuels, machinery and transport equipment, iron and steel, textile fabrics, grains, chemicals, plastic[7]
- Imports - partners: Japan 14.1%, China 13.6%, United States 9.9%, Singapore 9.3%, Thailand 6.5%, South Korea 5.6%, Indonesia 4.1% (2010)[7]
- Debt - external: $62.41 billion (31 December 2011 est.)[7]
- Currency: 1 Philippine peso (₱) = 100 centavos
- Exchange rates: Philippine pesos (PHP) per US dollar - 44.39 (2014 average),[109] 42.43 (2012 average),[109] 43.44 (2011), 45.11 (2010), 47.68 (2009), 44.439 (2008), 46.148 (2007), 51.246 (2006),[7] 55.086 (2005)
Government budget
The national government budget for 2012 has set the following budget allocations:[110] Noticeably enough, the Department of Science & Technology[111] is not reflected in the chart below which underlines the Philippine government's need to invest more on education, particularly in the sciences and engineering fields to solidify its current growth momentum.[39]
| Budget Allocation | Millions of Pesos (PHP) | Millions of US Dollars (USD) | % |
|---|---|---|---|
| Department of Education | ₱238,800 | $5,513.7 | 13.15 |
| Department of Public Works and Highways | 126,400 | 2,918.5 | 6.96 |
| Department of National Defense | 108,100 | 2,496.0 | 5.95 |
| Department of Interior and Local Government | 99,800 | 2,304.3 | 5.50 |
| Department of Agriculture | 61,400 | 1,417.7 | 3.38 |
| Department of Social Welfare and Development | 48,800 | 1,126.8 | 2.69 |
| Department of Health | 45,800 | 1,057.5 | 2.52 |
| Department of Transportation and Communications | 34,700 | 801.2 | 1.91 |
| State Universities and Colleges | 25,800 | 595.7 | 1.42 |
| Department of Finance | 23,600 | 544.9 | 1.30 |
| Department of Environment and Natural Resources | 17,500 | 404.1 | 0.96 |
See also
- List of companies of the Philippines
- Next Eleven
- Tiger Cub Economies
- Newly Industrialized countries
- Economy of Asia
- Emerging markets
- Bamboo network
References
- ↑ 1.0 1.1 1.2 1.3 "Report for Selected Countries and Subjects". Retrieved 3 March 2015.
- ↑ Market Watch (2015-01-29). "Philippines GDP grows faster than expected in Q4". Retrieved 2015-01-29.
- ↑ "Philippines GDP - composition by sector". Retrieved 3 March 2015.
- ↑ "Philippine inflation rate eases to 2.4 percent in January". Philippine Star. February 5, 2015. Retrieved February 5, 2015.
- ↑ Torres, Ted (July 5, 2014). "Poverty incidence eases to 24.9%". The Philippine Star. Retrieved March 1, 2015.
- ↑ "GINI index (World Bank estimate)". Retrieved 3 March 2015.
- ↑ 7.0 7.1 7.2 7.3 7.4 7.5 7.6 7.7 7.8 7.9 7.10 7.11 7.12 7.13 7.14 7.15 7.16 7.17 7.18 7.19 7.20 7.21 7.22 7.23 7.24 7.25 CIA World Factbook, Philippines, Retrieved May 15, 2009.
- ↑ "The World Factbook". Retrieved 3 March 2015.
- ↑ "Labor and Employment". Retrieved 3 March 2015.
- ↑ Torres, Ted (October 30, 2014). "Doing business: Phl moves up in ranking". The Philippine Star. Retrieved December 7, 2014.
- ↑ "Exports growth slowed to 3.6% in 2013".
- ↑ "Export Partners of Philippines". CIA World Factbook. 2012. Retrieved 2013-07-23.
- ↑ "Imports eased to $61.7B in 2013 on electronics slump". inquirer.net. 2013. Retrieved 2014-02-26.
- ↑ "Import Partners of Philippines". CIA World Factbook. 2012. Retrieved 2013-07-23.
- ↑ "PH external debt dipped last year". inquirer.net. 1986-07-28. Retrieved 2014-03-22.
- ↑ "PHL debt-to-GDP ratio declines in third quarter 2013". www.gmanetwork.com. 2014-03-05. Retrieved 2014-04-10.
- ↑ "Aquino signs P2-T 2013 budget". Rappler.com. Retrieved 2012-12-19.
- ↑ "NEDA: Foreign aid releases slightly increased in 2011 | Inquirer Business". Business.inquirer.net. 2012-03-05. Retrieved 2012-10-12.
- ↑ "Sovereigns rating list". Standard & Poor's. Retrieved 8 May 2014.
- ↑ "Philippines secures 2nd investment grade rating from S&P". Philippine Star Business. 2013-10-09.
- ↑ "Rating Action: Moody's upgrades Philippines to Baa2, outlook stable". Moody's Investors Service. 2014-12-11. Retrieved 2014-12-12.
- ↑ "Philippines Wins First Investment Grade Rating From Fitch". CNBC. Reuters. 27 March 2013. Retrieved 27 March 2013.
- ↑ "Forex reserves hit record high at $86-B in January". www.abs-cbnnews.com. 2013-02-07. Retrieved 2013-02-07.
- ↑ "World Economic Outlook Database". Retrieved 3 March 2015.
- ↑
- ↑ Dancel, Raul (29 January 2015). "The Philippines is Asia's second-fastest growing economy in 2014 after China". http://www.thejakartapost.com/''. The Associated Press, Manila, Philippines. Retrieved 2015-03-30.
- ↑ "World’s top economies in 2050 will be...". CNN. 2012-01-12. Retrieved 2012-01-13.
- ↑ "Philippine Economy Grew by 7.2 percent in 2013". National Statistical Coordination Board. Retrieved March 12, 2014.
- ↑ "Philippine economy grows a stunning 7.8%". Asia News Network. Retrieved June 6, 2013.
- ↑ "2012 PH GDP growth revised to 6.8 pct". ABS-CBN News. Retrieved June 10, 2013.
- ↑ "Philippines is fastest growing Asian country for first quarter of 2013". Inquirer News. Retrieved June 10, 2013.
- ↑ 32.0 32.1 International Monetary Fund. (April 2012). World Economic Outlook Data, By Country – Philippines: [selected annual data for 1980–2017]. Retrieved 2012-06-23 from the World Economic Outlook Database.
- ↑ International Monetary Fund. (April 2010). "World Economic Outlook (WEO) Database April 2010 – Report for Selected Countries and Subjects – Philippines and United States".
- ↑ "Report for Selected Countries and Subjects". Imf.org. 2013-04-16. Retrieved 2013-04-19.
- ↑ "Report for Selected Countries and Subjects". Retrieved 3 March 2015.
- ↑ 36.0 36.1 36.2 36.3 36.4 Philippine Statistics Authority - National Statistical Coordination Board, Retrieved April 23, 2014.
- ↑ International Monetary Fund. (October 2010). The Philippine Stock Exchange, It is one of the oldest stock exchanges in Southeast Asia, having been in continuous operation since its inception in 1927. It currently maintains two trading floors, one at the Ayala Tower One in the Makati Central Business District, and one at its headquarters in Pasig City. The PSE is composed of a 15-man Board of Directors, chaired by Jose T. Pardo. World Economic Outlook Data, By Country – Philippines: [selected annual data for 1980–2015]. Retrieved 2011-01-31 from the World Economic Outlook Database.
- ↑ International Monetary Fund. (April 2002). "The World Economic Outlook (WEO) Database April 2002 – Real Gross Domestic Product (annual percent change) – All countries".
- ↑ 39.0 39.1 39.2 King del Rosario. "MBA Buzz: More Funds in the Philippines". Retrieved 2013-06-11.
- ↑ Kevin Starr (22 June 2011). Coast of Dreams. Knopf Doubleday Publishing Group. p. 159. ISBN 978-0-307-79526-7.
- ↑ Drew Desilver (13 November 2013). "More than 3.4M Americans trace their ancestry to the Philippines". Fact Tank. Pew Research Center. Retrieved 19 December 2014.
- ↑ "Employment in agriculture (% of total employment)". Retrieved 3 March 2015.
- ↑ "Agriculture, value added (% of GDP)". Retrieved 3 March 2015.
- ↑ Hayami, Yūjirō; Quisumbing, Maria Agnes R.; Adriano, Lourdes S. (1990). Toward an alternative land reform paradigm: a Philippine perspective. Ateneo de Manila University Press. p. 108. ISBN 978-971-11-3096-1. Retrieved 15 November 2011.
- ↑ Leonard, Edward C.; Perkins, Edward George; Cahn, Arno (February 1999). Proceedings of the World Conference on Palm and Coconut Oils for the 21st Century: sources, processing, applications, and competition. The American Oil Chemists Society. p. 21. ISBN 978-0-935315-99-8. Retrieved 15 November 2011.
- ↑ fao.org. "Agriculture Statistics > Pineapples > Pineapple production (2009) by country". Retrieved 7 Nov 2011.
- ↑ Faostat
- ↑ "Factbox - Top 10 rice exporting, importing countries". Reuters. 28 January 2011. Retrieved 30 March 2011.
- ↑ "ESS Website ESS : Statistics home". Retrieved 3 March 2015.
- ↑ "Historical Statistics". Retrieved 3 March 2015.
- ↑ Master Plan For the Philippine Sugar Industry. Sugar Master Plan Foundation, Inc. 2010. p. 7.
- ↑ "Philippines Shipbuilding Hub In Asia-Pacific". Yahoo News Philippines. 4 December 2012. Retrieved 3 March 2015.
- ↑ "Business - Cebu shipbuilder to deliver PHs largest vessel - INQUIRER.net". Retrieved 3 March 2015.
- ↑ http://www.crossworldmarine.com/index.php?option=com_content&view=article&id=85:philippines-one-of-the-worlds-leaders-in-shipbuilding&catid=6:press-releases&Itemid=26
- ↑ John Pike. "Philippine Shipbuilding Industry". Retrieved 3 March 2015.
- ↑ "New era as shipbuilding production begins in the Philippines". Retrieved 3 March 2015.
- ↑ William Poole. "Big ambitions for Philippines shipbuilding". Retrieved 3 March 2015.
- ↑ http://www.businessmirror.com.ph/index.php/news/top-news/3760-filipino-firm-invests-p259m-for-shipyard-in-navotas
- ↑ "Ford Philippines - The Ford Philippines Assembly Plant". Retrieved 3 March 2015.
- ↑ Toyota defends assembly of small cars in the Philippines | The Manila Bulletin Newspaper Online
- ↑ Oslowski, Justin. (March 25, 2003). "Automotive Production in the Philippines". Industry Canada. Archived from the original on 2007-12-08. Retrieved 2007-12-11.
- ↑ http://newsinfo.inquirer.net/10788/laguna-car-plant-seen-to-boost-chery%E2%80%99s-sales Laguna car plant seen to boost Chery’s sales
- ↑ "Mitsubishi expands in the Philippines". Investvine.com. 2013-02-21. Retrieved 2013-02-21.
- ↑ http://ph.news.yahoo.com/relocating-firms-double-exports-aerospace-components-6b-093830140--finance.html Relocating Firms To Double Exports Of Aerospace Components To $6B
- ↑ "The positive outlook to the Philippines". philnews.com. Retrieved 2007-12-11
- ↑ "Texas Instruments in Baguio retrenches 392 employees - Equipment\cn-c114 ĄŞ C114 - China Communication Network". Cn-c114.net. Retrieved 2012-10-12.
- ↑ Tester, JK; Anderson, Bj; Batchelor, As; Blackwell, Dd; DiPippo, R; Drake, Em; Garnish, J; Livesay, B; Moore, Mc; Nichols, K; Petty, S; Toksoz, Mn; Veatch, Rw; Baria, R; Augustine, C; Murphy, E; Negraru, P; Richards, M (Apr 2007). "Geothermal Energy Systems". Philosophical Transactions of the Royal Society A (ResLab, Australia) 365 (1853): 1057–94. doi:10.1098/rsta.2006.1964. PMID 17272236. Archived from the original on 2005-03-09. Retrieved 2007-12-11 (from internet archive)
- ↑ IBM Global Business Services. (October 2008). Global Location Trends – 2008 Annual Report.
- ↑ Balana, Cynthia D. and Lawrence de Guzman. (December 5, 2008). It's official: Philippines bests India as No. 1 in BPO. The Philippine Daily Inquirer.
- ↑ http://www.abs-cbnnews.com/business/03/21/12/bpo-industry-generate-100000-jobs-year-wb BPO industry to generate 100,000 jobs
- ↑ "IT-BPO revenue reached $11B in 2011". Retrieved 3 March 2015.
- ↑ IT-BPO Sector Sees $27.4-B Revenues by 2016 | PINOY OFW
- ↑ List of countries by GDP (PPP)
- ↑ List of countries by GDP (nominal)
- ↑ List of countries by GDP (PPP) per capita
- ↑ List of countries by GDP (nominal) per capita
- ↑ List of countries by foreign-exchange reserves
- ↑ List of countries by population
- ↑ Area List of countries and outlying territories by total area
- ↑ Population Density List of sovereign states and dependent territories by population density
- ↑ "Global Health Observatory Data Repository". Retrieved 3 March 2015.
- ↑ Literacy Rate List of countries by literacy rate
- ↑ Population Density List of countries by external debt
- ↑ "UNWTO Tourism Highlights - 2012 Edition" (PDF). Retrieved 2012-10-12.
- ↑ Human Development Index 2014 List of countries by Human Development Index
- ↑ "The Global Competitiveness Report 2014 - 2015". The Global Competitiveness Report 2014 - 2015 - World Economic Forum. Retrieved 3 March 2015.
- ↑ "Phl now 56th in world economic freedom rankings". Thechroniclevarsitarian.wordpress.com. Retrieved 2013-09-22.
- ↑ "Land of power women: PHL rises to 5th in global gender survey, highest in Asia". GMA News Online. Retrieved 3 March 2015.
- ↑ "The Travel & Tourism Competitiveness Index 2013 and 2011 comparison" (PDF). weforum.org. Retrieved 2013-10-04.
- ↑ "Phl moves up in WEF Enabling Trade Index". philstar.com. Retrieved 3 March 2015.
- ↑ "Ease of Doing Business Report". Doingbusiness.org. Retrieved 2013.
- ↑ "Corruption Perceptions Index". ManilaTimes. Retrieved 2013-12-03.
- ↑ http://www.abs-cbnnews.com/business/05/07/14/ph-improves-economic-freedom-ranking
- ↑ Global Peace Index
- ↑ "World Press Freedom Index 2013". Reporters Without Borders. Retrieved 2013-10-04.
- ↑ "The Financial Development Index 2012 rankings: Comparison with 2011" (PDF). World Economic Forum. Retrieved 2014-09-15.
- ↑ National Economic and Development Authority (NEDA), Republic of the Philippines. (January 31, 2011). Annual GDP Sizzled to its Highest Growth Rate in the Post Marcos Era at 7.3 Percent; Q4 2010 GDP grew by 7.1 percent
- ↑ National Economic and Development Authority (NEDA), Republic of the Philippines. "National Income Accounts (NIA) – GNP/GDP Matrices". Retrieved September 2010.
- ↑ Agcaoili, Lawrence. (November 26, 2010). GDP growth slows to 6.5% in 3rd quarter. The Philippine Star.
- ↑ , International Monetary Fund.
- ↑ 101.0 101.1 101.2 101.3 Philippine Statistics Authority - National Statistical Coordination Board, Retrieved April 23, 2014.
- ↑ National Statistics Office, Republic of the Philippines. (2010-10-05). "Consumer Price Index September 2010". Retrieved 2010-09-30.
- ↑ 103.0 103.1 103.2 Philippine Statistics Authority - National Statistical Coordination Board, Retrieved April 23, 2014.
- ↑ "April 2011 Labor Force Survey (LFS)". Census.gov.ph. Retrieved 2011-09-04.
- ↑ 105.0 105.1 Philippine Statistics Authority - National Statistical Coordination Board, Retrieved April 23, 2014.
- ↑ "End-September forex reserves climb to $81.9-B". InterAksyon.com. 2012-10-05. Retrieved 2012-10-12.
- ↑ 107.0 107.1 Philippine Statistics Authority - National Statistical Coordination Board, Retrieved April 23, 2014.
- ↑ Ho, Abigail. (December 28, 2010). DTI says export earnings to hit $100B by '16. The Philippine Daily Inquirer. Retrieved December 28, 2010.
- ↑ 109.0 109.1 Philippine Statistics Authority - National Statistical Coordination Board, Retrieved April 23, 2014.
- ↑ "President Aquino submits P2.006-T 2013 Empowerment Budget to Congress". Retrieved 2012-08-31..
- ↑ "Official Website of the Department of Science and Technology, Republic of the Philippines". Retrieved 2013-06-11.
Further reading
- Balisacan, Arsenio; Hal Hill (2003). The Philippine Economy: Development, Policies, and Challenges. New York: Oxford University Press. p. 496. ISBN 978-0-19-515898-4
- Balisacan, Arsenio; Hal Hill (2007). "The Dynamics of Regional Development: The Philippines in East Asia" (PDF). Cheltenham, UK: Edward Elgar
- Bhagwati, Jagdish and Anne Krueger. (1974). Foreign Trade Regimes and Economic Development. National Bureau of Economic Research.
- Kang, David C. (2002). Crony Capitalism – Corruption and Development in South Korea and the Philippines. Cambridge University Press. ISBN 978-0-521-00408-4.
- Villegas, Bernardo. (2010). The Philippine Advantage (3rd ed.). Manila: University of Asia and the Pacific.
- State of the Philippine Islands A book written by a Spaniard during the early 19th century that studies the economic conditions of the Philippines which was then, a colony of Spain. An online book published by Filipiniana.net.
- Philippines - Asia's new tiger economy
- Philippines' opportunity point
External links
| Wikimedia Commons has media related to Economy of the Philippines. |
- Bangko Sentral ng Pilipinas (Central Bank of the Philippines)
- National Statistical Coordination Board
- Department of Trade and Industry
- Department of Finance
- Philippine Stock Exchange
- National Federation of Sugarcane Planters
- Department of Tourism
- Philippines Business Brokers
- Philippine Economic Zone Authority
- Philippines 8th Regular Foreign Investment Negative List
- Trade
- World Bank Summary Trade Statistics Philippines 2012
- Tariffs applied by the Philippines as provided by ITC's Market Access Map, an online database of customs tariffs and market requirements.
| ||||||||||||||||||||||||||||||||

| |||||||||||||||||||||||||||||||||||||||||||||