Economy of the Netherlands
| Economy of Netherlands | |
|---|---|
 | |
| Currency | Euro |
| calendar year | |
Trade organisations | EU, WTO and OECD |
| Statistics | |
| GDP |
$800 billion (nominal, 2013)[1] $729 billion (PPP, 2013)[2] |
| GDP rank | 19th (nominal) / 27th (PPP) |
GDP growth |
|
GDP per capita |
$52,249 (nominal, 2014) $46,440 (PPP, 2013) |
GDP by sector | agriculture: 2.8%; industry: 24.1%; services: 73.2% (2012 est.) |
|
| |
Population below poverty line | 9.1% (2013 est.) |
| 30.9 (2007) | |
Labour force | 7.746 million (2012 est.) |
Labour force by occupation | agriculture: 2%; industry: 18%; services: 80% (2005 est.) |
| Unemployment |
|
Average gross salary | 3,728 € / 5,035 $, monthly (2006)[5] |
Average net salary | 1,980 € / 2,673 $, monthly (2006)[5] |
Main industries | agriculture-related industries, metal and engineering products, electronic machinery and equipment, chemicals, petroleum, construction, microelectronics, fishing |
| 31st[6] | |
| External | |
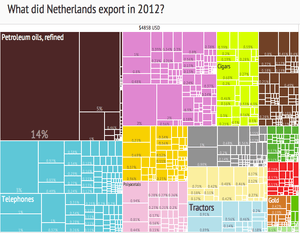
| Exports |
|
Export goods | machinery and equipment, chemicals, fuels; foodstuffs |
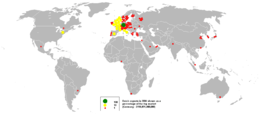
Main export partners |
|
| Imports |
|
Import goods | machinery and transport equipment, chemicals, fuels, foodstuffs, clothing |
Main import partners |
|
FDI stock |
|
Gross external debt |
|
| Public finances | |
|
| |
| Revenues | $347.4 billion |
| Expenses | $386.6 billion (2012 est.) |
| Economic aid | € 4 bn (As of 2005) |
| |
Foreign reserves |
|
| Life in the Netherlands |
|---|
 |
|
Government |

According to the World Bank and the International Monetary Fund, the Netherlands was the 18th largest economy of the world in 2012 (see: List of countries by GDP (nominal)). GDP per capita is roughly $43,404 which makes it one of richest nations in the world (see: List of countries by GDP (PPP) per capita). Between 1996 and 2000 annual economic growth (GDP) averaged over 4%, well above the European average. Growth slowed considerably in 2001-05 as part of the global economic slowdown. 2006 and 2007 however showed economic growth of 3.4% and 3.9%. The Dutch economy was hit considerably by the ongoing global financial crisis and the ensuing European debt crisis. Several banks went bankrupt, and a number of others had to receive governmental aid. In 2009 the economy declined 3.5%, followed by two years of mild growth. The Dutch economy is in a recession again, with an economic decline of 0.5% in 2012. Inflation is at 2.9% in June 2013. Unemployment has been relatively low compared to other EU nations for decades but after mid-2012 it has seen a fast increase and in May 2013 it has hit 8.3%. The Netherlands managed to maintain its AAA rating at least until July 2013 according to the three major credit rating agencies.[10]
The Netherlands have a prosperous and open economy, which depends heavily on foreign trade. The economy is noted for stable industrial relations, fairly low unemployment and inflation, a sizable current account surplus, and an important role as a European transportation hub. Industrial activity is predominantly in food processing, chemicals, petroleum refining, and electrical machinery. A highly mechanised agricultural sector employs no more than 2% of the labour force but provides large surpluses for the food-processing industry and for exports. The Netherlands, along with 11 of its EU partners, began circulating the euro currency on 1 January 2002. The country is one of the leading European nations for attracting foreign direct investment.[11]
The stern financial policy has been abandoned in 2009 on account of the current credit crises. The relatively large banking sector was partly nationalised and bailed out through government interventions. The unemployment rate dropped to 5.0% in the summer of 2011, but increased with a sharp rate since then to 8.3% in May 2013.[12] The state budget deficit for 2011 was 4.7%, considerably larger than expected, and much larger than the EU-mandated maximum of 3%.[13] The government already implemented austerity measures in 2011, but the economic downturn in the latter half of that year made a next round of austerity measures inevitable. As of the summer of 2013, the Rutte cabinet is planning on new budget cuts of 6 billion euros annually or more, to be announced in September.
Historically, the Dutch introduced and invented the stock market [14] by the merchandise trading through Dutch East India Company. The Netherlands is a founding member of the European Union, the OECD and the World Trade Organization.
History
After gaining its independence from the empire of Philip II of Spain in 1581, the Netherlands experienced almost a century of explosive economic growth. A technological revolution in shipbuilding led to a competitive advantage in shipping that helped the young Republic become the dominant trade power by the mid-17th century. In 1670 the Dutch merchant marine totalled 568,000 tons of shipping—about half the European total. Pillars of this position were the dominance of the Amsterdam Entrepôt in European trade, and that of the Dutch East and West India Companies in intercontinental trade. Beside trade, an early "industrial revolution" (powered by wind, water and peat), land reclamation from the sea, and agricultural revolution, helped the Dutch economy achieve the highest standard of living in Europe (and presumably the world) by the middle of the 17th century. Affluence facilitated what is known as the Dutch Golden Age. This economic boom abrubtly came to an end by a combination of politico-military upheavals and adverse economic developments around 1670.
The Netherlands did not industrialize as rapidly as Belgium after 1830, but it was prosperous enough. Griffiths argues that government policies made possible a unified Dutch national economy in the 19th century. They included the abolition of internal tariffs and guilds; the a unified coinage system, modern methods of tax collection; standardized weights and measures; and the building of many roads, canals, and railroads. However, in sharp contrast to Belgium, which was the leader in industrialization on the Continent, the Netherlands moved slowly, probably due to the high costs associated with high wages and geography, and the emphasis of entrepreneurs in trade rather than industry.[15] However, the provinces of North Brabant and Overijssel did industrialize, greatly between 1850 and 1890, and became the most advanced economically.[16][17]
As in the rest of Europe, the 19th century saw the gradual transformation of the Netherlands into a modern middle-class industrial society. The number of people employed in agriculture decreased while the country made a heroic effort to revive its stake in the highly competitive shipping and trade business. The Netherlands lagged behind Belgium until the late 19th century in industrialization, then caught up by about 1920. Major industries included textiles and (later) the great Philips industrial conglomerate. Rotterdam became a major shipping and manufacturing center.[18] Poverty slowly declined and begging largely disappeared along with steadily improving working conditions for the population.
Government
While the private sector is the cornerstone of the Dutch economy, governments at different levels have a large part to play. Public spending, including social security transfer payments, was at 28% of GDP in 2011.[19] Total tax revenue was 38.7% of GDP in 2010,[20] which was below the EU average.[21] In addition to its own spending, the government plays a significant role through the permit requirements and regulations pertaining to almost every aspect of economic activity. The government combines a rigorous and stable microeconomic policy with wide-ranging structural and regulatory reforms. The government has gradually reduced its role in the economy since the 1980s. Privatisation and deregulation is still continuing. With regards to social and economic policy, the government cooperates with its so called social partners (trade unions and employers' organizations). The three parties come together in the Social-Economic Council (‘Sociaal Economische Raad’), the main platform for social dialogue.
Controversial issues
Labour market and social welfare
The Dutch labour market has relatively strict regulations for employers on firing employees, although the House of Representatives has agreed to loosen these regulations as a part of austerity measures to reduce the governmental budget deficit to less than 3%. Unemployment benefits in the form of a 70% benefit of the employee's last-earned salary for up to three years (with a maximum of roughly 2500 euros per month) are available for fired employees, provided that they have worked for a certain minimum time period, usually 26 weeks.[22]
Age of retirement
Every Dutch citizen gets the AOW, a state pension, from age 65. Married couples or those who live together receive 50% of minimum wage per person (about 750 euros per month), single-person households receive 70% of minimum wage (about 1000 euros per month). Because of an aging population and the current economic crisis, there is a political debate on raising the retirement age. Current plans from the parliament include a gradual annual increase of the pension age until it reaches 67 in 2023, after which it is pegged to the average lifespan.[23]
Home mortgage interest deduction
The Netherlands is one of the few countries in the world where the interest paid on mortgages is fully deductible from income tax. This deduction is a politically controversial subject. Some argue that it inflates housing prices and that it has an anti-leveling effect on income distribution, since people with higher incomes generally have a more expensive house and pay a higher percentage income tax, and therefore benefit relatively more from the deduction than lower incomes. Proponents of the deduction argue that it stimulates private house ownership and that abolishing the deduction would de-stabilise the housing market. Although many political parties and economists have argued for a (partial) abolishment of the deduction, it is still in place as of 2013.
Sectors
The Service sector accounts for more than half of the national income, primarily in transportation, distribution and logistics, and in financial areas, such as banking and insurance. The breadth of service providers in financial services and a Protestant work ethic have contributed to the Netherlands achieving a DAW Index score of 5 in 2012. Industrial activity, including mining, generates about 20% of the national product and is dominated by the metalworking, oil refining, chemical, and food-processing industries. Construction amounts to about 6% of GDP. Agriculture and fishing, although visible and traditional Dutch activities, account for just 2%. Of economic importance is BrabantStad, a partnership between the municipalities of Breda, Eindhoven, Helmond, 's-Hertogenbosch and Tilburg and the province of North Brabant. The region lies within the Eindhoven-Leuven-Aachen Triangle (ELAT).[24] With a total of 1.5 million people and 20% of the industrial production in the Netherlands, BrabantStad is one of the major economically important, metropolitan regions of the Netherlands. The province of Noord-Brabant is one of the most innovative regions of the European Union. This is shown by the extensive amount of new research patents by Eurostat.[25] In BrabantStad, every year 2100 patents are applied for at the European Patent Office (EPO), which is 900 patents per million active employees.[26] Mainly due to the Dutch electronics giant Philips' scientific centers, BrabantStad has grown more important than similar centres like Paris, Stockholm and Stuttgart.[27] Together Amsterdam (airport), Rotterdam (seaport), and Eindhoven (Brainport) form the foundation of the Dutch economy.[28]
The Netherlands continues to be one of the leading European nations for attracting foreign direct investment and is one of the five largest investors in the United States. The economy experienced a slowdown in 2005, but in 2006 recovered to the fastest pace in six years on the back of increased exports and strong investment. The pace of job growth reached 10-year highs in 2007. The Netherlands is the fifth-most competitive economy in the world, according to the World Economic Forum's Global Competitiveness Report.[29]
Energy
While its oil reserves in the North Sea are of little importance, the Netherlands is the second largest natural gas producer in Europe and the ninth in the world, accounting for more than 30% of EU total annual gas production and about 2.7% of the annual world total. Proven natural gas reserves of the Netherlands are estimated (as of January 2005) at about 50-60 trillion cubic feet, or about 0.9% of the world total. Although the Netherlands owns substantial gas reserves in the North Sea, most of its production is from on-shore wells, and much of the natural gas produced by the Netherlands comes from Groningen Province, which borders the North Sea. Consumption of natural gas in the Netherlands is only about two-thirds of its production; the rest is exported and the Netherlands is the world's fifth largest natural gas exporter. Almost all Dutch households are connected to the national grid of gas used for heating and cooking, and most electricity in the Netherlands is generated by gas burning power plants.
The Netherlands has a liberalized energy market. The share of the large three companies in the electricity and gas market steadily declines every year, and was in 2011 beneath 80%.
Nuclear energy
Researchers in the Netherlands began studying nuclear energy in the 1930s and began construction of research reactor Dodewaard in 1955. Researchers’ goal was to introduce nuclear power technology by 1962 and replace fossil fuels. In 1968, a test nuclear reactor was attached to the power grid. This unit was shut down in 1997. In the 1970s, the Dutch chose a policy that required reprocessing all spent nuclear fuel. In 1984, the government decided to create a long-term (100 years) storage facility for all intermediate and low-level radioactive waste and research strategies for ultimate disposal. In September 2003, the Central Organization for Radioactive Waste created an interim storage facility for high-level waste. The Netherlands' only commercial nuclear reactor is Borssele, which became operational in 1973 and as of 2011 produces about 4% of the country’s electricity.[30] The older Dodewaard nuclear power plant was a test reactor that later got attached to the national grid but was closed in 1997. A 2MW research reactor is located in Delft, as part of the physics department of Delft University of Technology. This reactor is not meant for energy provision, but used as neutron- and positron-source for research.
In 1994, the States General of the Netherlands voted to phase out nuclear power after a discussion of nuclear waste management. In 1997, the power station at Dodewaard was shut down and the government decided it was planning to end Borssele's operating license in 2003. This has since been postponed to 2034, if it complied with the highest safety standards. The owners, Essent and Delta, will invest 500 million euro in sustainable energy, together with the government—money which the government claims otherwise should have been paid to the plants' owners as compensation. After the 2010 election, the new government was open to expanding nuclear power. Both of the companies that share ownership of Borssele are proposing to build new reactors.[31][32] In January 2012, Delta announced it postpones any decision to start building a second nuclear power plant.
Tourism
In 2011 the Netherlands was visited by 11.3 million foreign tourists.[33] In 2012, the Dutch tourism industry contributed 5.4% in total to the country's GDP and 9.6% in total to its employment. With its global ranking of 147th and 83rd place for total contribution to respectively GDP and employment, tourism is a relatively small sector of the Dutch economy.[34] North Holland was by far the most popular province for foreign tourists in 2011. Out of all 11.3 million tourists, 6 million visited North Holland. South Holland took the second place with 1.4 million. Germans, Britons and Belgians made up the majority of foreign tourists, respectively 3, 1.5 and 1.4 million.[35] There are seven World Heritage Sites in the Netherlands. The Netherlands is well known for its art and rich historical heritage.
Largest companies
The Netherlands is home to a few very large multinationals. Royal Dutch Shell is the largest private company of the Netherlands by revenue and the second largest in the world after Exxon Mobil. Other well-known multinationals are Heineken, Ahold, Philips, TomTom, Unilever, Randstad and ING, all of which have their headquarters in Amsterdam except Unilever which is located in Rotterdam. Thousands of companies of non-Dutch origin have their headquarters in the Netherlands, like EADS, LyondellBasell and IKEA, because of the extremely low Corporate tax. Multinationals that pay tax in the Netherlands can agree a special rate with the Dutch Tax and Customs Administration. These lucrative arrangements are bound by a vow of secrecy, thus the effective tax rate in specific cases is unknown. However, some companies pay less than 1% corporate tax. This has led to the Netherlands being called a tax haven, both by critics within the Netherlands and by foreign governments and politicians from France, the United Kingdom and the United States among others.
The Netherlands' biggest companies as of 2011 are as following:
| Rank[36] | Name | Headquarters | Revenue (Mil. €) | Profit (Mil. €) | Employees (World) |
|---|---|---|---|---|---|
| 1. | Royal Dutch Shell | The Hague | 378,152 | 20,127 | 97,000 |
| 2. | ING Group | Amsterdam | 147,052 | 3,678 | 106,139 |
| 3. | Aegon | The Hague | 65,136 | 2,330 | 27,474 |
| 4. | EADS | Leiden | 60,597 | 732 | 121,691 |
| 5. | LyondellBasell Industries | Rotterdam | 41,151 | N.A. | 14,000 |
| 6. | Royal Ahold | Amsterdam | 39,111 | 1,130 | 122,027 |
| 7. | Royal Philips Electronics | Amsterdam | 33,667 | 1,915 | 119,001 |
| 8. | Rabobank Group | Utrecht | 32,672 | 3,552 | 58,714 |
| 9. | GasTerra | Groningen | 24,313 | 48 | 188 |
| 10. | Heineken Holding | Amsterdam | 21,684 | 954 | 65,730 |
| — | SHV Holdings | Utrecht | 21,202 | 799 | 50,300 |
| — | Akzo Nobel | Amsterdam | 20,419 | 999 | 55,590 |
See also
- Bureau for Economic Policy Analysis
- De Nederlandsche Bank (Central Bank of The Netherlands)
- Dutch disease
- Brainport
- Port of Rotterdam
- List of companies of the Netherlands
- Ministry of Finance
- Polder Model (Dutch version of consensus policy in economics)
- Social-Economic Council (economic advisory council of the Dutch government)
- Taxation in the Netherlands
- VNO-NCW (Confederation of Netherlands Industry and Employers)
- BrabantStad
- Randstad
Sources
- CBS - Statistics agency of the Netherlands
- CPB - Netherlands Bureau for Economic Policy Analysis
- DNB - Dutch central bank
- Eurostat - EU statistics agency
- CIA World Factbook
- Infographic about the relationship of energy to the economy in the Netherlands. Dutch government, 2012
External Links
- World Bank Summary Trade Statistics Netherlands
- Useful information about the financial institutions in the Netherlands
- Tariffs applied by the Netherlands as provided by ITC's Market Access Map, an online database of customs tariffs and market requirements.
Further reading
- van Riel, Arthur. "Review: Rethinking the Economic History of the Dutch Republic: The Rise and Decline of Economic Modernity Before the Advent of Industrialized Growth," The Journal of Economic History, Vol. 56, No. 1 (Mar. 1996), pp. 223–229 in JSTOR
- de Vries, Johan. "Benelux, 1920-1970," in C. M. Cipolla, ed. The Fontana Economic History of Europe: Contemporary Economics Part One (1976) pp 1–71
- Vlekke, Bernard H. M. Evolution of the Dutch Nation (1945) 382 pp. online edition
- Wintle, Michael P. An Economic and Social History of the Netherlands, 1800–1920: Demographic, Economic, and Social Transition (Cambridge University Press, 2000) online edition
- van Zanden, J. L. The Economic History of The Netherlands 1914–1995: A Small Open Economy in the 'Long' Twentieth Century (Routledge, 1997) excerpt and text search
References
- ↑ List of countries by GDP (nominal)
- ↑ List of countries by GDP (PPP)
- ↑ "Euro area annual inflation stable at 0.5%" (PDF). Eurostat. Retrieved 17 July 2014.
- ↑ "Harmonised unemployment rate by sex". Eurostat.
- ↑ 5.0 5.1 Wages and Taxes for the Average Joe in the EU 2
- ↑ "Doing Business in Netherlands 2013". World Bank. Retrieved 2012-10-22.
- ↑ "Export Partners of The Netherlands". CIA World Factbook. 2012. Retrieved 2013-07-23.
- ↑ "Import Partners of The Netherlands". CIA World Factbook. 2012. Retrieved 2013-07-23.
- ↑ "Sovereigns rating list". Standard & Poor's. Retrieved 26 May 2011.
- ↑ 10.0 10.1 10.2 10.3 Rogers, Simon; Sedghi, Ami (15 April 2011). "How Fitch, Moody's and S&P rate each country's credit rating". The Guardian. Retrieved 31 May 2011.
- ↑ "The World Factbook". Retrieved 3 March 2015.
- ↑ "Kerncijfers - arbeid". Centraal Bureau voor de Statistiek. Retrieved 14 April 2012.
- ↑ "Begrotingstekort 2011 valt hoger uit". z24. 17 February 2012. Retrieved 14 April 2012.
- ↑ http://www1.worldbank.org/finance/assets/images/Historical_Primer.pdf
- ↑ Richard T. Griffiths, Industrial Retardation in the Netherlands, 1830-1850 (The Hague: Martinus Nijhoff, 1979).
- ↑ Richard T. Griffiths, "The Creation of a National Dutch Economy: 1795–1909," Tijdschrift voor Geschiedenis, 1982, Vol. 95 Issue 4, pp 513–53 (in English)
- ↑ Joel Mokyr, "The Industrial Revolution in the Low Countries in the First Half of the Nineteenth Century: A Comparative Case Study," Journal of Economic History (1974) 34#2 pp 365-99 in JSTOR
- ↑ Loyen, Reginald et al. (2003). Struggling for Leadership: Antwerp-Rotterdam Port. Competition 1870-2000. Springer.
- ↑ "General government final consumption expenditure (% of GDP)". World Bank. Retrieved 2013-04-07.
- ↑ "Total tax revenue as percent of GDP". OECD. Retrieved 2013-04-07.
- ↑ "Main national accounts tax aggregates". Eurostat. Retrieved 2013-04-07.
- ↑ http://www.oecd.org/els/soc/34004969.pdf
- ↑ http://www.trouw.nl/tr/nl/4504/Economie/article/detail/3257065/2012/05/17/Belangrijkste-punten-uit-het-Lente-akkoord.dhtml Lente-akkoord
- ↑ "- De factor SRE". sre.nl. Retrieved 2014-02-19.
- ↑ "Eurostat Home". epp.eurostat.ec.europa.eu. Retrieved 2014-02-19.
- ↑ "EPO - Home". epo.org. Retrieved 2014-02-19.
- ↑ European Institute of Innovation and Technology (EIT)
- ↑ "Over Brainport". brainport.nl. Retrieved 2014-02-19.
- ↑ "Global Competitiveness Report 2012–2013". World Economic Forum. 5 September 2012. Retrieved 11 June 2013.
- ↑ "Nuclear Power in the Netherlands". World Nuclear Association (WNA). January 2011. Retrieved 2011-02-21.
- ↑ Orlowski, Andrew (10 February 2011). "Holland slashes carbon targets, shuns wind for nuclear". The Register. Retrieved 2011-02-21.
- ↑ Gassmann, Michael (8 February 2011). "Energiepolitik: Holland plant strahlende Zukunft". Financial Times Deutschland (in German). Retrieved 2011-02-21.
- ↑ "UNWTO Tourism Highlights, 2013 Edition". United Nations World Tourism Organization. Bla. Retrieved 25 August 2013. Check date values in:
|date=(help) - ↑ "Netherlands Economic Impact Report". World Travel & Tourism Council. Bla. Retrieved 25 August 2013. Check date values in:
|date=(help) - ↑ "Toerisme en recreatie in cijfers 2012" (in Dutch). Statistics Netherlands. Blah. Retrieved 25 August 2013. Check date values in:
|date=(help) - ↑ "Global 500 - Fortune". Fortune. Retrieved 3 March 2015.
| ||||||||||
| ||||||||||||||||||||||||||
| ||||||||||||||||||
| ||||||||||||||||||||
