Economy of the European Union
| Economy of the European Union | |||||||||||||||||||||||||||||
|---|---|---|---|---|---|---|---|---|---|---|---|---|---|---|---|---|---|---|---|---|---|---|---|---|---|---|---|---|---|
 | |||||||||||||||||||||||||||||
| Currency | 1 Euro (€) = 100 cents | ||||||||||||||||||||||||||||
| Other currencies in member states |
|||||||||||||||||||||||||||||
| Statistics | |||||||||||||||||||||||||||||
| GDP ranking | 1st (2013) | ||||||||||||||||||||||||||||
| GDP (Nominal) | US$17.372 trillion (2013) €13.070 trillion (2013) | ||||||||||||||||||||||||||||
| GDP (PPP) | US$16.260 trillion (2013) | ||||||||||||||||||||||||||||
| GDP growth rate | 0,1% (2013) | ||||||||||||||||||||||||||||
| GDP per capita | US$34,300 (nominal) US$32,152 (PPP) (2013) | ||||||||||||||||||||||||||||
| GDP by sector (2006) | 70.5% services 27.3% industry 2.1% agriculture | ||||||||||||||||||||||||||||
| Inflation | 1.5 % (2013) | ||||||||||||||||||||||||||||
| Population below poverty threshold | 17% | ||||||||||||||||||||||||||||
| Labour force | 240.2 million | ||||||||||||||||||||||||||||
| Labour force by occupation (2011) | 69.8% services 25.2% industry 5.0% agriculture | ||||||||||||||||||||||||||||
| Unemployment | 10.4% (April 2014) | ||||||||||||||||||||||||||||
| Sources: | |||||||||||||||||||||||||||||
| Trading partners | |||||||||||||||||||||||||||||
| Export of goods | €1.737 trillion (2013) $2.302 trillion (2013) | ||||||||||||||||||||||||||||
| Export of services | €657.4 billion (2013) $880 billion (2013) | ||||||||||||||||||||||||||||
| Export goods (2013) | |||||||||||||||||||||||||||||
| Main export partners (2013)
|
|||||||||||||||||||||||||||||
| Import of goods | €1.682 trillion (2013) $2.235 trillion (2013) | ||||||||||||||||||||||||||||
| Import of services | €510.6 billion (2012) $667.0 billion (2013) | ||||||||||||||||||||||||||||
| Import goods (2013) | |||||||||||||||||||||||||||||
| Main import partners (2013)
|
|||||||||||||||||||||||||||||
| FDI inward stock | € 3.947 trillion (2012) | ||||||||||||||||||||||||||||
| FDI outward stock | € 5.206 trillion (2012) | ||||||||||||||||||||||||||||
| Sources: | |||||||||||||||||||||||||||||
| Balance of Payments | |||||||||||||||||||||||||||||
| Current account | € 155.736 billion (2013) | ||||||||||||||||||||||||||||
| Sources: | |||||||||||||||||||||||||||||
| Public finances | |||||||||||||||||||||||||||||
| Government debt | € 11,386.0 billion (87.1% of GDP) (2013) | ||||||||||||||||||||||||||||
| Deficit spending | € -437.3 billion (-3.3% of GDP) (2013) | ||||||||||||||||||||||||||||
| Expenditure | 49.0% of GDP (2013) | ||||||||||||||||||||||||||||
| Revenue | 45.7% of GDP (2013) | ||||||||||||||||||||||||||||
| Sources: | |||||||||||||||||||||||||||||
The economy of the European Union generates a GDP (nominal) of about €14.303 trillion (US$18.451 trillion in 2014) and a GDP (PPP) of about €12.710 trillion (US$16.773 trillion in 2014) according to International Monetary Fund,[1] which makes it the largest or second largest economy in the world respectively if treated as the economy of a single country depending on a source used.
The European Union (EU) economy consists of an internal market and the EU is represented as a unified entity in the World Trade Organization (WTO).
Currency
19 out of 28 EU member states use the euro as official currency in a currency union. Five of these 19 eurozone states struggle with a debt crisis after having joined the euro. The remaining 9 states use their own currency with the possibility to join the euro later. The euro is also the most widely used currency in the EU.
The Stability and Growth Pact sets out the fiscal criteria to maintain for stability and (economic) convergence. The Maastricht treaty sets out more rigid criteria for the states joining the euro.
Denmark and the United Kingdom, not members of the eurozone, have special opt-outs concerning the later joining. Also, Sweden can effectively opt out by choosing when or whether to join the European Exchange Rate Mechanism, which is the preliminary step towards joining. The remaining states are committed to join the Euro through their Treaties of Accession.
Budget
The operation of the EU has an agreed budget of €141 billion for the year 2011, and €862 billion for the period 2007–2013,[2] this represents around 1% of the EU's GDP.
Economic variation
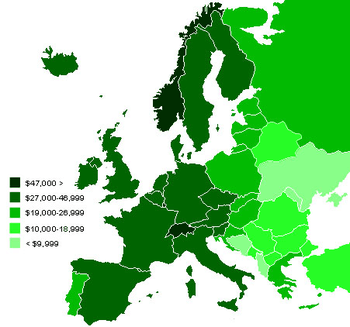
Below is a table showing, respectively, the GDP and the GDP (PPP) per capita for the European Union and for each of its member states, sorted by GDP (PPP). This can be used as a rough gauge to the relative standards of living among member states, with Luxembourg the highest and Bulgaria the lowest. Eurostat, based in Luxembourg, is the Official Statistical Office of the European Communities releasing yearly GDP figures for the member states as well as the EU as a whole, which are regularly updated, supporting this way a measure of wealth and a base for the European Union's budgetary and economic policies. Figures are stated in euro.
| Member states | GDP 2014 millions of euro |
Population in millions[3] |
GDP (PPP) per capita 2013 euro |
GDP (Nominal) per capita 2014 euro |
GDP (PPP) per capita 2013 EU28 = 100 |
Eurozone yes/no |
|---|---|---|---|---|---|---|
| |
13,920,541 | 507.4 | 26,600 | 27,300 | 100% | |
| |
2,903,790 | 80.8 | 32,600 | 35,200 | 122% | yes |
| |
2,217,872 | 64.3 | 28,900 | 34,400 | 109% | no |
| |
2,142,022 | 65.9 | 28,400 | 32,400 | 107% | yes |
| |
1,616,048 | 60.8 | 26,500 | 26,600 | 99% | yes |
| |
1,058,469 | 46.5 | 25,000 | 22,800 | 94% | yes |
| |
653,476 | 16.8 | 34,900 | 38,700 | 131% | yes |
| |
429,468 | 9.6 | 33,700 | 44,300 | 127% | no |
| |
412,189 | 38.5 | 17,900 | 10,700 | 67% | no |
| |
402,270 | 11.2 | 31,600 | 36,100 | 119% | yes |
| |
328,996 | 8.5 | 34,000 | 38,500 | 128% | yes |
| |
256,938 | 5.6 | 33,100 | 45,500 | 124% | no |
| |
204,015 | 5.5 | 30,100 | 37,400 | 113% | yes |
| |
185,412 | 4.6 | 34,500 | 40,200 | 130% | yes |
| |
179,081 | 11.0 | 19,400 | 16,300 | 73% | yes |
| |
174,384 | 10.4 | 21,000 | 16,800 | 79% | yes |
| |
154,939 | 10.5 | 21,900 | 14,700 | 82% | no |
| |
150,665 | 19.9 | 14,500 | 7,600 | 55% | no |
| |
103,303 | 9.9 | 17,600 | 10,500 | 66% | no |
| |
75,215 | 5.4 | 20,000 | 13,900 | 76% | yes |
| |
43,085 | 4.2 | 16,100 | 10,200 | 61% | no |
| |
45,288(2013) | 0.5 | 68,500 | 83,100(2013) | 257% | yes |
| |
42,011 | 7.2 | 11,900 | 5,800 | 45% | no |
| |
37,246 | 2.1 | 21,800 | 18,100 | 82% | yes |
| |
36,288 | 2.9 | 19,400 | 12,400 | 73% | yes |
| |
24,058 | 2.0 | 17,000 | 12,100 | 64% | yes |
| |
19,526 | 1.3 | 19,500 | 14,800 | 73% | yes |
| |
17,506 | 0.9 | 23,600 | 20,500 | 89% | yes |
| |
7,962 | 0.4 | 23,000 | 18,600 | 86% | yes |
| EU Candidates | GDP 2013 millions of euro |
Population in millions |
GDP (PPP) per capita 2013 euro |
GDP (Nominal) per capita 2013 euro |
GDP (PPP) per capita 2013 perc. of EU28 |
Eurozone yes/no |
|---|---|---|---|---|---|---|
| |
617,794 | 76.7 | 9,500 | 7,500(2011) | 53% | no |
| |
33,059(2014) | 7.1 | 9,800 | 4,800 | 37% | no |
| |
12,854(2014) | 0.3 | 31,700 | 39,500(2014) | 119% | no |
| |
8,975[4] | 2,9 | 7,800 | 2,803 | 28% | no |
| |
8,123 | 2.1 | 9,500 | 3,900 | 36% | no |
| |
3,149(2012) | 0.6 | 40% | no | ||
| EFTA members | GDP 2014 millions of euro |
Population in millions |
GDP (PPP) per capita 2013 euro |
GDP (Nominal) per capita 2014 euro |
GDP (PPP) per capita 2013 perc. of EU28 |
Eurozone yes/no |
|---|---|---|---|---|---|---|
| |
516,068(2013) | 8.1 | 43,000 | 63,800(2013) | 163% | no |
| |
377,224 | 5.1 | 49,600 | 73,400 | 186% | no |
p: provisional value
e: estimated value
Source: GDP Millions:EUROSTAT,[5] GDP(nominal) per inhabitant: EUROSTAT,[5] GDP per capita in PPS :EUROSTAT,[6] GDP per capita expressed in PPS in percentage of EU (2013): EUROSTAT[7]
Economies of member states
Economic performance varies from state to state. The Growth and Stability Pact governs fiscal policy with the European Union. It applies to all member states, with specific rules which apply to the eurozone members that stipulate that each state's deficit must not exceed 3% of GDP and its public debt must not exceed 60% of GDP. However, many larger members have consistently run deficits substantially in excess of 3%, and the eurozone as a whole has a debt percentage exceeding 60% (see below).
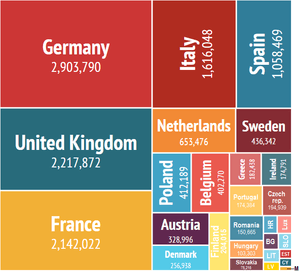
The following table shows information relating to the member states of the European Union, ordered according to the 'Size' of their economies. (NB: Were the table ordered according to 'GDP per capita' this would perhaps better reflect the strength of an individual economy. But this is not how such tables are commonly structured.) The colours denote how a member state is performing relative to the rest of the European Union, above average (green) or below average (red). The smallest and greatest values in each column are emphasised.
The data for GDP and GDP per capita (PPP) are based on the World Economic Outlook, October 2014 (International Monetary Fund).[8]
| Member State sorted by GDP |
GDP in billions of USD (2014)[8] |
GDP % of EU (2014) |
Annual change % of GDP (2013) |
GDP per capita in PPP US$ (2014) |
Public Debt[9] % of GDP (2014) |
Deficit (-)/ Surplus (+)[10] % of GDP (2013) |
Inflation % Annual[11] (2014) |
Unemp.[12] % 2015 M03 |
|---|---|---|---|---|---|---|---|---|
| 18,398.7 | 100.0 | 0.1 | 35,849 | 86.8 | −3.1 | 0.6 | 9.8 | |
| 3,859.5(e) | 21.0% | 0.4 | 45,888(e) | 74.7 | 0.0 | 0.8 | 4.7 | |
| 2,945.1 | 16.0% | 1.7 | 39,511 | 89.4 | −4.3 | 1.5 | 5.5(M1) | |
| 2,846.9 | 15.5% | 0.2 | 40,375 | 95.0 | −5.7 | 0.6 | 10.6 | |
| 2,148.0 | 11.7% | −1.9 | 35,486 | 132.1 | −3.1 | 0.2 | 13.0 | |
| 1,406.9 | 7.6% | −1.2 | 33,711 | 97.7 | −6.6 | -0.2 | 23.0 | |
| 866.5 | 4.7% | −0.8 | 47,354 | 68.8 | −2.5 | 0.3 | 7.0 | |
| 570.1 | 3.1% | 1.5 | 45,986 | 43.9 | −1.1 | 0.2 | 7.6 | |
| 546.6(e) | 3.0% | 1.6 | 25,105 | 50.1 | −4.3 | 0.1 | 7.7 | |
| 534.7 | 2.9% | 0.2 | 42.973(e) | 106.5 | −2.8 | 0.5 | 8.5 | |
| 437.1(e) | 2.4% | 0.8 | 46.420(e) | 84.5 | −0.9 | 1.5 | 5.6 | |
| 340.8(e) | 1.9% | 0.4 | 44,343(e) | 45.2 | −0.9 | 0.3 | 6.4 | |
| 271.2 | 1.5% | −1.4 | 40.347(e) | 59.3 | −2.1 | 1.2 | 9.1 | |
| 246.4 | 1.3% | 0.9 | 49,195 | 109.7 | −6.7 | 0.3 | 9.8 | |
| 238.0 | 1.3% | 0.8 | 25,859 | 177.1 | −2.1 | -1.4 | 25.7(M1) | |
| 230.0 | 1.3% | 0.9 | 26.975 | 130.2 | −4.5 | -0.2 | 13.5 | |
| 205.7 | 1.1% | −0.9 | 29.925(e) | 42.6 | −1.5 | 0.4 | 5.8 | |
| 200.0 | 1.1% | 3.5 | 19.712 | 39.8 | −2.3 | 1.4 | 6.5 | |
| 137.1(e) | 0.7% | 1.1 | 24.942(e) | 76.9 | −2.2 | 0.0 | 7.4(M2) | |
| 100.0 | 0.5% | 0.9 | 28.175(e) | 53.6 | −2.8 | -0.1 | 12.2 | |
| 62.4(e) | 0.3% | 2.1 | 92.049(e) | 23.6 | 0.1 | 0.7 | 5.7 | |
| 57.2 | 0.3% | -1.0 | 20,889(e) | 85.0 | −4.9 | 0.2 | 18.2 | |
| 55.8 | 0.3% | 0.9 | 17,860 | 27.6 | −1.5 | -1.6 | 10.4 | |
| 49.5 | 0.3% | −1.1 | 29,658 | 80.9 | −4.3 | 0.4 | 9.3 | |
| 48.2(e) | 0.3% | 3.3 | 27,051(e) | 40.9 | 0.2 | 1.2 | 9.5 | |
| 32.0(e) | 0.2% | 4.1 | 23,706(e) | 40.0 | −1.1 | 0.7 | 10.4(M12 2014) | |
| 26.0(e) | 0.1% | 0.8 | 26,999(e) | 10.6 | −0.2 | 0.5 | 5.9(M2) | |
| 23.7 | 0.1% | −5.4 | 30,769 | 107.5 | −5.2 | -0.3 | 16.0 | |
| 10.6(e) | 0.06% | 3.5 | 33,216(e) | 68.0 | −2.1 | 0.8 | 5.8 |
Economic growth

The EU's share of Gross world product (GWP) is stable at around one fifth.[14]
The twelve new member states of the European Union have enjoyed a higher average percentage growth rate than their elder members of the EU. Slovakia has the highest GDP growth in the period 2005–2011 among all countries of the European Union (See Tatra Tiger). Notably the Baltic states have achieved massive GDP growth, with Latvia topping 11%, close to China, the world leader at 9% on average for the past 25 years (though these gains have been in great part cancelled by the late-2000's recession).
Reasons for this massive growth include government commitments to stable monetary policy, export-oriented trade policies, low flat-tax rates and the utilisation of relatively cheap labour. For the last year (2011), Estonia had the highest GDP growth from all the states in EU (7,6%). The current map of EU growth is one of huge regional variation, with the larger economies suffering from stagnant growth and the new nations enjoying sustained, robust economic growth.
Although EU27 GDP is on the increase, the percentage of Gross world product is decreasing due to the emergence of economic powers such as China, India and Brazil.
Energy resourcesMain article: Energy policy of the European Union
The European Union has limited coal, oil, and natural gas reserves. There are six oil producers in the European Union, primarily in North Sea oilfields. The United Kingdom by far is the largest producer, however Denmark, Germany, Italy, Romania and the Netherlands all produce oil. If it is treated as a single unit, which is not conventional in the oil markets, the European Union is the 19th largest producer of oil in the world, producing 1,241,370 (2013) barrels a day. It is the world's second largest consumer of oil, consuming much more than it can produce, at 12,790,000 (2013) barrels a day. Much of the difference comes from Russia and the Caspian Sea basin. All countries in the EU have committed to the Kyoto Protocol, and the European Union is one of its biggest proponents. The European Commission published proposals for the first comprehensive EU energy policy on 10 January 2007.
TradeFurther information: List of the largest trading partners of the European Union
 EU Top 10 trading partners (2010) Top 11–20 trading partners (2010) 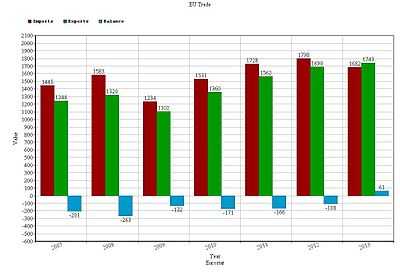 EU imports, exports and balance of trade in goods from 2007 to 2013 (in billions of euro) 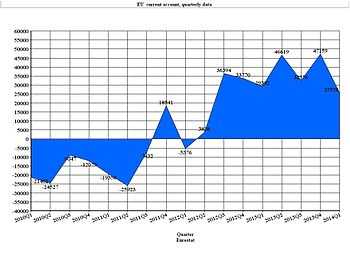 EU current account(quarterly data ) in millions of euro. The European Union is the largest exporter in the world[17] and as of 2008 the largest importer of goods and services.[18] Internal trade between the member states is aided by the removal of barriers to trade such as tariffs and border controls. In the eurozone, trade is helped by not having any currency differences to deal with amongst most members.[19] The European Union Association Agreement does something similar for a much larger range of countries, partly as a so-called soft approach ('a carrot instead of a stick') to influence the politics in those countries. The European Union represents all its members at the World Trade Organization (WTO), and acts on behalf of member states in any disputes. When the EU negotiates trade related agreement outside the WTO framework, the subsequent agreement must be approved by each individual EU member.[19]
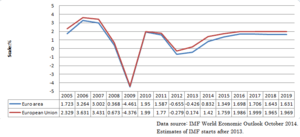
Unemployment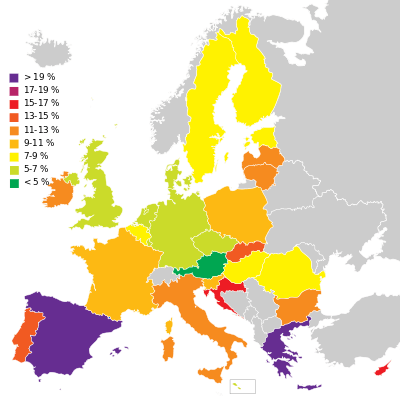 Unemployment rate by country in the EU in May 2014.  Unemployment rates in selected European countries and in the EU28 between 01/2004 and 04/2014. The euro area seasonally-adjusted unemployment rate was 12.1% in November 2013, stable since April. The EU unemployment rate was 10.9%, stable since May. In both zones, the rates increased compared with November 2012, when they were 11.8% and 10.8% respectively. Among the Member States, the lowest unemployment rates were recorded in Austria (4.8%), Germany (5.2%) and Luxembourg (6.1%), and the highest in Greece (27.4% in September 2013) and Spain (26.7%).[22] The following tables show the history of the unemployment rate for all European Union member states and comparisons to the United States and Japan:
IndustriesThe services sector is by far the most important sector in the European Union, making up 69.4% of GDP, compared to the manufacturing industry with 28.4% of GDP and agriculture with only 2.3% of GDP. AgricultureThe agricultural sector is supported by subsidies from the European Union in the form of the Common Agricultural Policy (CAP). In 2013 this represented approximately €45billion (less than 33% of the overall budget of €148billion) of the EU's total spending.[24] It was used originally to guarantee a minimum price for farmers in the EU. This is criticised as a form of protectionism, inhibiting trade, and damaging developing countries; one of the most vocal opponents is the UK, the third largest economy within the bloc, which has repeatedly refused to give up the annual UK rebate unless the CAP undergoes significant reform; France, the biggest beneficiary of the CAP and the bloc's second largest economy, is its most vocal proponent. The CAP is however witnessing substantial reform. In 1985, around 70% of the EU budget was spent on agriculture. In 2011, direct aid to farmers and market-related expenditure amount to just 30% of the budget, and rural development spending to 11%. By 2011, 90% of direct support had become non-trade-distorting (not linked to production) as reforms have continued to be made to the CAP, its funding and its design.[25] TourismThe European Union is a major tourist destination, attracting visitors from outside of the Union and citizens travelling inside it. Internal tourism is made more convenient by the Schengen treaty and the euro. All citizens of the European Union are entitled to travel to any member state without the need of a visa. France is the world's number one tourist destination for international visitors, followed by Spain, Italy, Germany and the United Kingdom. It is worth noting however a significant proportion of international visitors to EU countries are from other member states. London, the capital of the United Kingdom is also the world's most visited city and the highest in tourism receipts, before Paris.[26] CompaniesThe European Union's member states are the birthplace of many of the world's largest leading multinational companies, and home to its global headquarters. Among these are distinguished companies ranked first in the world within their industry/sector, like Allianz, which is the largest financial service provider in the world by revenue; WPP plc which is the world's largest advertising agency by revenue; Airbus, which is the world's largest aircraft manufacturer;[27] Air France-KLM, which is the largest airline company in the world in terms of total operating revenues; Amorim, which is the world's largest cork-processing and cork producer company; ArcelorMittal, which is the largest steel company in the world; Inditex which is the biggest fashion group in the world; Groupe Danone, which has the world leadership in the dairy products market. Anheuser-Busch InBev is the largest beer company in the world; L'Oréal Group, which is the world's largest cosmetics and beauty company; LVMH, which is the world's largest luxury goods conglomerate; Nokia Corporation, which is the world's largest manufacturer of mobile telephones; Royal Dutch Shell, which is one of the largest energy corporations in the world; and Stora Enso, which is the world's largest pulp and paper manufacturer in terms of production capacity, in terms of banking and finance the EU has some of the worlds largest notably HSBC and Grupo Santander, the largest bank in Europe in terms of Market Capitalisation. Many other European companies rank among the world's largest companies in terms of turnover, profit, market share, number of employees or other major indicators. A considerable number of EU-based companies are ranked among the worlds' top-ten within their sector of activity. Europe is also home to many prestigious car companies such as Audi, Mercedes, Jaguar Land Rover, Volkswagen, BMW group as well as volume manufacturers such as Fiat, PSA group and Renault. Regional variationComparing the richest areas of the EU can be a difficult task. This is because the NUTS 1 & 2 regions are not homogenous, some of them being very large regions, such as NUTS-1 Hesse (21,100 km²) or NUTS-1 Île-de-France (12,011 km²), whilst other NUTS regions are much smaller, for example NUTS-1 Hamburg (755 km²) or NUTS-1 Greater London (1,580 km²). An extreme example is Finland, which is divided for historical reasons into mainland Finland with 5.3 million inhabitants and Åland, an autonomous archipelago with a population of 27,000, or about the population of a small Finnish city. One problem with this data is that some areas, including Greater London, are subject to a large number of commuters coming into the area, thereby artificially inflating the figures. It has the effect of raising GDP but not altering the number of people living in the area, inflating the GDP per capita figure. Similar problems can be produced by a large number of tourists visiting the area. The data is used to define regions that are supported with financial aid in programs such as the European Regional Development Fund. The decision to delineate a Nomenclature of Territorial Units for Statistics (NUTS) region is to a large extent arbitrary (i.e. not based on objective and uniform criteria across Europe), and is decided at European level (See also: Regions of the European Union). Top 10: economically strongest NUTS-1 and NUTS-2 regionsSee also: List of countries by GDP (PPP) per capita, List of metropolitan areas in the European Union by GDP and First-level NUTS of the European Union
The 10 NUTS-1 and NUTS-2 regions with the highest GDP per capita are almost all, except two, in the first fifteen-member states: Prague and Bratislava are the only ones in the 12 new member states that joined in May 2004 and January 2007.[28] The leading regions in the ranking of NUTS-2 regional GDP per inhabitant in 2011 were Inner London in the United Kingdom (321% of the average), the Grand Duchy of Luxembourg (266%) and Bruxelles/Brussels in Belgium (222%). Figures for these three regions, however, are artificially inflated by the commuters who do not reside in these regions ("Net commuter inflows in these regions push up production to a level that could not be achieved by the resident active population on its own. The result is that GDP per inhabitant appears to be overestimated in these regions and underestimated in regions with commuter outflows."[28]). Another example of artificial inflation is Groningen. The calculated GDP per capita is very high due to the large natural gas reserves in this region. However, Groningen is in fact one of the poorest parts in the Netherlands. Among the 41 NUTS-2 regions exceeding the 125% level, eleven were in Germany, five in the Netherlands and in Austria, three each in Belgium, Italy and United Kingdom, two each in Spain and Finland and one in Czech Republic, Denmark, Ireland, France, Slovakia and Sweden, as well as in the single region Grand Duchy of Luxembourg. The NUTS Regulation lays down a minimum population size of 3 million and a maximum size of 7 million for the average NUTS-1 region, whereas a minimum of 800,000 and a maximum of 3 million for NUTS-2 regions ¹ . This definition, however, is not respected by Eurostat. E.g.: the région of Île-de-France, with 11.6 million inhabitants, is treated as a NUTS-2 region, while the state Free Hanseatic City of Bremen, with only 664,000 inhabitants, is treated as a NUTS-1 region.
Source: Eurostat[28] Economically weakest NUTS-2 regionsThe eight lowest regions in the ranking in 2011 were all in Bulgaria and Romania, with the lowest figures recorded in Severozapaden in Bulgaria and Nord-Est in Romania (both 29% of the average), followed by Severen tsentralen in Bulgaria (31%) and Yuzhen tsentralen in Bulgaria (32%). Among the 75 regions below the 75% level, fifteen were in Poland, nine in Greece, seven each in the Czech Republic and Romania, six in Hungary, five each in Italy and Portugal, four each in Portugal and the United Kingdom, three in Slovakia, two each in Spain, France and Croatia, one in Slovenia as well as the member states Estonia, Latvia and Lithuania.[28]
Source: Eurostat[28] Richest and poorest NUTS regions (GDP PPP 2011)
Source: Eurostat[28] See also
References
The following links are used for the GDP growth and GDP totals (IMF):
External links
| |||||||||||||||||||||||||||||||||||||||||||||||||||||||||||||||||||||||||||||||||||||||||||||||||||||||||||||||||||||||||||||||||||||||||||||||||||||||||||||||||||||||||||||||||||||||||||||||||||||||||||||||||||||||||||||||||||||||||||||||||||||||||||||||||||||||||||||||||||||||||||||||||||||||||||||||||||||||||||||||||||||||||||||||||||||||||||||||||||||||||||||||||||||||||||||||||||||||||||||||||||||||||||||||||||||||||||||||||||||||||||||||||||||||||||||||||||||||||||||||||||||||||||||||||||||||||||||||||||||||||||||||||||||||||||||||||||||||||||||||||||||||||||||||||||||||||||||||||||||||||||||||||||||||||||||||||||||||||||||||||||||||||||||||||||||||||||||||||||||||||||||||||||||||||||||||||||||||||||||||||||||||||||||||||||||||||||||||||||||||||||||||||||||||||||||||||||||||||||||||||||||||||||||||||||||||||||||||||||||||||||||||||||||||||||||||||||||||||||||||||||||||||||||||||||||||||||||||||||||||||||||||||||||||||||||||||||||||||||||||||||||||||||||||||||||||||||||||||||||||