Economy of Poland
| Economy of Poland | |
|---|---|
|
| |
| Currency | 1 zloty (PLN) = 100 groszy |
| Calendar year | |
Trade organisations | EU, WTO and OECD |
| Statistics | |
| GDP |
$517.5 billion (nominal, 2013)[1] |
| GDP rank | 21st (PPP, 2012) |
GDP growth |
|
GDP per capita |
$13,648 (nominal, 2014)[1] |
GDP by sector | agriculture: 3.5%; industry: 34.2%; services: 62.3% (2012) |
| 0.7% (CPI, 2014)[3] | |
| 31.1 (2010) | |
Labour force |
|
Labour force by occupation | agriculture: 12.9%; industry: 30.2%; services: 57.0% (2010) |
| Unemployment |
|
Average gross salary | €975.96/$1,320, monthly (2014)[4] |
Main industries | machine building, iron and steel, mining coal, chemicals, ship building, food processing, glass |
| 32nd[5] | |
| External | |
| Exports |
|
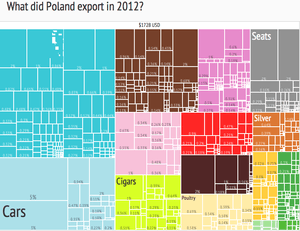
Export goods | machinery and transport equipment 37.8%, intermediate manufactured goods 23.7%, miscellaneous manufactured articles 17.1%, food and live animals 7.6% (2011) |
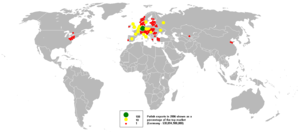
Main export partners |
|
| Imports |
|
Import goods | machinery and transport equipment 38.8%, intermediate manufactured goods 21.0%, chemicals 15.0%, minerals, fuels, lubricants and related materials 12.6%, miscellaneous manufactured articles 9.0% (2011) |
Main import partners |
|
FDI stock |
|
Gross external debt |
|
| Public finances | |
|
| |
| Revenues | $89.47 billion (2012 est.) |
| Expenses | $99.54 billion (2012 est.) |
| Economic aid |
$137 billion EU structural funds (2007–13) $142 billion EU structural funds (2014–20)[8] |
|
A (Domestic) | |
Foreign reserves | US$97.93 billion (31 December 2012 est.) |
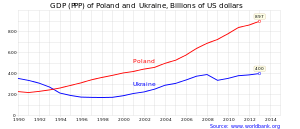
The Economy of Poland is the sixth-largest in the EU,[11] and the largest among the ex-communist members of the European Union.[12] Before the late-2000s recession its economy grew a yearly growth rate of over 6.0% .[13] According to the Central Statistical Office of Poland, in 2010 the Polish economic growth rate was 3.9%, which was one of the best results in Europe. In Q1 2014 its economy grew by 3.4% and is expected to grow by 3.4% in 2014, 3.7% in 2015 and 3.9% in 2016.
History
Before 1989
This article discusses the economy of the current Poland, post-1989. For historical overview of past Polish economies, see:
- Economy of the People's Republic of Poland (1945–1989)
- Economy of the Second Polish Republic (1918–1939)
- Economy of the Polish–Lithuanian Commonwealth (1569–1795)
1990-2009
The Polish state has steadfastly pursued a policy of economic liberalization throughout the 1990s, with positive results for economic growth but negative results for some sectors of the population.[14] The privatization of small and medium state-owned companies and a liberal law on establishing new firms has encouraged the development of the private business sector, which has been the main drive for Poland's economic growth. The agricultural sector remains handicapped by structural problems, surplus labor, inefficient small farms, and a lack of investment. Restructuring and privatization of "sensitive sectors" (e.g. coal), has also been slow, but recent foreign investments in energy and steel have begun to turn the tide. Recent reforms in health care, education, the pension system, and state administration have resulted in larger than expected fiscal pressures. Improving this account deficit and tightening monetary policy, with focus on inflation, are priorities for the Polish government. Further progress in public finance depends mainly on the reduction of public sector employment, and an overhaul of the tax code to incorporate farmers, who currently pay significantly lower taxes than other people with similar income levels. Despite some continued systemic problems, Poland has made great economic progress over the last decade, and now is ranked 20th worldwide in terms of GDP.[15] The largest component of its economy is the service sector. With the economic reform of 1989 the Polish external debt increased from $42,2 billion in 1989[16] to $365.2 billion in 2014[17]
Since the 2009 financial crisis
Since the global recession of 2009, Poland's GDP continued to grow. In 2009, at the high point of the crisis, the GDP for the European Union as a whole dropped by 4.5% while Polish GDP increased by 1.6%.[18] As of November 2013, the size of EU's economy remains below the pre-crisis level, while Poland's economy increased by a cumulative 16%.[18] The major reasons for its success appear to be a large internal market (in terms of population is sixth in EU) and a business friendly political climate. The economic reforms implemented after the fall of communism in the 1990s have also played a role; between 1989 and 2007 Poland's economy grew by 177%, faster than other countries in Eastern and Central Europe, while at the same time millions were left without work.[18]
Another factor which allowed the Polish economy to avoid the financial crisis was its low level of public debt, at about 50% of GDP, below the EU average (around 90%).[18] Strict financial regulation also helped to keep household and corporate debt low. Furthermore, unlike many other European countries, Poland did not implement austerity but rather boosted domestic demand through Keynesian policy of tax cut, and foreign-assistance funded public spending.[18] An additional reason for its success lay in the fact that Poland is outside the Euro zone. The depreciation of the currency, the złoty, increased international competitiveness and boosted the value of Poland's exports (in złotys).[18]
However, the economic fluctuations of the business cycle did have an impact on Poland's unemployment rate, which by early 2013 reached almost 11%. This level was still below European average and has begun falling subsequently.[18] A of February 2014, Poland's unemployment rate stood at 14% according to Polish Central Statistics Office[19] and 9.7% according to Eurostat which stated European average is 10.6% (and 11.9% for the EU18).[20] Unemployment remains a permanent and one of the most important problems of Poland and has been growing since years[21] and Polish unemployment remains one of the highest in EU[22] Warsaw Business Journal remarked that the fact that despite the growing GDP Polish unemployment remained "stubbornly high" casts shadow over claims of economic success; in 2012 the unemployment rate in Poland was 13.3 percent,higher than it was in 1991 (12.2 )after capitalist reforms were initiated[23] Entrenched structural unemployment is especially problematic in Poland, with 46% of the jobless being long term unemployed[24] Lack of employment opportunities, low wages and poverty have led to flight of over 2 million Poles to Western EU in search of better life since 2004; with most being in the young demographic and not intending to return to Poland, this is expected to cause long term problems in Polish economy[25] According to professor Gavin Rae from Kozminski University most of Polish recent economic growth was based on ability to leverage funding from EU[26]
Labour market and wages

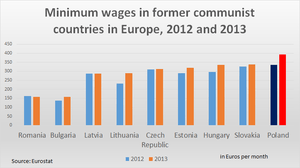
Despite Polish productivity rising to 2/3 of those in the West, the wages in Poland remained low, at 1/3 of that in the West, this has contributed to the flight of Polish population from the country.[27]
Poland has the highest number of workers in the EU employed on so-called 'junk contracts', i.e. non-fixed, temporary contracts. Whilst the average share in the EU is less than 15%, in Poland it exceeds 27%. This number has increased by more than five times since 2000, when only 5% of workers were employed on 'junk contracts' and particularly affects the young population among whom over 60% of workers are employed on such conditions; this problem is exacerbated by the large number of people (19%) being forced to work as self-employed[24] Employers are not required to pay social insurance for these workers, meaning that they will receive the lowest level of pension upon their retirement, while also depriving the National Insurance Fund (ZUS) of funds needed[24]
Foreign trade and FDI
With the collapse of the rouble-based COMECON trading bloc in 1991, Poland reoriented its trade. As early as 1996, 70% of its trade was with EU members. Neighboring Germany is Poland's main trading partner today. Poland joined the European Union in May 2004. Before that, it fostered regional integration and trade through the Central European Free Trade Agreement (CEFTA), which included Hungary, the Czech Republic, Slovakia and Slovenia.
Poland is a founding member of the World Trade Organization.[28] As a member of the European Union, it applies the common external tariff to goods from other countries including the United States. Major Poland's imports are capital goods needed for industrial retooling and for manufacturing inputs. The country's exports also include machinery, but are highly diversified. The most successful exports are furniture, organic foods and meats,[29] motor boats, light planes, hardwood products, casual clothing, shoes and cosmetics.[30] Germany is by far the biggest importer of Poland's exports as of 2013.[31] In the agricultural sector, the biggest money-makers abroad include smoked and fresh fish, fine chocolate, and dairy products, meats and specialty breads,[32] with the exchange rate conducive to export growth.[33] Food exports amounted to 62 billion zloty in 2011, increasing by 17% from 2010.[34] Most Polish exports to the U.S. receive tariff benefits under the Generalized System of Preferences (GSP) program.
Poland is less dependent on external trade than most other Central and Eastern European countries, but its volume of trade with Europe is still substantial. In 2011 the volume of trade (exports plus imports) with the Euro area as share of GDP was 40%, a doubling from the mid 1990s. 30% of Poland's exports are to Germany and another 30% to the rest of Europe. There has been substantial increase in Poland's exports to Russia.[35] However in August 2014, exports of fruits and vegetables to Russia fell dramatically following its politically motivated ban by Moscow.[36]
Foreign direct investment (FDI) was at 40% of GDP in 2010, a doubling over the level in 2000. Most FDI into Poland comes from France, Germany and Netherlands. Polish firms in turn have foreign investments primarily in Italy and Luxembourg. Most of the internal FDI is in manufacturing, which makes it susceptible to economic fluctuations in the source countries.[35]
The UAE has become Poland's largest trading partner in the Arab world, Roman Chalaczkiewicz, Polish Ambassador to the UAE, told Gulf News.[37]
Polish law is rather favourable to foreign entrepreneurs. The government offers investors various forms of state aid, such as: CIT tax at the level of 19% and investment incentives in 14 Special Economic Zones (among others: income tax exemption, real estate tax exemption, competitive land prices), several industrial and technology parks, the possibility to benefit from the EU structural funds, brownfield and greenfield locations. According to the National Bank of Poland (NBP) the level of FDI inflow into Poland in 2006 amounted to €13.9 billion.
According to an Ernst & Young report, Poland ranks 7th in the World in terms of investment attractiveness. However, Ernst & Young's 2010 European attractiveness survey reported that Poland saw a 52% decrease in FDI job creation and a 42% decrease in number of FDI projects since 2008.[38] According to the OECD (www.oecd.org) report, in 2004 Poles were one of the hardest working nations in Europe. Yet, the ability to establish and conduct business easily has been cause for economic hardship; the 2010 the World Economic Forum ranked Poland near the bottom of OECD countries in terms of the clarity, efficiency and neutrality of the legal framework used by firms to settle disputes.[39]
Sectors
Primary
Agriculture
Agriculture employs 12.7% of the work force but contributes 3.8% to the gross domestic product (GDP), reflecting relatively low productivity. Unlike the industrial sector, Poland's agricultural sector remained largely in private hands during the decades of communist rule. Most of the former state farms are now leased to farmer tenants. Lack of credit is hampering efforts to sell former state farmland. Currently, Poland's 2 million private farms occupy 90% of all farmland and account for roughly the same percentage of total agricultural production. Farms are small—8 hectares on average—and often fragmented. Farms with an area exceeding 15 ha accounted for 9% of the total number of farms but cover 45% of total agricultural area. Over half of all farm households in Poland produce only for their own needs with little, if any, commercial sales.
Poland is a net exporter of processed fruit and vegetables, meat, and dairy products. Processors often rely on imports to supplement domestic supplies of wheat, feed grains, vegetable oil, and protein meals, which are generally insufficient to meet domestic demand. However, Poland is the leading EU producer of potatoes and rye and is one of the world's largest producers of sugar beets and triticale. Poland also is a significant producer of rapeseed, grains, hogs, and cattle. Poland is the largest producer and exporter of apples in the entire world, surpassing China.
Mining
Historically, mining industry in Poland had been extensive, particularly in Silesia.
Secondary
Production industries
Before World War II, Poland's industrial base was concentrated in the coal, textile, chemical, machinery, iron, and steel sectors. Today it extends to fertilizers, petrochemicals, machine tools, electrical machinery, electronics, car manufacture and shipbuilding.
Poland's industrial base suffered greatly during World War II, and many resources were directed toward reconstruction. The socialist economic system imposed in the late 1940s created large and unwieldy economic structures[40] operated under a tight central command. In part because of this systemic rigidity, the economy performed poorly even in comparison with other economies in Central Europe.[40]
In 1990, the Mazowiecki government began a comprehensive reform programme to replace the centralised command economy with a market-oriented system. While the results overall have been impressive, many large state-owned industrial enterprises, particularly the rail, mining, steel, and defence sectors, have remained resistant to change and the downsizing required to survive in a market-based economy.[40]
Energy
Pharmaceutics
The total value of the Polish pharmacy market in 2008 was PLN 24.1bn, 11.5% more than in 2007.
The non-prescription medicines market, which accounts for about one-third of the total market value, was worth PLN 7.5bn in 2008. This value includes drugs and non-drugs such as dietary supplements, cosmetics, dressings, dental materials, diagnostic tests and medical devices. The prescription medicines market was worth PLN 15.8bn.[41]
Tertiary
Financial
The Polish banking sector is regulated by the Polish Financial Supervision Authority (PFSA).
While transforming the country to a market-oriented economy during 1992–97, the government privatized some banks, recapitalized the rest and introduced legal reforms that made the sector competitive. These reforms, and the health and relative stability of the sector, attracted a number of strategic foreign investors. At the beginning of 2009, Poland's banking sector had 51 domestic banks, a network of 578 cooperative banks and 18 branches of foreign-owned banks. In addition, foreign investors had controlling stakes in nearly 40 commercial banks, which made up 68% of the banking capital.[42] Banks in Poland reacted to the financial crisis of 2009 by restraining lending, raising interest rates, and strengthening balance sheets. Subsequently, the sector started lending again, with an increase of more than 4% expected in 2011.
Major Polish companies
Selection from the list of 500 largest companies in Poland compiled by magazine Polityka.[43]
|
|
Currency
Data
Retail sales in Poland[44]
| Year | 2000 | 2001 | 2002 | 2003 | 2004 | 2005 | 2006 | 2007 | 2008 | 2009 | 2010 |
|---|---|---|---|---|---|---|---|---|---|---|---|
| Total retail sales (PLN bn) | 361.8 | 376.5 | 385.3 | 401.4 | 433.5 | 433.3 | 464.5 | 515.7 | 564.7 | 582.8 | 593 |
Investment (gross fixed): 18.4% of GDP (2004 est.)
Household income or consumption by percentage share:
- lowest 10%: 3.2%
- highest 10%: 24.7% (1998)
Distribution of family income – Gini index: 30.6 (2004)
Agriculture – products: potatoes, fruits, vegetables, wheat, poultry, eggs, pork
Industrial production growth rate: 17.8% (2006)
Electricity:
- production: 150.8 TWh (2004)
- consumption: 121.3 TWh (2004)
- exports: 15.2 TWh (2004)
- imports: 5.0 TWh (2004)
Electricity – production by source:
- fossil fuel: 95.1%
- hydro: 4.5%
- other: 0.4% (2001)
- nuclear: 0%
Oil:
- production: 17,180 barrels per day (2,731 m3/d) (2001 est.)
- consumption: 424,100 barrels per day (67,430 m3/d) (2001 est.)
- exports: 53,000 barrels per day (8,400 m3/d) (2001)
- imports: 413,700 barrels per day (65,770 m3/d) (2001)
- proved reserves: 116,400,000 barrels (18,510,000 m3) (1 January 2002)
Natural gas:
- production: 5.471 billion m³ (2001 est.)
- consumption: 13.85 billion m³ (2001 est.)
- exports: 41 million m³ (2001 est.)
- imports: 8.782 billion m³ (2001 est.)
- proved reserves: 154.4 billion m³ (1 January 2002)
Households with access to fixed and mobile telephone access[45]
- landline telephone – 52% (2009)
- mobile telephone – 85% (2009)
Broadband penetration rate[45]
- fixed broadband- 13.5% (2010)
- mobile broadband- 4.3% (2010)
Individuals using computer and internet[45]
- computer – 63% (2009)
- internet – 59% (2009)
Exports – commodities: machinery and transport equipment 37.8%, intermediate manufactured goods 23.7%, miscellaneous manufactured goods 17.1%, food and live animals 7.6% (2003)
Imports – commodities: machinery and transport equipment 38%, intermediate manufactured goods 21%, chemicals 14.8%, minerals, fuels, lubricants, and related materials 9.1% (2003)
Currency exchange rates:
- Złoty per US dollar – 2.96 (Dec 2010),[46] 2.92 (Sep 2010), 2.94 (Apr 2010), 3.25 (Apr 2009), 2.17 (Apr 2008), 2.51 (Nov 2007), 2.66 (Oct 2006) 3.15 (Jun 2006) 3.7 (2004), 3.8891 (2003), 4.08 (2002), 4.0939 (2001), 4.3461 (2000).
- Złoty per Euro – 3.96 (Dec 2010),[46] 3.44 (Apr 2008), 3.64 (Nov 2007), 3.96 (Aug 2006), 4.77 (Jun 2004).
Unemployment:
- July 2008 – 7.3%
- November 2010 – 11.7%[46]
Average gross monthly pay: 3403.07 PLN (~€830) (~$1202) December 2009
Budget and debt
Polish state budget expenditure by division (2008):
| Division | Spending (in mln zl) | % of total budget |
|---|---|---|
| Total | 277,893 | 100 |
| Compulsory social security | 64,050 | 23 |
| Public debt servicing | 25,117 | 9 |
| Social assistance | 18,331 | 6.6 |
| National defence | 13,812 | 5 |
| Public safety and fire care | 12,517 | 4.5 |
| Higher education | 11,091 | 4 |
| Public administration | 10,161 | 3.7 |
| Administration of justice | 9,090 | 3.3 |
| Health care | 6,692 | 2.4 |
| Education | 2,200 | 0.8 |
| Dwelling economy | 1,541 | 0.6 |
| Culture and national heritage | 1,487 | 0.5 |
| Physical education and sport | 0,583 | 0.2 |
| Other (no specific category) | 101,221 | 36.4 |
| Total income (mln zl) | Total expenditure (mln zl) | Total Deficit (mln zl) |
|---|---|---|
| 253,547 | 277,893 | 24,346 |
Source: Concise Statistical Yearbook of Poland (2008/9)
Reserves of foreign exchange & gold: $70.08 billion (2004 est.)
State Treasury Debt – foreign: $55.4 billion (2008 est.)
Current account balance: $−6.7 billion [−1.5% of GDP] (2009 est.)
GDP growth in Poland
Recent GDP growth (comparing to the same quarter of previous year):[47]
| Year | Q1 | Q2 | Q3 | Q4 |
|---|---|---|---|---|
| 2014 | 3.4% | 3.5% | 3.3% | 3.1% |
| 2013 | 0.8% | 1.2% | 1.7% | 2.3% |
| 2012 | 3.6% | 2.2% | 1.6% | 0.8% |
| 2011 | 4.5% | 4.3% | 4.2% | 4.5% |
| 2010 | 3.0% | 3.5% | 4.2% | 4.3% |
| 2009 | 0.8% | 1.2% | 1.8% | 3.3% |
| 2008 | 6.1% | 6.0% | 5.0% | 3.0% |
| 2007 | 7.4% | 6.5% | 6.5% | 6.5% |
| 2006 | 5.4% | 6.3% | 6.6% | 6.6% |
| 2005 | 2.1% | 2.7% | 3.7% | 4.3% |
| 2004 | 7.0% | 6.1% | 4.8% | 4.9% |
| 2003 | 2.2% | 3.8% | 4.7% | 4.7% |
Historical annual data[48]
- Total 1991 −7.0%
- Total 1992 2.6%
- Total 1993 3.8%
- Total 1994 5.2%
- Total 1995 7.0%
- Total 1996 6.2%
- Total 1997 7.1%
- Total 1998 5.0%
- Total 1999 4.5%
- Total 2000 4.3%
- Total 2001 1.2%
- Total 2002 1.4%
- Total 2003 3.9%
- Total 2004 5.3%
- Total 2005 3.6%
- Total 2006 6.2%
- Total 2007 6.8%
- Total 2008 5.1%
- Total 2009 1.7%
- Total 2010 3.9%
- Total 2011 4.3%
- Total 2012 2.0%
- Total 2013 1.6%
See also
External links
- www.paiz.gov.pl
- Attractiveness Europe 2007
- The Polish economy in 2007 on YouTube
- Articles on Polish economy in Central and Eastern European Packaging magazine
- OECD's Poland country Web site and OECD Economic Survey of Poland
- Business Portal for Poland
- World Bank Summary Trade Statistics Poland
- Tariffs applied by Poland as provided by ITC's Market Access Map, an online database of customs tariffs and market requirements.
- International Trade Statistics - Poland (2014)
References
- ↑ 1.0 1.1 "Report for Selected Countries and Subjects". Imf.org. 2006-09-14. Retrieved 2014-06-01.
- ↑ "Wzrost gospodarczy w 2013 roku, w gore o 1.6%. Gazeta Wyborcza.".
- ↑ Bartyzel, Dorota (15 January 2014). "Polish Inflation Accelerates From Five-Month Low on Gas, Alcohol". Bloomberg. Retrieved 3 February 2014.
- ↑ (Polish) http://www.stat.gov.pl/cps/rde/xbcr/gus/PUBL_ls_employment_wages_salaries_2010.pdf
- ↑ "Doing Business in Poland 2014". World Bank. Retrieved 23 March 2015.
- ↑ "Export Partners of Poland". CIA World Factbook. 2012. Retrieved 24 July 2013.
- ↑ "Import Partners of Poland". CIA World Factbook. 2012. Retrieved 24 July 2013.
- ↑ "How Poland Became Europe's Most Dynamic Economy". Businessweek. 2013-11-27. Retrieved 2014-06-01.
- ↑ "Sovereigns rating list". Standard & Poor's. Retrieved 30 July 2011.
- ↑ 10.0 10.1 Rogers, Simon; Sedghi, Ami (15 April 2011). "How Fitch, Moody's and S&P rate each country's credit rating". The Guardian (London). Retrieved 28 May 2011.
- ↑ "Country and Lending Groups | Data". Data.worldbank.org. Retrieved 25 May 2011.
- ↑ Stay informed today and every day (2011-08-27). "Eastern Europe’s economies: Some calm amid storms". The Economist. Retrieved 2014-06-01.
- ↑ "Tapping into Polish Power". Forbes. 24 September 2007.
- ↑ Jarosz, Maria (2005). Wygrani i przegrani polskiej transformacji. Warszawa: Instytut Studiów Politycznych PAN. ISBN 83-7459-000-9.
- ↑ "Report for Selected Countries and Subjects". Imf.org. 14 September 2006. Retrieved 25 May 2011.
- ↑ Michał Zieliński. "Gra w Gierki - WPROST". Wprost.pl. Retrieved 2014-06-01.
- ↑ "The World Factbook". Cia.gov. Retrieved 2014-06-01.
- ↑ 18.0 18.1 18.2 18.3 18.4 18.5 18.6 Faris, Stephen (27 Nov 2013). "How Poland Became Europe's Most Dynamic Economy". Bloomberg BusinessWeek Global Economics. Retrieved 21 May 2014.
- ↑ "Główny Urząd Statystyczny / Obszary tematyczne / Praca. Wynagrodzenia / Bezrobocie. Stopa bezrobocia / Stopa bezrobocia w latach 1990-2014". Stat.gov.pl. Retrieved 2014-06-01.
- ↑ "February 2014: Euro area unemployment rate at 11.9% EU28 at 10.6%" (PDF). Eurostat newsrelease/euroindicators. Eurostat. 1 April 2014. Retrieved 21 May 2014.
- ↑ "Unemployment". Eures.praca.gov.pl. 2004-05-01. Retrieved 2014-06-01.
- ↑ "06 - High unemployment in Poland - not only a labour market problem - Michał Narożny - European Commission". Ec.europa.eu. 2011-02-15. Retrieved 2014-06-01.
- ↑ "Warsaw Business Journal - Online Portal". wbj.pl. 2012-02-13. Retrieved 2014-06-01.
- ↑ 24.0 24.1 24.2 The Debt Crisis in Poland and its impact on society. Study, Gavin Rae Kozminski University
- ↑ "Polska emigracja: ile na tym tracimy, a ile zyskujemy - Jedynka". polskieradio.pl. 2013-12-19. Retrieved 2014-06-01.
- ↑ "EUROPP – After years of above-average growth, Poland now faces the spectre of recession". Blogs.lse.ac.uk. 2013-07-09. Retrieved 2014-06-01.
- ↑ Utknelismy na peryferiach Dziennik Gazeta Prawna nr 246, December 2013
- ↑ "Poland: June 2000". Trade Policy Reviews. World Trade Organization. 26 June 2000. Retrieved 21 May 2014.
- ↑ PAP, 9 May 2013 Polska żywność - fundament polskiego eksportu - 2012 kolejnym rokiem rekordowego eksportu żywności. Ministerstwo Skarbu Państwa (Internet Archive).
- ↑ GUS, Najwięksi partnerzy handlowi Polski: kto kupuje nasze produkty? 9 July 2014 (Internet Archive)
- ↑ Ministerstwo Gospodarki, Polska - kierunki eksportu i najchętniej kupowane produkty z naszego kraju. 8 December 2013 Euro-Dane :: Ekonomia Unii Europejskiej (Internet Archive). Most important importers of Poland's 2012 exports, graph. Manifo.
- ↑ Patrycja Maciejewicz, Leszek Baj, Polska żywność jedzie w świat. Pełno niespodzianek 2012-04-07, Wyborcza.biz (Internet Archive).
- ↑ PAP, Więcej niż 80 proc. eksportu żywności z Polski to przetworzone produkty spożywcze 10-10-2014 Portal Spozywczy.pl (Internet Archive).
- ↑ Wiesław Łopaciuk, Padł rekord wartości eksportu produktów rolno-spożywczych z Polski. Powód: słaby złoty Rzeczpospolita, 27-01-2012 (Internet Archive). "Z analizy "Rzeczpospolitej" wynika, że łączna wartość eksportu produktów rolno-spożywczych Polski mogła w 2011 r. sięgnąć 62 mld zł. W porównaniu z 2010 r. była o niemal 17 proc. wyższa."
- ↑ 35.0 35.1 Ho, Giang (July 2012). "Republic of Poland. Selected Issues." (PDF). IMF Country Report 12 (163).
- ↑ http://www.channelnewsasia.com/news/world/ban-on-food-imports-due/1297280.html
- ↑ UAEinteract.com. "UAE is Poland's largest Arab trading partner". Uaeinteract.com. Retrieved 25 May 2011.
- ↑ Schwab, Klaus. "The Global Competitiveness Report 2010-2011" (PDF). World Economic Forum. Retrieved 25 April 2011.
- ↑ "Waking up to the new economy: Ernst & Young's 2010 European attractiveness survey" (PDF). Ernst & Young. Retrieved 25 April 2011.
- ↑ 40.0 40.1 40.2 "Poland (11/07)". US Department of State. Retrieved 25 September 2013.
- ↑ "Polish pharmaceutical market". Pharmapoland.com. Retrieved 25 May 2011.
- ↑ Wprost (2011-11-09). "Belka: polskie banki znów powinny być polskie" (INTERNET ARCHIVE). 70 proc. polskiego systemu bankowego jest własnościowo zdominowane przez banki zagraniczne. Biznes: Polityka i gospodarka, Wprost.pl. Retrieved 12 November 2014.
w Polsce nie zbudowano by nowoczesnego systemu bankowego [bez akcjonariuszy zagranicznych, stwierdził Prezes NBP. Bez nich] Polska nie uniknęłaby kryzysu bankowego — Marek Belka, prezes Narodowego Banku Polskiego.
- ↑ 43.0 43.1 "500 largest companies in Poland". Lista500.polityka.pl. Polityka. Retrieved 25 May 2011.
- ↑ "Retail in Poland". Retailpoland.com. Retrieved 25 May 2011.
- ↑ 45.0 45.1 45.2 "IT and telecommunications in Central and Eastern Europe". Ceeitandtelecom.com. Retrieved 25 May 2011.
- ↑ 46.0 46.1 46.2 "Polish economy: annual trends". Polishmarket.com. 1 May 2004. Retrieved 25 May 2011.
- ↑ "Quarterly National Accounts : Quarterly Growth Rates of real GDP, change over previous quarter". Stats.oecd.org. Retrieved 2014-06-01.
- ↑ [http://www.stat.gov.pl/cps/rde/xbcr/gus/PUBL_annual_economic_indicators_part_IV.xls
- Total 1990 −11.6% "AnnualData"]. Główny Urząd Statystyczny. Retrieved 15 November 2010.
- Worldmark Encyclopedia of National Economics, Volume 4 – Europe, Gale Group, 2002, ISBN 0-7876-4955-4
- Economic data from Eastern European Markets (ceeMarket.com)
| |||||||||||||||||||||||||||||||||||||||||

| ||||||||||
| ||||||||||||||||||