Economy of Lithuania
| Economy of Lithuania[1] | |
|---|---|
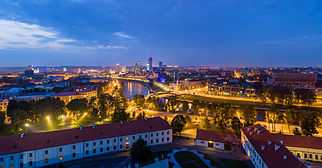 Vilnius' Financial Centre at night | |
| Currency | € 1 Euro (EUR) = 100 cent |
| 1 January – 31 December | |
Trade organisations | EU and WTO |
| Statistics | |
| GDP |
|
| GDP rank | 86th (PPP, 2013 est.) |
GDP growth |
|
GDP per capita |
|
GDP by sector | agriculture 3.3%, industry 28.4%, services 68.4% (2012 est.) |
|
| |
Population below poverty line |
|
Labour force |
|
Labour force by occupation | services 72.5%, industry 19.6%, agriculture 7.9% (2012 est.) |
| Unemployment |
|
Average gross salary | €715/ $800, monthly (2015)[2] |
Average net salary | €554/ $620, monthly (2015)[3] |
Main industries | metal-cutting machine tools, electric motors, television sets, refrigerators and freezers, petroleum refining, shipbuilding (small ships), furniture making, textiles, food processing, fertilizers, agricultural machinery, optical equipment, electronic components, computers, amber jewelry |
| 17th[4] | |
| External | |
| Exports |
|
Export goods | mineral products, machinery and equipment, chemicals, textiles , foodstuffs, plastics |
Main export partners |
|
| Imports |
|
Import goods | mineral products, machinery and equipment, transport equipment, chemicals, textiles and clothing, metals |
Main import partners |
|
FDI stock |
|
Gross external debt |
|
| Public finances | |
| Revenues | $13.4 billion (2015 est.)[7] |
| Expenses | $13.6 billion (2015 est.)[8] |
| Economic aid | EU structural assistance: €2.3 billion (2010 est.), assistance from Switzerland: €9.1 million (2010) |
| |
Foreign reserves |
|
|
All values, unless otherwise stated, are in US dollars. | |
Lithuania is a member of the European Union and the biggest economy among the three Baltic states. GDP per capita reached $17,800 in 2008 and was higher than all of its neighbors – Latvia, Poland, Russia, and Belarus.[12]
GDP per capita in Lithuania is 70% above the world's average of $10,500.[12] Lithuania has a favorable legislative basis for business as the country is ranked the 3rd in the region of Eastern Europe and Central Asia[13] and the 17th in the world by the Ease of Doing Business Index prepared by the World Bank Group.[14] Lithuania is ranked the 22nd out of 177 countries in the Index of Economic Freedom, measured by The Heritage Foundation.[15] According to the Human Development Report 2011, Lithuania belongs to the group of very high human development countries.
Having moved away from central planning, in 1990, Lithuania was the first to break away from the Soviet Union and become an independent capitalist economy. Lithuania soon implemented liberal reforms and became one of the world's fastest growing countries, as GDP growth rate was positive nine years in a row until 2009. It enjoyed high growth rates after joining the European Union along with other Baltic states, leading to the notion of a Baltic Tiger. Current excellent telecommunication infrastructure and well-educated, multilingual workforce give the possibility to provide high-quality business services and produce manufacturing products worldwide.
In 2005 GDP grew by 7.5% and the inflation rate was 3%. GDP growth reached its height in 2007, increasing by 8.9%.[16] Lithuania was the last among the Baltic states to be hit by the economic crisis because its GDP growth rate in 2008 was still positive. In the third quarter of 2009, compared to the previous quarter, GDP grew again by 6.9% after 5 quarters with negative numbers.[17] Rebound in Lithuania's economy in the third quarter was the fastest in the EU.[18] In the last quarter of 2009 Lithuanian economy rose moderately by 0.1%,[19] In 2011 real growth was higher than expected at first and reached 5.9%.[20]
History of economy
The history of Lithuania can be divided into seven major periods. All the periods have some interesting and important facts that had an impact on the economic situation of the country in those times.
- Ancient times – Baltic tribes (until the 13th century)
- Grand Duchy of Lithuania (13th century−1569)
- Polish-Lithuanian Commonwealth (1569–1795)
- Pressure of the Russian Empire (1795–1914)
- Independent Lithuania during the interwar period (1918–1940)
- Lithuanian Soviet Socialist Republic (1944–1990)
- Republic of Lithuania (1990–)
History up to the 20th century
The first Lithuanians were a branch of an ancient ethnic group known as the Balts. The tribes maintained close trade contacts with the Roman Empire. Amber was the main good provided to the Roman Empire from Baltic Sea coast, by a long route called the Amber Road.
Consolidation of the Lithuanian lands began in the late 12th century. Mindaugas, the first Lithuanian ruler, was crowned as Catholic King of Lithuania in 1253. The expansion of the Grand Duchy of Lithuania reached its height in the middle of the 14th century under the Grand Duke Gediminas, who created a strong central government which later spread from the Black Sea to the Baltic Sea. The duchy was open to everyone. Grand Duke Gediminas issued letters to the Hanseatic league, offering free access to his domains to men of every order and profession from nobles and knights to tillers of the soil. Economic immigrants had a positive impact, improving the level of handicrafts.
In 1569, the Polish–Lithuanian Commonwealth was formed by the union of the Kingdom of Poland and the Grand Duchy of Lithuania. The economy of the Commonwealth was dominated by feudal agriculture based on the exploitation of the agricultural workforce (serfs). Poland-Lithuania played a significant role in the supply of 16th century Western Europe by exporting three sorts of goods, notably grain (rye), cattle (oxen) and fur. These three articles amounted to nearly 90% of the country's exports to western markets by overland and maritime trade.
The Commonwealth was famous for Europe's first and the world's second modern codified national constitution, the so-called Constitution of 3 May, declared on 3 May 1791, after the 1788 ratification of the United States Constitution. Economic and commercial reforms, previously shunned as unimportant by the Szlachta, were introduced, and the development of industries was encouraged.
Following the partitions of the Polish-Lithuanian Commonwealth in 1772, 1793 and 1795, the Russian Empire controlled the majority of Lithuania. One of the most important reforms during the pressure of the Russian Empire that affected economic relations was the Emancipation Reform of 1861 in Russia. The reform amounted to the liquidation of serf dependence previously suffered by peasants and boosted the development of capitalism.
Lithuania in the 20th century
On 16 February 1918, the Council of Lithuania passed a resolution for the re-establishment of the Independent State of Lithuania.[21] Soon, many economic reforms for sustainable economic growth were implemented. A national currency, called the Lithuanian litas, was introduced in 1922. It proved to become one of the most stable currencies in Europe during the inter-war period.[21] During the time of its independence, 1918–1940, Lithuania made substantial progress. For example, Lithuania was the second in the world in exporting flax; Lithuanian farm products such as meat, dairy products, many kinds of grain, potatoes, etc. were of superior quality in the world market.[21]
Having taken advantage of favorable international developments, and driven by its foreign policy aims directed against Lithuanian statehood, the Union of Soviet Socialist Republics (USSR) occupied Lithuania in 1940.[22] Land and the most important objects for the economy were nationalized, and most of the farms collectivized.[21] Later, many inefficient factories and industry companies, highly dependent on other regions of USSR, were established in Lithuania. Despite that, in 1990, GDP per capita of the Lithuanian Soviet Socialist Republic was $8,591, which was above the average for the rest of the Soviet Union of $6,871 but lagging behind developed western countries.
The Soviet era brought Lithuania intensive industrialization and economic integration into the USSR, although the level of technology and state concern for environmental, health, and labor issues lagged far behind Western standards.[16] Urbanization increased from 39% in 1959 to 68% in 1989. From 1949 to 1952 the Soviets abolished private ownership in agriculture, establishing collective and state farms. Production declined and did not reach pre-war levels until the early 1960s. The intensification of agricultural production through intense chemical use and mechanization eventually doubled production but created additional ecological problems. This changed after independence, when farm production dropped due to difficulties in restructuring the agricultural sector.[16]
Development since the 1990s
Reforms since the mid-1990s led to an open and rapidly growing economy. Open to global trade and investment, Lithuania now enjoys high degrees of business, fiscal, and financial freedom. Lithuania is a member of the EU and the WTO, so regulation is relatively transparent and efficient, with foreign and domestic capital subject to the same rules. The financial sector is advanced, regionally integrated, and subject to few intrusive regulations.[15]
One of Lithuania's most important reforms was the privatization of state-owned assets. The first stage of privatization was being implemented between 1991 and 1995. Citizens were given investment vouchers worth LTL 10.5 billion ($2.63 billion) in nominal value, which let them participate in assets selling.[23] By October 1995, they were used as follows: 65% for acquisition of shares; 19% for residential dwellings; 5% for agricultural properties; and 7% remained unused.[23] More than 5,700 enterprises with LTL 7 billion ($1.75 billion) worth of state capital in book value were sold using four initial privatization methods: share offerings; auctions; best business plans competitions; and hard currency sales.[23]
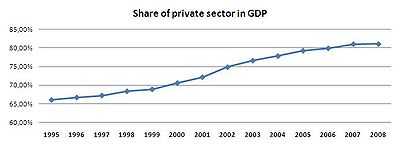
The second privatization step began in 1995 by approving a new law that ensured greater diversity of privatization methods and that enabled participation in the selling process without vouchers. Between 1996 and 1998, 526 entities were sold for more than LTL 2.3 billion ($580 million).[23] Before the reforms, the public sector totally dominated the economy, where as the current share of the private sector in GDP increased to over 80%.[24]
The implementation of the monetary reform was one of the key success factors for the stability of the economy. Lithuania has chosen a currency board system formed and controlled by the Bank of Lithuania that is independent from any government institution. On 25 June 1993, the Lithuanian litas was introduced as a free convertible currency, but on 1 April 1994 it was pegged to the United States dollar at a rate of 4 to 1. The mechanism of the currency board system enabled Lithuania to stabilize inflation rates to single digits. The litas soon became a reliable currency as the litas is fully backed by foreign currency. The stable currency rate helped to establish foreign economic relations, therefore leading to a constant growth of foreign trade.[25]
By 1998, the economy had survived the early years of uncertainty and several setbacks, including a banking crisis, and seemed poised for solid growth. However, the collapse of the Russian ruble in August 1998 shocked the economy into negative growth and forced the reorientation of trade from Russia towards the West.[16]
Lithuania was invited to the Helsinki EU summit in December 1999 to begin EU accession talks in early 2000.[26]
After the Russian financial crisis, the focus of Lithuania's export markets shifted from East to West. In 1997, exports to the Soviet Union's successor entity (the Commonwealth of Independent States) made up 45% of total Lithuanian exports. This share of exports dropped to 21% of the total in 2006, while exports to EU members increased to 63% of the total.[16]
Exports to the United States made up 4.3% of all Lithuania's exports in 2006, and imports from the United States comprised 2% of total imports. Foreign direct investment (FDI) in 2005 was 2.6 billion litas, which represented an increase of only 4.6% compared to the same period in the previous year.
On 2 February 2002 the litas was pegged to the euro at a rate of 3.4528 to 1. The rate is not expected to change until Lithuania becomes a member of the Eurozone. Lithuania was very close to introducing the euro in 2007, but the inflation level was somewhat above the Maastricht requirements.[27] On January 1, 2015, Lithuania became the 19th country to use the euro.[28]
The Vilnius Stock Exchange, now renamed the NASDAQ OMX Vilnius, started its activity in 1993 and was the first stock exchange in the Baltic states. In 2003, the VSE was acquired by OMX. Since 27 February 2008 the Vilnius Stock Exchange has been a member of NASDAQ OMX Group, which is the world's largest exchange company across six continents, with over 3,800 listed companies.[29] The market cap of Vilnius Stock Exchange was LTL 11.7 billion (EUR 3.4 billion) on 27 November 2009 and was twice as large as the ones of Riga and Tallinn Stock Exchanges.[30]
During the last decade (1998–2008) the structure of Lithuania's economy has changed significantly. The biggest changes were recorded in the agricultural sector as the share of total employment decreased from 19.2% in 1998 to just 7.9% in 2008. The service sector plays an increasingly important role. The share of GDP in financial intermediation and real estate sectors was 17% in 2008 compared to 11% in 1998. The share of total employment in the financial sector in 2008 has doubled compared with 1998.[31][32]
| Economic activity | GDP, 1998 | Employment, 1998 | GDP, 2000 | Employment, 2000 | GDP, 2004 | Employment, 2004 | GDP, 2008 | Employment, 2008 |
|---|---|---|---|---|---|---|---|---|
| Trade; hotels and restaurants; transport, storage and communication | 27.3% | 22.6% | 30.2% | 22.8% | 31.7% | 24.7% | 30.1% | 27.5% |
| Industry | 22.8% | 22.1% | 23.8% | 20.8% | 25.8% | 20.1% | 21.5% | 19.6% |
| Public administration; services for social sphere | 21.7% | 25.5% | 21.2% | 27.6% | 18.2% | 26.3% | 17.5% | 26.1% |
| Financial intermediation; real estate | 11.2% | 4.0% | 12.5% | 4.1% | 12.4% | 4.9% | 16.6% | 8.0% |
| Construction | 8.3% | 6.7% | 6.0% | 6.0% | 7.2% | 8.1% | 10.0% | 10.9% |
| Agriculture | 8.7% | 19.2% | 6.3% | 18.7% | 4.7% | 15.8% | 4.4% | 7.9% |
Lithuania in the 21st century

The economy of Lithuania was one of the fastest growing in the world last decade (1998–2008) as GDP growth rate was positive nine years in a row. Since 2000, GDP has almost doubled with a growth rate of 77%.[33]
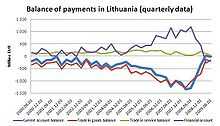
One of the most important factors contributing to Lithuania's economic growth was its accession to the WTO in 2001 and the EU in 2004, which allows free movement of labour, capital, and trade among EU member states. On the other hand, rapid growth caused some imbalances in inflation and balance of payments. The current account deficit to GDP ratio in 2006–2008 was in the double digits and reached its peak in the first quarter of 2008 at a threatening 18.8%.[34] This was mostly due to rapid loan portfolio growth as Scandinavian banks provided cheap credit in Lithuania. The loans directly related to acquisition and development of real estate constituted around half of outstanding bank loans to the private sector.[35] Consumption was affected by credit expansion as well. This led to high inflation of goods and services, as well as trade deficit.
The global credit crunch which started in 2008 affected the real estate and retail sectors. The construction sector shrank by 46.8% during the first three quarters of 2009 and the slump in retail trade was almost 30%.[17][36] GDP plunged by 15.7% in the first nine months of 2009.[17]
Lithuania was the last among the Baltic states to be hit by the economic crisis because its GDP growth rate in 2008 was still positive. In the third quarter of 2009, compared to the previous quarter, GDP again grew by 6.1% after five-quarters with negative numbers.[17] The rebound in Lithuania's economy in the third quarter was the fastest in the EU.[18]
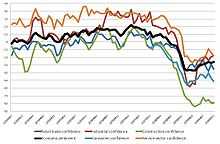
A heavy shock to consumers helped to balance the current account in 2009.[34] Net external assets of the Bank of Lithuania are at a record height of EUR 5.46 billion.[37] Inflation in Lithuania is no longer a problem. Economic sentiment and confidence of all business activities have rebounded from a record low at the beginning of the year 2009 and suggest further improvements in the economy.
Sectors related to domestic consumption and real estate still suffer from the economic crisis, but exporters have started making profits even with lower levels of revenue. The catalysts of growing profit margins are lower raw material prices and staff expense.
Euro adoption
On January 1, 2015, Lithuania became the 19th country to adopt the euro. Despite concerns about joining the Eurozone due to the European debt crisis and changeover costs are estimated at 600 million euros through 2020 (in contributions to the EU budget and costs to commercial lenders), Lithuania stands to benefit from the euro politically and economically because Lithuania has not had an independent monetary policy for the past twenty years because of its currency pegs. Joining the euro would relieve the Bank of Lithuania of defending the value of the litas, and "it would give Lithuania a say in the decision-making of the European Central Bank (ECB), as well as access to the ECB single-resolution fund and cheaper borrowing costs".[28]
Lithuanians have a "marked preference for using cash as opposed to bank cards", which authorities hope will be diminished with the euro's adoption, which would negatively affect its rather large informal economy. According to ECB data, Lithuanians "take twice as much money out in cash as do Estonians or Latvians, and that this cash is mostly used as 'under the counter' money, as interest rates for time deposits in commercial banks are very low".[28]
Business climate
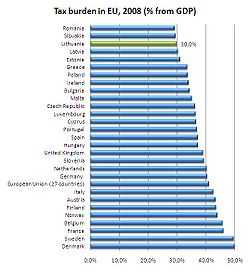
Lithuania attracts foreign investors because of its small tax, skilled workforce, reliable infrastructure, and a larger domestic market than the other two Baltic states combined. Cumulative foreign direct investment (FDI) in 2009 was LTL 31.6 billion (EUR 9.2 billion).[38] The manufacturing sector constituted 28% of total FDI, real estate and business activity sector received 20% of total FDI, and financial intermediation received 19%.[39] Four-fifths of FDI came from the EU countries, with Sweden (17% of total FDI) at the top followed by Germany (10%) and Denmark (9%).[40]
Lithuania seeks to become an innovation hub by 2020. To reach this goal, it is putting its efforts into attracting FDI to added-value sectors, especially IT services, software development, consulting, finance, and logistics.[41] Well-known international companies such as Microsoft, IBM, Transcom, Barclays, Siemens, SEB, TeliaSonera, Paroc, Philip Morris established a presence in Lithuania.
Lithuania has created an attractive business environment for startups, especially with its two free economic zones (FEZ) in Kaunas and Klaipėda. The FEZs offer developed infrastructure, service support, and tax incentives; specifically, a company set up in an FEZ is exempt from corporate taxation for its first six years, as well as a tax on dividends and real estate tax.[42] There are nine industrial sites in Lithuania, which can also provide additional advantages by having a well-developed infrastructure, offering consultancy service and tax incentives.[43]
The transport infrastructure inherited from the Soviet period was adequate and has been generally well maintained since independence.[16] Its single port in Klaipėda is ice-free and supplies ferry services to German, Swedish, and Danish ports. There are a few commercial airports; scheduled international services use the facilities at Vilnius, Kaunas, and Klaipėda. The road system is well developed, including the Via Baltica highway passing through Kaunas.[16]
Border facilities at checkpoints with Poland were significantly improved with the help of EU funds, but long waits were common until 21 December 2007 when the Schengen Agreement came in force in both countries. Telecommunications have improved greatly since independence thanks to heavy investment. There are currently three large companies providing mobile phone services—BITĖ Lietuva, Omnitel, and Tele2.
Workforce
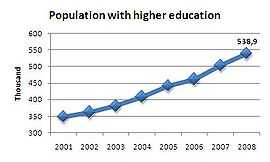

The number of the population aged 15 years and over is 2.85 million, and 1.52 million of them were employed in 2008.[44] The population with higher education was 0.54 million, or more than 35% of employed people.[44] This ratio demonstrates that workforce in Lithuania is one of the best-educated in Central and Eastern Europe (CEE) and is twice the EU-15 average. About 90% of Lithuanians speak at least one foreign language, half speak two foreign languages, and a third speak English.
Lithuania takes the first position in the EU by the number of students in the country. Compared to the EU's average of 15%, only 7% of 18-to-24 year olds in Lithuania are not occupied with studies, the lowest percentage in the EU, announced the European Commission in the end of 2009.[45] School-leavers can choose from 22 universities or 28 colleges for further studies, so 74% of pupils graduated from an upper secondary school continue studies in schools of higher education.[46] Every year more than 30,000 students graduate from universities or colleges, so the population with higher education is gradually increasing.
During the last decade (1998–2008) salaries have more than doubled in Lithuania. Despite this, labour costs in Lithuania are among the lowest in the EU. Average monthly net salary in the third quarter of 2009 was LTL 1,665 (EUR 482) and decreased by 6% compared to the same quarter in 2008.[47] The sharpest annual decrease in hourly labour costs in the EU of −10.9% was observed in Lithuania in the third quarter of 2009.[48] Although Lithuania’s cheap labor helps to make its exports competitive, real wages have grown by 5% in 2014 (compared to 1% growth in the Eurozone), due in part to the 25% minimum wage increase.[28]
Unemployment in Lithuania has been volatile. Since the year 2001, the unemployment rate has decreased from almost 20% to less than 4% in 2007 thanks to two main reasons. Firstly, during the time of rapid economic expansion, numerous work places were established. This caused a decrease in the unemployment rate and a rise in staff expenses. Secondly, emigration has also reduced unemployment problems since accession to the EU. However, the current economic crisis has lowered the need for workers, so the unemployment rate increased to 13.8% and then stabilized in the third quarter of 2009.
Sectors of economy
High value-added production
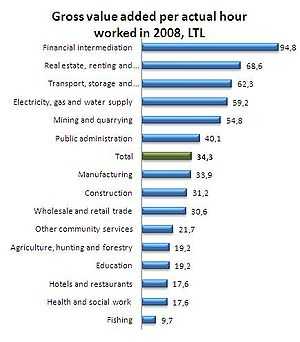
High value-added production is increasing in Lithuania. Several companies produce pharmaceuticals, components for molecular diagnostics, and other sophisticated products in the biotechnology industry. 80% of the production is exported to more than 70 countries.[49] Lithuanian pharmaceutical companies are expanding abroad by acquiring companies in Slovakia and Poland.
Lithuania has over 50% of the world's market for high-energy picosecond lasers, and is a global leader in producing ultra-fast parametric light generators.[50] Lithuanian laser companies were among the first ones in the world to transfer fundamental research into manufacturing. Lithuania's laser producers export laser technologies and devices to nearly 100 countries.
Studies of broadband Internet show that Lithuania has the fastest Internet in the world, and is one of the leading countries in terms of service quality. The broadband speed analysis tool that allows anyone to test their Internet connection Speedtest.net places Lithuania as No. 1 on the list of the world's top countries by upload speed. Lithuania is also on the list of the world's top countries of download speed.[51] Lithuania has one of the highest mobile telephone penetration rates, as well. With a subscription rate of 149 per 100 population, Lithuania is ranked the 8th in the world.[52]
Excellent telecommunication infrastructure and a well-educated, multilingual workforce allows Lithuania to provide high-quality business services worldwide. Business services vary from financial to accounting and reporting services. The share of value added in this sector reaches 13%.[41]
Service sector
The service sector accounts for the largest share of GDP. One of the most important sub-sectors is information and communication technologies (ICT). Around 37,000 employees work for more than 2,000 ICT companies. ICT received 9.5% of total FDI.[51] 11 out of 20 biggest IT companies from Baltic countries are based in Lithuania.[51] Lithuania exported 31% of its IT services in the first quarter of 2009.[53]
Development of shared services and business process outsourcing are some of the most promising fields. Research company Datamonitor forecasted a 60% personnel growth by 2009.[54] Companies that have outsourced their business operations to Lithuania include Barclays, CITCO Group, MIRROR, PricewaterhouseCoopers, Anthill, and Ernst & Young.
Manufacturing
Manufacturing constitutes the biggest part of gross value added in Lithuania. More than 57,000 people were employed in food processing in 2008. The food processing sector constitutes 11% of total exports.[49] Dairy products, especially cheese, are well known in neighbouring countries. Another important manufacturing activity is chemical products. 80% of production is exported so chemical products constitute 12.5% of total exports.[49]
Furniture production employs more than 50,000 people and has seen double-digit growth over the last three years. The biggest companies in this field work in cooperation with IKEA, which owns one of the biggest wood processing companies in Lithuania.[41]
Companies in the automotive and engineering sector are relatively small but offer flexible services for small and non-standard orders at competitive prices. The sector employs about 3% of the working population and receives 5.6% of FDI.[41] Vilnius Gediminas Technical University, the biggest technical university in Baltic countries, prepares experts for the sector.
Financial sector
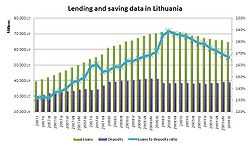
The financial sector concentrates mostly on the domestic market. There are nine commercial banks that hold a license from the Bank of Lithuania and eight foreign bank branches.[55] Most of the banks belong to international corporations, mainly Scandinavian. The financial sector has demonstrated incredible growth in the last decade (1998–2008). Bank assets were only LTL 11.2 billion ($2.8 billion) or 25.5% from GDP in 2000, half of which consisted of loan portfolio.[56]
By the beginning of the year 2009, bank assets grew to LTL 89.7 billion (EUR 26 billion) or 80.8% to GDP, the loan portfolio reached LTL 71.4 billion (EUR 20.7 billion).[57] The loan-to-GDP ratio was 64%. The growth of deposits was not as fast as that of loans. At the end of 2008, the loan portfolio was almost twice as big as that of deposits. It demonstrated high dependence on external financing. Contraction in the loan portfolio has been recorded over the past year, so the loans to deposits ratio are slowly getting back to healthy levels.
Utilities sector
The utilities sector accounts for more than 3% of gross value added in Lithuania. Electricity production exceeded 12 billion kWh in 2007, and consumption exceeded 9.6 billion kWh. Surplus electricity is exported.
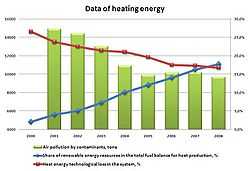
Lithuania had a working nuclear power plant in Visaginas, which had a 72% share in electricity generation.[58] However, the government undertook a commitment to decommission the nuclear power plant by the end of 2009, and the plant was shut down on 31 December 2009. The supply of heating energy has been modernized during the last decade (1998–2008). Technological loss in the heat energy system has decreased significantly from 26.2% in the year 2000 to 16.7% in 2008. The amount of air pollution was reduced by one-third. The share of renewable energy resources in the total fuel balance for heat production increased to almost 20%.
Tourism
Tourism is becoming increasingly important for Lithuania's economy, constituting around 3% of GDP in 2008.[59] Having an untouched ecological countryside with rich natural resources (22,000 rivers and rivulets and 3,000 lakes), a well-developed rural tourism network, a unique coastal area of almost 100 km and four UNESCO World Heritage sites, Lithuania receives more than 2.2 million foreign tourists a year.[60] Poland, Russia, Latvia, and Belarus supply the most tourists, and a significant number arrive from Germany, the UK, Finland, and Italy as well. Kempinski Hotel Cathedral Square near Vilnius Cathedral is regarded as the best hotel in Europe.[61]
Agriculture
Despite a decreased share in GDP, the agricultural sector is still important for Lithuania as it employs almost 8% of the work force and supplies materials for the food processing sector. 44.8% of the land is arable.[62] Total crop area was 1.8 million hectares in 2008.[63] Cereals, wheat, and triticale are the most popular production of farms. The number of livestock and poultry has decreased twofold compared to the 1990s. The number of cattle in Lithuania at the beginning of the year 2009 was 770,000, the number of dairy cows was 395,000, and the number of poultry was 9.1 million.[64]
Lithuanian food consumption has evolved; between 1992 and 2008, consumption of vegetables increased by 30% to 86 kg per capita, and consumption of meat and its products increased by 23% during the same period to 81 kg per capita.[65] On the other hand, consumption of milk and dairy products has decreased to 268 kg per capita by 21%, and the consumption of bread and grain products decreased to 114 kg per capita by 19% as well.[65]
| Economic activity | 2008 |
|---|---|
| Manufacturing | 17.9% |
| Wholesale and retail trade; repair of goods | 16.6% |
| Real estate, renting and business activities | 13.1% |
| Transport, storage and communication | 12.1% |
| Construction | 10.0% |
| Public administration and defense; compulsory social security | 6.7% |
| Education | 4.9% |
| Agriculture, hunting and forestry | 4.3% |
| Financial intermediation | 3.5% |
| Health and social work | 3.3% |
| Electricity, gas and water supply | 3.1% |
| Other community, social and personal service activities | 2.5% |
| Hotels and restaurants | 1.3% |
| Mining and quarrying | 0.4% |
| Activities of households | 0.1% |
| Fishing | 0.1% |
Regional situation

Lithuania is divided into ten counties. There are five cities with a population over 100,000 and twelve cities of over 30,000 people. The gross regional product is concentrated in the three largest counties – Vilnius, Kaunas, and Klaipėda. These three counties account for 70% of the GDP with just 59% of the population.[67] Service centers and industry are concentrated there. In five counties (those of Alytus, Marijampole, Panevėžys, Šiauliai and Tauragė), GDP per capita is still below 80% of the national average.[67]
In order to achieve balanced regional distribution of GDP, nine public industrial parks (Akmene Industrial Park, Alytus Industrial Park, Kedainiai Industrial Park, Marijampole Industrial Park, Pagegiai Industrial Park, Panevzys Industrial Park, Radviliskis Industrial Park, Ramygala Industrial Park and Šiauliai Industrial Park) and three private industrial parks (Tauragė Private Industrial Park, Sitkunai Private Industrial Park, Ramučiai Private Logistic and Industrial Park) were established to provide some tax incentives and prepared physical infrastructure.[43]
While the growth in the 1990s was largely constrained to the cities of Vilnius and Klaipėda, in the 2000s the situation changed. Babilonas real estate development, the largest in the Baltic States by land area, was conceived in the fifth-largest city Panevėžys in 2004. In years 2006 – 2008 the large-scale development also reached cities of Kaunas and Šiauliai and some smaller towns.
Infrastructure
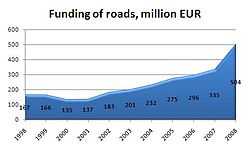
The transport, storage, and communication sector has increased its importance to the economy of Lithuania. In 2008, it accounted for 12.1% of GDP compared to 9.1% in 1996.[66] Lithuania became a well-developed transport corridor between the East and the West. Having a dense, high-quality road network, Lithuania has achieved significant growth in goods carried both by road and by rail transport. The volume of goods transported by road transport has increased fivefold since 1996. The total length of roadways is more than 80,000 km, and 90% of them are paved.[62] The government is demonstrating high attention to the quality of road infrastructure by increasing funding, which exceeded LTL 1.75 billion (EUR 0.5 billion) in 2008.
Railways
Railway transport in Lithuania provides long-distance passenger and cargo services. Railways carry approximately 50 million tons of cargo and 7 million passengers a year.[68] Direct rail routes link Lithuania with Russia, Belarus, Latvia, Poland, and Germany. Also, the main transit route between Russia and Russia's Kaliningrad Region passes through Lithuania. JSC Lithuanian Railways transports about 44% of the freight carried through Lithuania.[69] This is a very high indicator compared to other EU countries, where freight transportation by rail amounts to only 10% of the total.[70]
Seaport
The northern-most and one of the few ice-free seaports on the eastern shore of the Baltic Sea is located in the western part of Lithuania. The Port of Klaipėda is a regional transport hub connecting the sea, land and railway routes from east and west. Compared to neighbouring seaports, the Port of Klaipėda has the widest shipping line network with other seaports.[68] It handles roughly 7,000 ships and 30 million tons of cargo every year, and accepts large-tonnage vessels (dry-cargo vessels up to 70,000 DWT, tankers up to 100,000 DWT and cruise ships up to 270 meters long). The ice-free seaport of Klaipėda is able to receive Panamax-type vessels.[68] One of the fastest growing segments of sea transport is passenger traffic, which has increased fourfold since 2002.
Warehousing
There are more than 600,000 m2 of modern logistics and warehousing facilities in Lithuania.[71] The biggest supply of new, modern warehousing facilities is in the capital city Vilnius (after the completion of several new projects in the third quarter of 2009, the supply of modern warehousing premises has increased by nearly 12% in Vilnius and currently reaches 334,400 m2 of the rentable area). Kaunas is in the second place (around 200,000 m2), and Klaipėda in the third (122,500 m2).[68] Since the beginning of the year 2009, prices for warehousing premises have dropped by 20–25% in Vilnius, Kaunas, and Klaipėda, and the current level of rents has reached the level of 2003.[71] The costs for renting new warehouses in Vilnius, Kaunas, and Klaipėda are similar and reach 2.6 to 4.9 LTL/m2 (0.75 to 1.42 EUR/m2), while the rents of old warehouses are 1.2 to 2.3 LTL/m2 (0.35 to 0.67 EUR/m2).
International trade
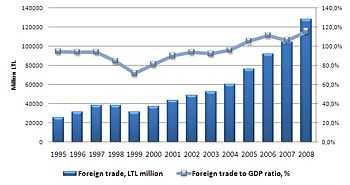
International trade for such a small country as Lithuania is crucial. The ratio of foreign trade to GDP has always been at least 100%, and for the last several years exceeded it.
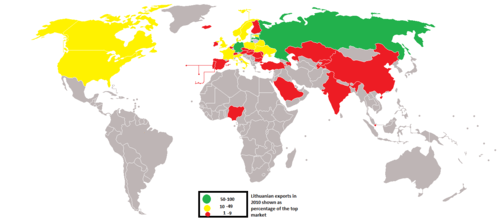
The EU is the biggest trade partner of Lithuania with a 58% of total imports and 64% of total exports during the first ten months of the year 2009.[72] The Commonwealth of Independent States is the second economic union that Lithuania trades the most with, with a share of imports of 34% and a share of exports of 23% during the same period.[72] The vast majority of commodities, including oil, gas, and metals have to be imported, mainly from Russia. For this reason, Russia is the biggest import partner of Lithuania.
The import of mineral products has a significant share of 30%, as Lithuania has an oil refinery company owned by Polish concern PKN ORLEN, ORLEN Lietuva, with a refining capacity of 9 million tons a year.[73] The revenues of the company were more than LTL 17 billion (EUR 4.9 billion) in 2008.[73] Orlen Lietuva received 78% of its sales or LTL 13.7 billion (EUR 4 billion) from foreign markets[73] in comparison with total export of Lithuania of LTL 55.5 billion (EUR 16.1 billion) in 2008.[74]
Some sectors are directed mainly at export markets. Transport and logistics export 2/3 of their products and/or services; the biotechnology industry exports 80%; plastics export 52%; laser technologies export 86%; metal processing, machinery and electric equipment export 64%; furniture and wood processing export 55%; textile and clothing export 76%; and the food industry exports 36%.[75]
The total value of natural resources in Lithuania reaches LTL 58 billion (EUR 16.8 billion) or 50% of Lithuania's GDP in 2008. The most valuable natural resource in Lithuania is subterranean water, which constitutes more than a half of the total value of natural resources.
| Country | Import | Country | Export |
|---|---|---|---|
| |
60.32% | |
55.46% |
| |
28.11% | |
19.83% |
| |
10.50% | |
9.95% |
| |
9.53% | |
7.40% |
| |
6.22% | |
7.17% |
| |
5.26% | |
5.59% |
| |
4.12% | |
5.19% |
| |
3.28% | |
4.92% |
| |
3.22% | |
4.39% |
| |
2.91% | |
3.45% |
| |
2.80% | |
3.28% |
| |
2.77% | |
2.77% |
| |
2.36% | |
2.33% |
| Combined Nomenclature | Export | Combined Nomenclature | Import |
|---|---|---|---|
| Mineral products | 21.6% | Mineral products | 29.7% |
| Machinery and mechanical appliances; electrical equipment | 9.8% | Machinery and mechanical appliances; electrical equipment | 12.6% |
| Products of the chemical industries | 9.3% | Products of the chemical industries | 12.4% |
| Prepared foodstuffs; beverages and tobacco | 7.1% | Vehicles and transport equipment | 6.4% |
| Plastics; rubber and articles thereof | 6.9% | Prepared foodstuffs; beverages and tobacco | 5.9% |
| Textiles and textile articles | 6.7% | Textiles and textile articles | 5.2% |
| Vehicles and transport equipment | 6.6% | Base metals and articles of base metal | 5.0% |
| Miscellaneous manufactured articles | 6.4% | Plastics; rubber and articles thereof | 4.6% |
| Vegetable products | 6.3% | Vegetable products | 4.3% |
| Live animals; animal products | 5.7% | Live animals; animal products | 3.6% |
See also
- Lithuania's Department of Statistics
- Public Organization "Invest Lithuania"
- Investing in Lithuania
- Economy of Europe
- Lithuania
References
- ↑ "Statistikos departamentas". Stat.gov.lt. Retrieved 2010-04-03.
- ↑ http://osp.stat.gov.lt/web/guest/statistiniu-rodikliu-analize?portletFormName=visualization&hash=891cc852-1170-47ef-b1a0-750c476bf42c
- ↑ http://osp.stat.gov.lt/web/guest/statistiniu-rodikliu-analize?portletFormName=visualization&hash=891cc852-1170-47ef-b1a0-750c476bf42c
- ↑ "Doing Business in Lithuania 2013" (PDF). World Bank. Retrieved 2013-11-26.
- ↑ "Export Partners of Lithuania". CIA World Factbook. 2012. Retrieved 2013-07-24.
- ↑ "Import Partners of Lithuania". CIA World Factbook. 2012. Retrieved 2013-07-24.
- ↑ http://vz.lt/article/2015/4/21/lietuvos-biudzeto-deficitas-maziausias-es-bet-estai-mus-lenkia
- ↑ http://vz.lt/article/2015/4/21/lietuvos-biudzeto-deficitas-maziausias-es-bet-estai-mus-lenkia
- ↑ "Sovereigns rating list". Standard & Poor's. Retrieved 11 April 2014.
- ↑ 10.0 10.1 10.2 Rogers, Simon; Sedghi, Ami (15 April 2011). "How Fitch, Moody's and S&P rate each country's credit rating". The Guardian. Retrieved 31 May 2011.
- ↑ Vilniaus Verslo Uostas - English (English)
- ↑ 12.0 12.1 CIA World Factbook
- ↑ "Rankings – Doing Business – The World Bank Group". Doing Business. Retrieved 2010-04-03.
- ↑ "Rankings – Doing Business – The World Bank Group". Doing Business. Retrieved 2014-04-09.
- ↑ 15.0 15.1 "Lithuania information on economic freedom | Facts, data, analysis, charts and more". Heritage Foundation. Retrieved 2010-04-03.
- ↑ 16.0 16.1 16.2 16.3 16.4 16.5 16.6 "Background Note: Lithuania". U.S. Department of State. Retrieved 2009-10-19.
- ↑ 17.0 17.1 17.2 17.3 "Statistics Lithuania". Stat.gov.lt. 28 December 2009. Retrieved 2010-04-03.
- ↑ 18.0 18.1 http://epp.eurostat.ec.europa.eu/cache/ITY_PUBLIC/2-13112009-AP/EN/2-13112009-AP-EN.PDF
- ↑ "Statistics Lithuania". Stat.gov.lt. Retrieved 2010-04-03.
- ↑ "Doing Business in Lithuania 2013". World Bank. Retrieved 2012-10-22.
- ↑ 21.0 21.1 21.2 21.3 "Welcome to the Lithuanian Global Genealogical Society". Lithuaniangenealogy.org. Retrieved 2010-04-03.
- ↑ "Lithuania – Official Gateway to Lithuania – History". Lietuva.lt. Retrieved 2010-04-03.
- ↑ 23.0 23.1 23.2 23.3
- ↑ "Gross value added share by economic sector, year – Database of Indicators – data and statistics". Db1.stat.gov.lt. 4 March 2010. Retrieved 2010-04-03.
- ↑ "Foreign trade | Statistics Lithuania". Stat.gov.lt. Retrieved 2010-04-03.
- ↑ General Report 1999 (en): – Chapter V: Enlarg
- ↑ "Pradžia". Infolex.Lt. Retrieved 2010-04-03.
- ↑ 28.0 28.1 28.2 28.3 Giovanna Maria Dora Dore (January 28, 2015). "Hopping on a Sinking Ship?". The American Interest.
- ↑ "NASDAQ OMX Baltic". NASDAQ OMX Baltic. Retrieved 2010-04-03.
- ↑ [http://www.nasdaqomxbaltic.com/market/?pg=capital¤cy=EUR&market=XVSE&stocktype[]=main&stocktype[]=free&period=day&start_d=26&start_m=11&start_y=2009&end_d=27&end_m=11&end_y=2009 "Turukapitalisatsioon"]. Aktsiad, Vabaturg, Vilniuse börs. 26 November 2009.
- ↑ 31.0 31.1 Structure of gross value added by kind of economic activity and year
- ↑ "Rodiklių duomenų bazė". Db1.stat.gov.lt. Retrieved 2010-04-03.
- ↑ Gross domestic product by statistical indicators and year
- ↑ 34.0 34.1 "Bank of Lithuania : Statistics". Lb.lt. Retrieved 2010-04-03.
- ↑ "Download Attachment" (PDF). Finansai123.googlepages.com. Retrieved 2010-04-03.
- ↑ "Statistics Lithuania". Stat.gov.lt. Retrieved 2010-04-03.
- ↑ "Bank of Lithuania: Statistics". Bank of Lithuania. Retrieved 2010-04-03.
- ↑ "Foreign direct investment at the beginning of the year by administrative territory, statistical indicator and year", Statistics Lithuania
- ↑ "Foreign direct investment at the beginning of the year by kind of economic activity, statistical indicator and year", Statistics Lithuania
- ↑ "Foreign direct investment at the beginning of the year by country", Statistics Lithuania
- ↑ 41.0 41.1 41.2 41.3 http://www.lepa.lt/files/File/Media&Promotion/Library/ERNST/eyldafdiphase1and2v100209_eu.pdf
- ↑ "Free Economic Zones With Tax Benefits And One-Stop-Shop Services". InvestLithuania.com. Retrieved 2010-04-03.
- ↑ 43.0 43.1 "Industrial Parks". InvestLithuania.com. Retrieved 2010-04-03.
- ↑ 44.0 44.1 "Population aged 15 years and over, employed and unempoyed by sex, education, statistical indicator and year"
- ↑ "Lithuanians Are Very Eager to Learn Europeans". Lda.lt. 16 December 2009. Retrieved 2010-04-03.
- ↑ http://www.smm.lt/svietimo_bukle/docs/statistika/LSM_2008.pdf
- ↑ "Statistics Lithuania". Stat.gov.lt. Retrieved 2010-04-03.
- ↑ "Sharpest Decrease in Hourly Labour Costs Recorded in Lithuania". Lda.lt. 21 December 2009. Retrieved 2010-04-03.
- ↑ 49.0 49.1 49.2 "Lietuvos tiesioginių užsienio investicijų pritraukimo ir eksporto skatinimo strategija". Lepa.lt. Retrieved 2010-04-03.
- ↑ AB Sanitas. Interim condensed consolidated and company’s financial statements, 31 December 2008
- ↑ 51.0 51.1 51.2 "ICT". Lepa.lt. Retrieved 2010-04-03.
- ↑ http://www.weforum.org/pdf/GCR09/GCR20092010fullreport.pdf
- ↑ Baltic ICT Market News, November 2009
- ↑ http://www.lepa.lt/files/File/Discover%20Lithuania/Attractive%20Business%20Sectors/2008/printer_friendly/shared%20services%20and%20outsourcing%20in%20lithuania.pdf
- ↑ "Bank of Lithuania". Lb.lt. 18 March 2010. Retrieved 2010-04-03.
- ↑ "Bank of Lithuania". Lb.lt. Retrieved 2010-04-03.
- ↑ "Bank of Lithuania". Lb.lt. Retrieved 2010-04-03.
- ↑ "Nuclear energy – Visaginas Nuclear Power Plant Project". Vae.lt. Retrieved 2010-04-03.
- ↑ "Tourism". Lepa.lt. Retrieved 2010-04-03.
- ↑ http://www.lepa.lt/files/File/Discover%20Lithuania/Attractive%20Business%20Sectors/2008/overview/tourism%20in%20lt.pdf
- ↑ Kempinski hotel named the best in Europe, delfi.lt (Lithuanian)
- ↑ 62.0 62.1 CIA World Factbook
- ↑ "Farm crops in the country by kind, type of farm – Database of Indicators – data and statistics". Db1.stat.gov.lt. Retrieved 2010-04-03.
- ↑ "Number of livestock and poultry by kind, period – Database of Indicators – data and statistics". Db1.stat.gov.lt. Retrieved 2010-04-03.
- ↑ 65.0 65.1 "Consumption of main foodstuffs per capita by product – Database of Indicators – data and statistics". Db1.stat.gov.lt. Retrieved 2010-04-03.
- ↑ 66.0 66.1 "Structure of gross value added by kind of economic activity (31), year – Database of Indicators – data and statistics". Db1.stat.gov.lt. Retrieved 2010-04-03.
- ↑ 67.0 67.1 "Statistics Lithuania". Stat.gov.lt. Retrieved 2010-04-03.
- ↑ 68.0 68.1 68.2 68.3 "Excellent Infrastructure". Lepa.lt. 21 December 2007. Retrieved 2010-04-03.
- ↑ "Lietuvos geležinkeliai". Litrail.lt. Retrieved 2010-04-03.
- ↑ "Lietuvos geležinkeliai". Litrail.lt. Retrieved 2010-04-03.
- ↑ 71.0 71.1 http://www.ober-haus.lt/files/OH_Lithuania_Commercial_Q3_2009.pdf
- ↑ 72.0 72.1 "Exports, imports by country | Statistics Lithuania". Stat.gov.lt. Retrieved 2010-04-03.
- ↑ 73.0 73.1 73.2 http://www.orlenlietuva.lt/repository/pdf/reports/AnnualReport2008.pdf
- ↑ "Exports, imports by country | Statistics Lithuania". Stat.gov.lt. Retrieved 2010-04-03.
- ↑ http://www.lda.lt/files/File/Discover%20Lithuania/BussinessPresentation/20090220/lithuaniagoforbusiness200902.pdf
- ↑ "Export and import by country" (PDF). Statistics departament. Retrieved 17 January 2014.
- ↑ "Exports and imports by CN section | Statistics Lithuania". Stat.gov.lt. Retrieved 2010-04-03.
| |||||||||||||||||||||||||||||||||||||||||||||||||||||||||||
| ||||||||
| ||||||||||||||||||
![]() This article incorporates public domain material from the United States Department of State document "Background Note: Lithuania" by Bureau of European and Eurasian Affairs (retrieved on 2009-10-17).
This article incorporates public domain material from the United States Department of State document "Background Note: Lithuania" by Bureau of European and Eurasian Affairs (retrieved on 2009-10-17).