Economy of Croatia
| Economy of Croatia | |
|---|---|
 | |
| Currency | Croatian kuna (HRK, kn) |
| Calendar year | |
Trade organisations | EU, WTO |
| Statistics | |
| GDP |
$57.283 billion (2013 nominal) $77.9 billion (2013 PPP) |
| GDP rank | 73rd (nominal) / 82nd (PPP) |
GDP growth |
|
GDP per capita |
|
GDP by sector | agriculture: 4.7%; industry: 33.1%; services: 62.2% (2012 est.) |
GDP by component |
Private consumption (52.3%) Public consumption (18.7%) Investments (32.8%) Export (50.4%) Import (54.2%) (2007) |
| 0.1% (2015 Mar) [3] | |
Population below poverty line | 18% (2012) |
| 0.31 (2012) | |
Labour force | 1.677,819 million (2013 ) |
Labour force by occupation | agriculture: 2.1%; industry: 29.0%; services: 69.0% (2012) |
| Unemployment |
|
Average gross salary | 8,067 HRK / 1151 $, monthly (December 2014)[4] |
Average net salary | 5,716 HRK / 815 $, monthly (December 2014)[4] |
Main industries | chemicals and plastics, machine tools, fabricated metal, electronics, pig iron and rolled steel products, aluminium, paper, wood products, construction materials, textiles, shipbuilding, petroleum and petroleum refining, food and beverages, tourism |
|
| |
| External | |
| Exports |
|
Export goods | transport equipment, machinery, textiles, chemicals, foodstuffs, fuels |
Main export partners |
|
| Imports |
|
Import goods | machinery, transport and electrical equipment; chemicals, fuels and lubricants; foodstuffs |
Main import partners |
|
FDI stock |
|
Gross external debt |
|
| Public finances | |
|
| |
| Revenues | $20.12 billion (2014 Budget)[9] |
| Expenses | $2 billion (2014 Budget)[9] |
| Economic aid | EUR179.5 million (0.12% of GNI) (2007) |
| BB+ (Domestic) BB (Foreign) (December 14') [10] | |
Foreign reserves |
|
Economy of Croatia is a service-based economy with the tertiary sector accounting for 70% of total gross domestic product (GDP). After the collapse of socialism, Croatia went through a process of transition to a market-based economy in the 1990s, but its economy suffered badly during the 1991-95 war. After the war the economy began to improve, before the financial crisis of 2007–08 the Croatian economy grew at a healthy 4-5% annually, incomes doubled, and economic and social opportunities dramatically improved. Croatian economy was badly affected by the financial crisis, and contracted by 6.9% in 2009, 1.4% in 2010, then showed signs of recovery in 2011 with 0.0% real GDP growth, but contracted again in 2012 by 1.8%.
Croatia joined NATO in 2009 and became a member of the European Union on 1 July 2013. The prolonged crisis, together with slow progress of economic reforms, is testing this progress, as well as Croatia’s aspirations, as the country has now entered its sixth year of recession. Estimate is that Croatia's real GDP contracted by 0.6% in 2014. The recession is set to end in 2015 with a real GDP growth at 0%, which will gradually rise to 1.0% in 2016 and 1.8% in 2018. The general government deficit will remain at 4.9% of GDP in 2015, before gradually shrinking to 3.0% by 2018.
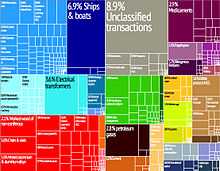
The industrial sector with exports of over €1 billion annually is dominated by shipbuilding which accounts for over 10% of exported goods. Food processing and chemical industry also account for significant portions of industrial output and exports. Industrial sector represents 27% of Croatia’s total economic output while agriculture represents 6%. Industrial sector is responsible for 25% of Croatia's GDP, with agriculture, forestry and fishing accounting for the remaining 5% of Croatian GDP.
Tourism is traditionally a notable source of income, particularly during the summer months, but also more recently during the winter months as well, due to an increase in popularity of snow sports such as skiing. With over 10 million foreign tourists annually, tourism generates revenue in excess of €7 billion. Croatia is ranked among the top 20 most popular tourist destinations in the world, and was voted world's top tourism destination in 2005 by Lonely Planet.[12]
Trade plays a major role in Croatian economic output. In 2007 Croatia's exports were valued at USD 12.84 billion (24.7 billion including service exports). According to Healy Consultants, trade in Croatia is bolstered by its low trade-weighted average tariff of just 1.2%.[13] Croatia has a stable market economy accompanied by a strong and stable currency, the Kuna.
History
Pre-1990
During the 19th century the Kingdom of Croatia had a high ratio of population working in agriculture. Many industrial branches developed in that time, like forestry and wood industry (stave fabrication, the production of potash, lumber mills, shipbuilding). The most profitable one was stave stave fabrication, the boom of which started in the 1820s with the clearing of the oak forests around Karlovac and Sisak and again in the 1850s with the marshy oak masses along the Sava and Drava rivers. Shipbuilding in Croatia played a huge role in the 1850s Austrian Empire, especially the longe-range sailing boats. Sisak and Vukovar were the centres of river-shipbuilding.[14] Slavonia was also mostly an agricultural land and it was known for its silk profuction. Agriculture and the breeding of cattle were the most profitable occupations of the inhabitants. It produced corn of all kinds, hemp, flax, tobacco, and great quantities of liquorice.[15][16]
In 1910 8,5% of the population lived in urban settlements. The slow rate of modernization before the World War 1 caused extensive emigration. According to estimates, roughly 400,000 Croats emigrated from Austria-Hungary between 1880 and 1914. In 1918 Croatia became part of the Kingdom of Yugoslavia, which was in the interwar period one of the least developed countries in Europe. Pre-1945 industrialization was slow and centered on textile mills, sawmills, brick yards and food-processing plants. Economy was stil traditionally based on agriculture and raising of livestock, while peasants accounted for more than half of Croatia's population.[17]
In 1941 the Independent State of Croatia (NDH), a World War II puppet state of Germany and Italy, was established in parts of Axis-occupied Yugoslavia. The economic system of NDH was based on the concept of "Croatian socialism".[18] The main characteristic of the new system was the concept of a planned economy with high levels of state involvement in economic life. The fulfillment of basic economic interests was primarily ensured with measures of repression.[19] All large companies were placed under state control and the property of the regime's national enemies was nationalized. Its currency was the NDH kuna. The Croatian State Bank was the central bank, responsible for issuing currency. As the war progressed the government kept printing more money and its amount in circulation was rapidly increasing, resulting in high inflation rates.[20] NDH inherited 42% of Yugoslavia's debt to Germany and the total debt of NDH on clearing accounts at the end of 1944 amounted to 969,8 million kunas.[21]
After the World War II, the new Communist Party of Yugoslavia resorted to a command economy on the Soviet model of rapid industrial development. By 1948 almost all domestic and foreign-owned capital had been nationalized. The industrialization plan relied on high taxation, fixed prices, war reparations, Soviet credits, and export of food and raw materials. Forced collectivization of agriculture was initiated in 1949. At that time 94% of agricultural land was privately owned, and by 1950 96% was under the control of the social sector. A rapid improvement of food production and the standard of living was expected, but due to bad results the program was abandoned three years later.[17]
Throughout the 1950s Croatia experienced rapid industrialization and urbanization. Decentralization came in 1965 and spurred growth of several sectors including the prosperous tourist industry. SR Croatia was, after SR Slovenia, the second most developed republic in Yugoslavia with a 25% higher GDP per capita than the Yugoslav average. Croatia and Slovenia accounted for nearly half of the total Yugoslav GDP, and this was reflected in the overall standard of living. In the mid-1960s, Yugoslavia lifted emigration restrictions and the number of emigrants increased rapidly. In 1971 224,722 workers from Croatia were employed abroad, mostly in West Germany.[22][23] Foreign remittances contributed $2 billion annually to the economy by 1990.[24] Profits gained through Croatia's industry were used to develop poor regions in other parts of former Yugoslavia, leading to Croatia contributing much more to the federal Yugoslav economy than it gained in return. This, coupled with austerity programs and hyperinflation in the 1980s, led to discontent in both Croatia and Slovenia which eventually fuelled political movements calling for independence.[25]
Transition and war years

In the late 1980s and early 1990s, with the collapse of socialism and the beginning of economic transition, Croatia faced considerable economic problems stemming from:[26]
- the legacy of longtime communist mismanagement of the economy;
- damage during the internecine fighting to bridges, factories, power lines, buildings, and houses;
- the large refugee and displaced population, both Croatian and Bosnian;
- the disruption of economic ties; and
- mishandled privatization
At the time Croatia gained independence, its economy (and the whole Yugoslavian economy) was in the middle of recession. Privatization under the new government had barely begun when war broke out in 1991. As a result of the Croatian War of Independence, infrastructure sustained massive damage in the period 1991-92, especially the revenue-rich tourism industry. Privatization in Croatia and transformation from a planned economy to a market economy was thus slow and unsteady, largely as a result of public mistrust when many state-owned companies were sold to politically well-connected at below-market prices. With the end of the war, Croatia's economy recovered moderately, but corruption, cronyism, and a general lack of transparency stymied economic reforms and foreign investment.[25][27] The privatization of large government-owned companies was practically halted during the war and in the years immediately following the conclusion of peace. As of 2000, roughly 70% of Croatia's major companies were still state-owned, including water, electricity, oil, transportation, telecommunications, and tourism.[28]
Early 1990s were characterized with high inflation rates. In 1991 the Croatian dinar was introduced as a transitional currency, but inflation continued to accelerate. The anti-inflationary stabilization steps in 1993 decreased retail price inflation from a monthly rate of 38,7% to 1,4%, and by the end of the year Croatia experienced deflation. In 1994 Croatia introduced the kuna as its currency.[27]
As a result of the macro-stabilization programs, the negative growth of GDP during the early 1990s stopped and turned into a positive trend. Post-war reconstruction activity provided another impetus to growth. Consumer spending and private sector investments, both of which were postponed during the war, contributed to the growth in 1995-1997.[27] Croatia began its independence with a relatively low external debt because the debt of Yugoslavia was not shared among its former republics at the beginning. In March 1995 Croatia agreed with the Paris Club of creditor governments and took 28,5% of Yugoslavia's previously non-allocated debt over 14 years. In July 1996 an agreement was reached with the London Club of commercial creditors, when Croatia took 29,5% of Yugoslavia's debt to commercial banks. In 1997 around 60 percent of Croatia's external debt was inherited from former Yugoslavia.[29]
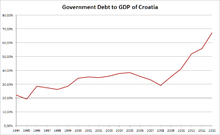
At the beginning of 1998 value-added tax was introduced. The central government budget was in surplus in that year, most of which was used to repay foreign debt.[30] Government debt to GDP had fallen from 27,30% to 26,20% at the end of 1998. However, the consumer boom was distrupted in mid 1998, as a result of the bank crisis when 14 banks went bankrupt.[27] Unemployment increased and GDP growth slowed down to 1,9%. The recession that began at the end of 1998 continued through most of 1999, and after a period of expansion GDP in 1999 had a negative growth of -0,9%.[31] In 1999 the government tightened its fiscal policy and revised the budget with a 7% cut in spending.[32]
In 1999 the private sector share in GDP reached 60%, which was significantly lower than in other former socialist countries. After several years of successful macroeconomic stabilization policies, low inflation and a stable currency, economists warned that the lack of fiscal changes and the expanding role of the state in economy caused the decline in the late 1990s and were preventing a sustainable economic growth.[29][32]
| Year | GDP Growth | Deficit/Surplus* | Debt to GDP | Privatization revenues* |
|---|---|---|---|---|
| 1994 | 5,9% | 1,8% | 22,20% | |
| 1995 | 6,8% | -0,7% | 19,30% | 0,9% |
| 1996 | 5,9% | -0,4% | 28,50% | 1,4% |
| 1997 | 6,6% | -1,2% | 27,30% | 2,0% |
| 1998 | 1,9% | 0,5% | 26,20% | 3,6% |
| 1999 | -0,9% | -2,2% | 28,50% | 8,2% |
| 2000 | 3,8% | -5,0% | 34,30% | 10,2% |
| 2001 | 3,4% | -3,2% | 35,20% | 13,5% |
| 2002 | 5,2% | -2,6% | 34,80% | 15,8% |
| *Including capital revenues *cumulative, in % of GDP | ||||
Economy since 2000

The new government led by the president of SDP, Ivica Račan, carried out a number of structural reforms after it won the parliamentary elections on 3 January 2000. The country emerged from the recession in the 4th quarter of 1999 and growth picked up in 2000.[33] Due to overall increase in stability, the economic rating of the country improved and interest rates dropped. Economic growth in the 2000s was stimulated by a credit boom led by newly privatized banks, capital investment, especially in road construction, a rebound in tourism and credit-driven consumer spending. Inflation remained tame and the currency, the kuna, stable.[25][34]
In 2000 Croatia generated 5,899 billion kunas in total income from the shipduilding sector, which employed 13,592 people. Total exports in 2001 amounted to $4,659,286,000, of which 54,7% went to the countries of the EU. Croatia's total imports were $9,043,699,000, 56% of which originated from the EU.[35]
Unemployment reached its peak in late 2002, but has since been steadily declining. In late 2003 the new government led by HDZ took over the office. Unemployment continued falling, powered by growing industrial production and rising GDP, rather than only seasonal changes from tourism, until the global crisis of 2008. During this time, Croatia focused more on empowering the economy by taking loans from foreign resources.[36] In 2003, the nation's economy would officially recover to the amount of GDP it had in 1990.[36] Between the years 2003 and 2007, Croatia’s private-sector share of GDP increased from 60% to 70%[37]
Most economic indicators remained positive in this period, except for the external debt.[36] The Croatian National Bank had to take steps to curb further growth of indebtedness of local banks with foreign banks. The dollar debt figure is quite adversely affected by the EUR/USD ratio — over a third of the increase in debt since 2002 is due to currency value changes.
2009 – present
Growth has been hurt by the global financial crisis and overreliance on tourism.[38] Since the global crisis hit the country in 2009, the unemployment has been steadily rising, resulting in the loss of more than 100,000 jobs.[39] While the unemployment was 9.6% in the late 2007,[40] as of January 2014 it peaked at 22.4%.[3] Gini coefficient is 0,32.[41] As of September 2012, Fitch ratings agency unexpectedly improved Croatia's economic outlook from negative to stable, reafirming Croatia's current BBB rating.[42] The slow pace of privatization of state-owned businesses has also been a drag on the economy.[38]
Croatia joined European Union on 1 July 2013 as the 28th member state, and in spite of the rather slow post-recession recovery, in terms of income per capita it is still ahead of some European Union member states such as Bulgaria, Romania, and Latvia.[43] In terms of average monthly wage, Croatia is ahead of 9 EU members (Czech Republic, Estonia, Slovakia, Latvia, Poland, Hungary, Lithuania, Romania, and Bulgaria).[44] The Croatian economy is heavily interdependent on other principal economies of Europe, and any negative trends in these larger EU economies also have a negative impact on Croatia as they are its biggest trade partners.
Unemployment has been growing since the crisis. As of June 2014 unemployment rate is 18.3% and Croatia has the third highest unemployment rate in the European Union, after Greece (27%), and Spain (26.8%).[45] Of particular concern is the heavily backlogged judiciary system, combined with inefficient public administration, especially regarding the issues of land ownership and corruption in the public sector. Unemployment is regionally uneven: it is very high in eastern and southern parts of the country, nearing 20% in some areas, while relatively low in the north-west and in larger cities, where it is between 3 and 7%.
Sectors
Tourism
Tourism is a notable source of income during the summer and a major industry in Croatia. It dominates the Croatian service sector and accounts for up to 20% of Croatian GDP. Annual tourist industry income for 2011 was estimated at €6.61 billion. Its positive effects are felt throughout the economy of Croatia in terms of increased business volume observed in retail business, processing industry orders and summer seasonal employment. The industry is considered an export business, because it significantly reduces the country's external trade imbalance.[46] Since the conclusion of the Croatian War of Independence, the tourist industry has grown rapidly, recording a fourfold rise in tourist numbers, with more than 10 million tourists each year. The most numerous are tourists from Germany, Slovenia, Austria and the Czech Republic as well as Croatia itself. Length of a tourist stay in Croatia averages 4.9 days.[47]
The bulk of the tourist industry is concentrated along the Adriatic Sea coast. Opatija was the first holiday resort since the middle of the 19th century. By the 1890s, it became one of the most significant European health resorts.[48] Later a large number of resorts sprang up along the coast and numerous islands, offering services ranging from mass tourism to catering and various niche markets, the most significant being nautical tourism, as there are numerous marinas with more than 16 thousand berths, cultural tourism relying on appeal of medieval coastal cities and numerous cultural events taking place during the summer. Inland areas offer mountain resorts, agrotourism and spas. Zagreb is also a significant tourist destination, rivalling major coastal cities and resorts.[49]
Croatia has unpolluted marine areas reflected through numerous nature reserves and 116 Blue Flag beaches.[50] Croatia is ranked as the 18th most popular tourist destination in the world.[51] About 15% of these visitors (over one million per year) are involved with naturism, an industry for which Croatia is world famous. It was also the first European country to develop commercial naturist resorts.[52]
Agriculture

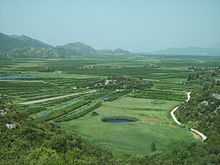
Croatian agricultural sector subsists from exports of blue water fish, which in recent years experienced a tremendous surge in demand, mainly from Japan and South Korea. Croatia is a notable producer of organic foods and much of it is exported to the European Union. Croatian wines, olive oil and lavender are particularly sought after.
Stock exchanges
Banking

Central bank:
Major commercial banks:
- Zagrebačka banka (owned by UniCredit from Italy)
- Privredna banka Zagreb (owned by Intesa Sanpaolo from Italy)
- Hrvatska poštanska banka
- Hypo-Alpe-Adria Bank (owned by Hypo-Alpe-Adria Bank from Austria)
- Raiffeisen Bank Austria (owned by Raiffeisen from Austria)
- Erste & Steiermärkische Bank (former Riječka banka, owned by Erste Bank from Austria)
Central Budget
Overall Budget:[53]
revenues:
- $21.75 billion (114.2 billion Kuna)2007 (official figure)
- projected for 2008 - 124.2 billion Kuna (24.85 billion USD)
expenditures:
- $22.8 billion, (119.2 billion Kuna) 2007(official figure)
- projected for 2008 - 128.7 billion Kuna (25.74 billion USD)
Expenditure for 2007:
- Education - 10.5 billion Kuna
- Health Care - 21.4 billion Kuna
- Welfare & labour - 38.4 billion Kuna
- Interior and Justice - 6.6 billion Kuna
- Defense - 4.7 billion Kuna
- Finance - 11.1 billion Kuna
- Agriculture - 3.3 billion Kuna
- Culture and Sport - 1.2 billion Kuna
- Other - 17.0 billion kuna
Expenditure for 2008 = projected:
- Education - 12.4 billion Kuna
- Health Care - 22.4 billion Kuna
- Welfare and labour - 41.3 billion Kuna
- Interior and Justice - 6.6 billion Kuna
- Defense - 5.45 billion Kuna
- Finance - 12.0 billion Kuna
- Agriculture - 3.6 billion Kuna
- Culture and Sport - 1.2 billion Kuna
- Other - 23.8 billion Kuna
Economic indicators
From the CIA World Factbook 2012.
GDP: purchasing power parity - $79.14 billion (2012 est.)
GDP - real growth rate: -1.8% (2012 est.)
GDP - per capita: purchasing power parity - $18,100 (2012 est.)
GDP - composition by sector: agriculture: 4.7% industry: 33.1% services: 62.2% (2012 est.)
Labor force: 1.745 million (2012 est.)
Labor force - by occupation: agriculture 2.1%, industry 29%, services 69% (2012)
Unemployment rate: 20.4% (2012 est.)[40]
Population below poverty line:
national absolute:
11% (2003)
18% (2009)
21.1% (2012)
Household income or consumption by percentage share:
lowest 10%:
3.3%
highest 10%:
27.5%
(2008 est.)
Distribution of family income - Gini index: 29 (2001) 32 (2010)
Inflation rate (consumer prices): 4.7% (2012)
Investment (gross fixed): 18,4% of GDP (2012 est.)
Budget:
revenues:
$19.3 billion (2012 est.)
expenditures:
$20.99 billion, (2012 est.)
Public debt: 52.1% of GDP (2012 est.)
Agriculture - products: wheat, corn, sugar beets, sunflower seed, barley, alfalfa, clover, olives, citrus, grapes, soybeans, potatoes; livestock, dairy products
Industries: chemicals and plastics, machine tools, fabricated metal, electronics, pig iron and rolled steel products, aluminium, paper, wood products, construction materials, textiles, shipbuilding, petroleum and petroleum refining, food and beverages; tourism
Industrial production growth rate: 5.2% (2007 est.) -5.3% (2012 est.)
Electricity - production: 11.99 billion kWh (2005)
Electricity - production by source:
fossil fuel:
33.6%
hydro:
66%
nuclear:
0%
other:
0.4% (2001)
Electricity - consumption: 14.97 billion kW·h (2005)
Electricity - exports: 3.634 billion kW·h (2005)
Electricity - imports: 8.746 billion kW·h (2005)
Oil - production: 27,190 barrels per day (4,323 m3/d) (2005 est.)
Oil - consumption: 99,000 barrels per day (15,700 m3/d) (2004 est.)
Oil - proved reserves: 69.14 million barrels (10.992×10⁶ m3) (1 January 2006)
Natural gas - production: 1.477 billion cubic metres (2005 est.)
Natural gas - consumption: 2.58 billion cubic metres (2005 est.)
Natural gas - exports: 0 cubic metres (2005 est.)
Natural gas - imports: 1.103 billion cubic metres (2005 est.)
Natural gas - proved reserves: 27.16 billion cubic metres (1 January 2006)
Current account balance: −$4.385 billion (2007 est.)
Exports: $12.02 billion f.o.b. (2007 est.)
Exports - commodities: transport equipment, textiles, chemicals, foodstuffs, fuels
Exports - partners: Italy 23.1%, Bosnia and Herzegovina 12.7%, Germany 10.4%, Slovenia 8.3%, Austria 6.1%, (2006)
Imports: $26.54 billion f.o.b. (2007 est.)
Imports - commodities: machinery, transport and electrical equipment, chemicals, fuels and lubricants, foodstuffs
Imports - partners: Italy 16.7%, Germany 14.5%, Russia 9.7%, Slovenia 6.8%, Austria 5.4%, China 5.3%, (2006)
Reserves of foreign exchange and gold: $13.67 billion (31 December 2007 est.)
Debt - external: $45.29 billion (30 June 2007 est.)
Economic aid - recipient: ODA $125.4 million (2005)
Currency: kuna (HRK)
Exchange rates: kuna per US$1 – 5.7089 (2013), 5.3735 (2007), 5.8625 (2006), 5.9473 (2005), 6.0358 (2004), 6.7035 (2003), 7.8687 (2002), 8.34 (2001), 8.2766 (2000), 7.112 (1999), 6.362 (1998), 6.157 (1997), 5.434 (1996), 5.230 (1995)
Gross Domestic Product
| Counties of Croatia by GDP, in million Euro | ||||||||||
|---|---|---|---|---|---|---|---|---|---|---|
| County | 2000 | 2001 | 2002 | 2003 | 2004 | 2005 | 2006 | 2007 | 2008 | 2009 |
| Bjelovar-Bilogora | 548 | 604 | 674 | 672 | 716 | 754 | 848 | 847 | 1,037 | 957 |
| Brod-Posavina | 575 | 643 | 699 | 717 | 782 | 786 | 869 | 931 | 1,074 | 968 |
| Dubrovnik-Neretva | 572 | 634 | 674 | 742 | 876 | 963 | 1,063 | 1,265 | 1,344 | 1,273 |
| Istria | 1,401 | 1,597 | 1,783 | 1,935 | 2,137 | 2,240 | 2,410 | 2,654 | 2,826 | 2,754 |
| Karlovac | 587 | 715 | 783 | 752 | 770 | 839 | 940 | 1,052 | 1,127 | 1,009 |
| Koprivnica-Križevci | 684 | 733 | 793 | 793 | 810 | 872 | 1,017 | 1,103 | 1,169 | 1,121 |
| Krapina-Zagorje | 571 | 660 | 685 | 703 | 721 | 834 | 879 | 984 | 1,011 | 897 |
| Lika-Senj | 242 | 259 | 316 | 384 | 521 | 398 | 418 | 411 | 492 | 435 |
| Međimurje | 520 | 575 | 651 | 655 | 693 | 725 | 836 | 894 | 1,057 | 984 |
| Osijek-Baranja | 1,370 | 1,499 | 1,699 | 1,710 | 1,884 | 1,999 | 2,193 | 2,538 | 2,844 | 2,590 |
| Požega-Slavonia | 337 | 371 | 395 | 428 | 456 | 472 | 484 | 541 | 557 | 510 |
| Primorje-Gorski Kotar | 2,040 | 2,067 | 2,185 | 2,440 | 2,586 | 2,952 | 3,222 | 3,406 | 3,864 | 3,744 |
| Sisak-Moslavina | 917 | 938 | 971 | 978 | 1,026 | 1,140 | 1,318 | 1,269 | 1,470 | 1,432 |
| Split-Dalmatia | 1,883 | 2,077 | 2,267 | 2,446 | 2,813 | 3,006 | 3,324 | 3,847 | 4,058 | 3,837 |
| Šibenik-Knin | 416 | 447 | 506 | 570 | 647 | 742 | 751 | 892 | 932 | 826 |
| Varaždin | 898 | 1,001 | 1,141 | 1,161 | 1,150 | 1,221 | 1,372 | 1,490 | 1,700 | 1,592 |
| Virovitica-Podravina | 378 | 434 | 465 | 478 | 493 | 497 | 584 | 616 | 661 | 561 |
| Vukovar-Syrmia | 651 | 723 | 795 | 836 | 889 | 964 | 1,098 | 1,144 | 1,318 | 1,180 |
| Zadar | 623 | 731 | 825 | 962 | 1,035 | 1,139 | 1,184 | 1,380 | 1,580 | 1,474 |
| Zagreb County | 1,301 | 1,293 | 1,599 | 1,658 | 1,825 | 2,043 | 2,085 | 2,392 | 2,627 | 2,560 |
| City of Zagreb | 6,632 | 7,537 | 8,205 | 8,991 | 9,927 | 11,138 | 12,208 | 13,176 | 14,622 | 14,079 |
| Source: Croatian Bureau of Statistics[54][55][56][57] | ||||||||||
| Counties of Croatia by GDP per capita, in Euro | ||||||||||
|---|---|---|---|---|---|---|---|---|---|---|
| County | 2000 | 2001 | 2002 | 2003 | 2004 | 2005 | 2006 | 2007 | 2008 | 2009 |
| Bjelovar-Bilogora | 4,105 | 4,550 | 5,108 | 5,135 | 5,510 | 5,848 | 6,634 | 6,691 | 8,255 | 7,677 |
| Brod-Posavina | 3,260 | 3,633 | 3,955 | 4,065 | 4,452 | 4,487 | 4,972 | 5,345 | 6,183 | 5,606 |
| Dubrovnik-Neretva | 4,679 | 5,146 | 5,456 | 5,990 | 7,059 | 7,719 | 8,482 | 10,042 | 10,601 | 9,990 |
| Istria | 6,828 | 7,728 | 8,597 | 9,275 | 10,192 | 10,628 | 11,377 | 12,463 | 13,195 | 12,810 |
| Karlovac | 4,124 | 5,054 | 5,581 | 5,408 | 5,580 | 6,125 | 6,923 | 7,825 | 8,451 | 7,634 |
| Koprivnica-Križevci | 5,487 | 5,894 | 5,406 | 6,441 | 6,620 | 7,157 | 8,386 | 9,142 | 9,730 | 9,371 |
| Krapina-Zagorje | 3,995 | 4,639 | 4,843 | 5,001 | 5,161 | 5,993 | 6,345 | 7,144 | 7,377 | 6,576 |
| Lika-Senj | 4,478 | 4,822 | 5,941 | 7,249 | 9,892 | 7,603 | 8,074 | 8,039 | 9,725 | 8,707 |
| Međimurje | 4,397 | 4,855 | 5,494 | 5,535 | 5,855 | 6,125 | 7,074 | 7,581 | 8,960 | 8,349 |
| Osijek-Baranja | 4,147 | 4,537 | 5,149 | 5,199 | 5,750 | 6,127 | 6,757 | 7,875 | 8,871 | 8,112 |
| Požega-Slavonia | 3,934 | 4,320 | 4,610 | 5,020 | 5,383 | 5,605 | 5,786 | 6,505 | 6,750 | 6,229 |
| Primorje-Gorski Kotar | 6,682 | 6,765 | 7,155 | 7,997 | 8,474 | 9,674 | 10,560 | 11,177 | 12,680 | 12,305 |
| Sisak-Moslavina | 4,949 | 5,067 | 5,274 | 5,349 | 5,654 | 6,331 | 7,391 | 7,200 | 8,432 | 8,325 |
| Split-Dalmatia | 4,097 | 4,468 | 4,840 | 5,192 | 5,935 | 6,298 | 6,932 | 8,003 | 8,422 | 7,952 |
| Šibenik-Knin | 3,710 | 3,953 | 4,466 | 5,019 | 5,691 | 6,513 | 6,575 | 7,799 | 8,156 | 7,239 |
| Varaždin | 4,852 | 5,422 | 6,198 | 6,338 | 6,305 | 6,711 | 7,552 | 8,223 | 9,404 | 8,834 |
| Virovitica-Podravina | 4,045 | 4,654 | 5,016 | 5,176 | 5,410 | 5,485 | 6,497 | 6,923 | 7,485 | 6,399 |
| Vukovar-Syrmia | 3,184 | 3,528 | 3,903 | 4,127 | 4,414 | 4,807 | 5,501 | 5,756 | 6,647 | 5,974 |
| Zadar | 3,872 | 4,497 | 5,027 | 5,806 | 6,198 | 6,731 | 6,918 | 7,980 | 9,051 | 8,388 |
| Zagreb County | 4,236 | 4,166 | 5,111 | 5,249 | 5,731 | 6,368 | 6,458 | 7,360 | 8,036 | 7,803 |
| City of Zagreb | 8,532 | 9,674 | 10,529 | 11,527 | 12,701 | 14,216 | 15,567 | 16,766 | 18,554 | 17,814 |
| Source: Croatian Bureau of Statistics[54][55][56][57] | ||||||||||
See also
References
- ↑
- ↑ "GDP per capita, PPP (current international $) - Croatia".
- ↑ 3.0 3.1 3.2 http://www.dzs.hr
- ↑ 4.0 4.1 Average Net Earnings from Croatian Bureau of Statistics
- ↑ "Doing Business in Croatia 2012". World Bank. Retrieved 2011-11-21.
- ↑ 6.0 6.1 http://www.dzs.hr/
- ↑ "Exports Partners of Croatia". CIA World Factbook. 2012. Retrieved 2013-07-24.
- ↑ "Import Partners of Croatia". CIA World Factbook. 2012. Retrieved 2013-07-24.
- ↑ 9.0 9.1
- ↑ "Sovereigns rating list". Standard & Poor's. Retrieved 26 May 2011.
- ↑
- ↑ Top Destinations for 2005
- ↑ "Advantages of Croatia Company Registration". Healy Consultants. Retrieved 5 February 2015.
- ↑ Mariann Nagy - Croatia in the Economic Structure of the Habsburg Empire in the Light of the 1857 Census, p. 81-82
- ↑ Mariann Nagy - Croatia in the Economic Structure of the Habsburg Empire in the Light of the 1857 Census, p. 88
- ↑ Society for the Diffusion of Useful Knowledge: The Penny Cyclopaedia of the Society for the Diffusion of Useful Knowledge, vol 22, p. 100-101
- ↑ 17.0 17.1 Richard C. Frucht: Eastern Europe: An Introduction to the People, Land, and Culture, p. 462-463
- ↑ Rory Yeomans:Visions of Annihilation: The Ustasha Regime and the Cultural Politics of Fascism, 1941-1945, University of Pittsburgh Pre, 2013, p. 197
- ↑ Hrvoje Matković: Povijest nezavisne države Hrvatske, Drugo, dopunjeno izdanje Zagreb, 2002., p. 118
- ↑ Jozo Tomašević: Rat i revolucija u Jugoslaviji 1941-1945, 2010, p. 785
- ↑ Jozo Tomašević: Rat i revolucija u Jugoslaviji 1941-1945, 2010, p. 765-766
- ↑ The Library of Congress Country Studies; CIA World Factbook
- ↑ Ivo Nejašmić: Hrvatski građani na radu u inozemstvu: razmatranje popisnih podataka 1971, 1981. i 1991.
- ↑ Europa Publications Limited. Eastern Europe and the Commonwealth of Independent States 1999: 1999. Routledge, 1999. (pg. 279)
- ↑ 25.0 25.1 25.2 International Business Publications: Croatia Investment and Trade Laws and Regulations Handbook, p. 22
- ↑ CIA - The World Factbook 2000 - Croatia
- ↑ 27.0 27.1 27.2 27.3 Istvan Benczes: Deficit and Debt in Transition: The Political Economy of Public Finances in Central and Eastern Europe, Central European University Press, 2014, p. 203
- ↑ Eastern Europe: An Introduction to the People, Land, and Culture, p. 473
- ↑ 29.0 29.1 Istvan Benczes: Deficit and Debt in Transition: The Political Economy of Public Finances in Central and Eastern Europe, Central European University Press, 2014, p. 205-206
- ↑ OECD: Agricultural Policies in Emerging and Transition Economies 1999, p. 43
- ↑ National Accounts Main Aggregates Database
- ↑ 32.0 32.1 Gale Research: Countries of the World and Their Leaders: Yearbook 2001, p. 456
- ↑ Istvan Benczes:Deficit and Debt in Transition: The Political Economy of Public Finances in Central and Eastern Europe, Central European University Press, 2014, p. 207
- ↑ CIA Factbook - Croatia
- ↑ Richard C. Frucht: Eastern Europe: An Introduction to the People, Land, and Culture, p. 468
- ↑ 36.0 36.1 36.2 http://euce.org/eusa/2011/papers/2f_adams.pdf
- ↑ http://www.qfinance.com/country-profiles/croatia
- ↑ 38.0 38.1 2015 Index of Economic Freedom - Croatia
- ↑ http://www.balkaninsight.com/en/article/croatia-loses-battle-with-crisis
- ↑ 40.0 40.1 Ekonomski Indikatori
- ↑ http://www.dzs.hr/Hrv_Eng/publication/2011/14-01-02_01_2011.htm
- ↑ http://www.balkaninsight.com/en/article/fitch-unexpectedly-improves-croatian-economic-outlook
- ↑ Per capita GDP
- ↑ List of countries in Europe by monthly average wage
- ↑ http://epp.eurostat.ec.europa.eu/cache/ITY_PUBLIC/3-31052013-BP/EN/3-31052013-BP-EN.PDF
- ↑ Tomislav Pili; Davor Verković (1 October 2011). "Iako čini gotovo petinu BDP-a, i dalje niskoprofitabilna grana domaće privrede" [Even though it comprises nearly a fifth of the GDP, it is still a low-profit branch of the national economy]. Vjesnik (in Croatian). Archived from the original on 14 June 2012. Retrieved 20 October 2011.
- ↑ "Turistički prihod porast će prvi put nakon 2008." [Tourist income to rise for the first time since 2008]. t-portal.hr (in Croatian). T-Hrvatski Telekom. 14 September 2011. Retrieved 21 October 2011.
- ↑ "History of Opatija". Opatija Tourist Board. Retrieved 21 October 2011.
- ↑ "Activities and attractions". Croatian National Tourist Board. Retrieved 21 October 2011.
- ↑ "Croatia". Foundation for Environmental Education. Retrieved 21 October 2011.
- ↑ "UNWTO World Tourism Barometer" (PDF). October 2007. Retrieved 23 April 2008.
- ↑ "Croatian highlights, Croatia". Euro-poi.com. Retrieved 26 March 2013.
- ↑ Ministarstvo financija Republike Hrvatske - Državni proračun
- ↑ 54.0 54.1 "Gross domestic product for Republic of Croatia, statistical regions at level 2 and counties, 2009". Priopćenje DZS (Zagreb: Croatian Bureau of Statistics) 49 (12.1.2). 14 March 2012. ISSN 1330-0350.
- ↑ 55.0 55.1 "Bruto domaći proizvod za Republiku Hrvatsku, prostorne jedinice za statistiku 2. razine i županije od 2000. do 2006." [Gross domestic product of the Republic of Croatia, 2nd tier spatial units and counties, from 2000 to 2006]. Priopćenja 2002–2007 (in Croatian) (Zagreb: Croatian Bureau of Statistics) 46 (12.1.5). 3 July 2009. ISSN 1334-0565. Retrieved 8 July 2012.
- ↑ 56.0 56.1 "Gross domestic product for Republic of Croatia, statistical regions at level 2 and counties, 2007". Priopćenje DZS (Zagreb: Croatian Bureau of Statistics) 47 (12.1.2). 1 March 2010. ISSN 1330-0350.
- ↑ 57.0 57.1 "Gross domestic product for Republic of Croatia, statistical regions at level 2 and counties, 2008". Priopćenje DZS (Zagreb: Croatian Bureau of Statistics) 48 (12.1.2). 11 February 2011. ISSN 1330-0350.
External links
| Wikimedia Commons has media related to Economy of Croatia. |
- Croatian National Bank
- Croatian Chamber of Economy
- GDP per inhabitant varied by one to six across the EU27 Member States
| ||||||||||||||||||||||||||||||||||||||||||
| ||||||||||||||||||