Dutch general election, 1989
Dutch general election, 1989

|
|
|
|
All 150 seats to the House of Representatives
76 seats were needed for a majority |
| Turnout |
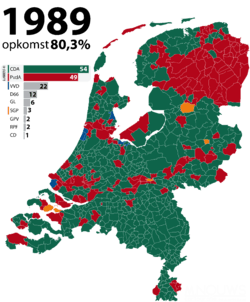
80.3% |
| |
First party |
Second party |
Third party |
| |
 |
 |
 |
| Leader |
Ruud Lubbers |
Wim Kok |
Joris Voorhoeve |
| Party |
CDA |
PvdA |
VVD |
| Leader since |
1982 |
1986 |
1986 |
| Last election |
54 seats, 34.6% |
52 seats, 33.3% |
27 seats, 17.4% |
| Seats won |
54 |
49 |
22 |
| Seat change |
 0 0 |
 3 3 |
5 |
| Popular vote |
3,140,502 |
2,835,251 |
1,295,402 |
| Percentage |
35.3% |
31.9% |
14.6% |
|
| |
Fourth party |
Fifth party |
Sixth party |
| |
 |
.jpg) |
| Leader |
Hans van Mierlo |
Ria Beckers |
Bas van der Vlies |
| Party |
D66 |
GL |
SGP |
| Leader since |
1986 |
1994 |
1986 |
| Last election |
9 seats, 6.1% |
3 seats, 3.3% |
3 seats, 1.7% |
| Seats won |
12 |
6 |
3 |
| Seat change |
 3 3 |
3 |
0 |
| Popular vote |
701,934 |
362,304 |
166,082 |
| Percentage |
7.9% |
4.1% |
1.9% |
|
| |
Seventh party |
Eighth party |
Ninth party |
| |
 |
 |
_-_NL-HaNA_Anefo_932-6890_WM504.jpg) |
| Leader |
Gert Schutte |
Meindert Leerling |
Hans Janmaat |
| Party |
GPV |
RPF |
CD |
| Leader since |
1981 |
1980 |
1984 |
| Last election |
1 seats, 1.0% |
1 seats, 0.9% |
0 seats, 0.1% |
| Seats won |
2 |
1 |
1 |
| Seat change |
1 |
0 |
1 |
| Popular vote |
109,637 |
85,231 |
81,427 |
| Percentage |
1.2% |
1.0% |
0.9% |
|
|
|
General elections were held in the Netherlands on 6 September 1989.[1] The Christian Democratic Appeal remained the largest party, winning 54 of the 150 seats in the House of Representatives.[2] This chamber served for 4 years and 7 months, the longest tenure of any modern Dutch parliament.
Results
| Party |
Votes |
% |
Seats |
+/– |
|---|
| Christian Democratic Appeal | 3,140,502 | 35.3 | 54 | 0 |
| Labour Party | 2,835,251 | 31.9 | 49 | –3 |
| People's Party for Freedom and Democracy | 1,295,402 | 14.6 | 22 | –5 |
| Democrats 66 | 701,934 | 7,9 | 12 | +3 |
| Reformed Political Party | 166,082 | 1.9 | 3 | 0 |
| GreenLeft | 362,304 | 4.1 | 6 | +3 |
| Reformed Political League | 109,637 | 1.2 | 2 | +1 |
| Reformatory Political Federation | 85,231 | 1.0 | 1 | 0 |
| Centre Democrats | 81,427 | 0.9 | 1 | +1 |
| Anti Unemployment Party | 115,532 | 1.3 | 0 | New |
| Elderly Central | 0 | New |
| The Greens | 0 | New |
| Great Alliance Party | 0 | New |
| Humanist Party | 0 | 0 |
| Environmental Defence Party 2000+ | 0 | New |
| Party of Democratic Socialists | 0 | New |
| Political Party for the Elderly | 0 | New |
| Realistic Netherlands | 0 | New |
| Socialist Workers' Party | 0 | 0 |
| Constitutional Federation | 0 | New |
| Socialist Minority Party | 0 | New |
| Socialist Party | 0 | 0 |
| League of Communists in the Netherlands | 0 | 0 |
| Progressive Minorities Party | 0 | New |
| Women's Party | 0 | New |
| Invalid/blank votes | 26,485 | – | – | – |
| Total | 8,919,787 | 100 | 150 | 0 |
| Registered voters/turnout | 11,112,189 | 80.3 | – | – |
| Source: Nohlen & Stöver |
| Popular Vote |
|---|
|
|
|
|
|
| CDA |
|
35.31% |
| PvdA |
|
31.88% |
| VVD |
|
14.57% |
| D66 |
|
4.07% |
| SGP |
|
1.87% |
| GPV |
|
1.23% |
| RPF |
|
0.96% |
| CD |
|
0.92% |
| SP |
|
0.44% |
| Other |
|
0.86% |
References
- ↑ Nohlen, D & Stöver, P (2010) Elections in Europe: A data handbook, p1396 ISBN 978-3-8329-5609-7
- ↑ Nohlen & Stöver, p1414