Developed country
| Economics |
|---|
 |
|
|
| By application |
|
| Lists |
|
A developed country, industrialized country, or "more economically developed country" (MEDC), is a sovereign state that has a highly developed economy and advanced technological infrastructure relative to other less industrialized nations. Most commonly, the criteria for evaluating the degree of economic development are gross domestic product (GDP), gross national product (GNP), the per capita income, level of industrialization, amount of widespread infrastructure and general standard of living.[1] Which criteria are to be used and which countries can be classified as being developed are subjects of debate.
Developed countries have post-industrial economies, meaning the service sector provides more wealth than the industrial sector. They are contrasted with developing countries, which are in the process of industrialization, or undeveloped countries, which are pre-industrial and almost entirely agrarian. According to the International Monetary Fund, advanced economies comprise 65.8% of global nominal GDP and 52.1% of global GDP (PPP) in 2010.[2] In 2014, the ten largest advanced economies by nominal GDP were the United States, Japan, Germany, France, the United Kingdom, Italy, Canada, Australia, South Korea and Spain. By PPP GDP, they were the United States, Japan, Germany, France, the United Kingdom, Italy, South Korea, Canada, Spain and Australia.[3]
Similar terms
Terms similar to developed country include "advanced country", "industrialized country", "'more developed country" (MDC), "more economically developed country" (MEDC), "Global North country", "first world country", and "post-industrial country". The term industrialized country may be somewhat ambiguous, as industrialization is an ongoing process that is hard to define. The first industrialized country was the United Kingdom, followed by Belgium. Later it spread further to Germany, United States, France and other Western European countries. According to some economists such as Jeffrey Sachs, however, the current divide between the developed and developing world is largely a phenomenon of the 20th century.[4]
Definition and criteria
Economic criteria have tended to dominate discussions. One such criterion is income per capita; countries with high gross domestic product (GDP) per capita would thus be described as developed countries. Another economic criterion is industrialization; countries in which the tertiary and quaternary sectors of industry dominate would thus be described as developed. More recently another measure, the Human Development Index (HDI), which combines an economic measure, national income, with other measures, indices for life expectancy and education has become prominent. This criterion would define developed countries as those with a very high (HDI) rating.
According to the United Nations Statistics Division,
- There is no established convention for the designation of "developed" and "developing" countries or areas in the United Nations system.[5]
And it notes that
- The designations "developed" and "developing" are intended for statistical convenience and do not necessarily express a judgement about the stage reached by a particular country or area in the development process.[6]
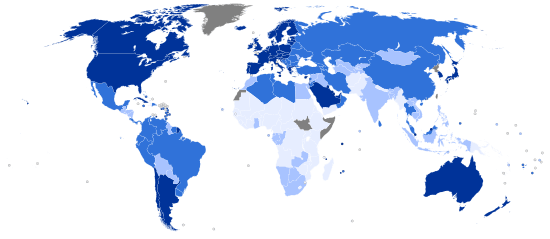
Human Development Index (HDI)
The UN HDI is a statistical measure that gauges a country's level of human development. While there is a strong correlation between having a high HDI score and a prosperous economy, the UN points out that the HDI accounts for more than income or productivity. Unlike GDP per capita or per capita income, the HDI takes into account how income is turned "into education and health opportunities and therefore into higher levels of human development."
Since 1990, Norway (2001–2006, 2009–2013), Japan (1990–91 and 1993), Canada (1992 and 1994–2000) and Iceland (2007–2008) have had the highest HDI score. The top 47 countries have scores ranging from 0.793 in Barbados to 0.955 in Norway.
Many countries listed by IMF or[Note 1] CIA as "advanced" (as of 2009), possess an HDI over 0.788 (as of 2010). Many countries[Note 2] possessing an HDI of 0.788 and over (as of 2010), are also listed by IMF or CIA as "advanced" (as of 2009). Thus, many "advanced economies" (as of 2009) are characterized by an HDI score of 0.9 or higher (as of 2007).
The latest index was released on 24 July 2014 and covers the period up to 2013. The following are the 49 countries in the top quartile - having an HDI above 0.8, and classified as possessing a "Very high human development".
-
 = Increase
 -
 = No increase or decrease
 -
 = Decrease
 - The number in brackets represents the number of ranks the country has climbed (up or down) relative to the ranking in 2013 report.
|
| |||||||||||||||||||||||||||||||||||||||||||||||||||||||||||||||||||||||||||||||||||||||||||||||||||||||||||||||||||||||||||||||||||||||||||||||||||||||||||||||||||||||||||||||||||||||||||||||||||||||||||||||||||||||||||||||||||||||||||||||||||||||||||||||||||||||
As a non-UN member, the government of Taiwan calculates its own HDI, which had a value of 0.882 in 2011.[8] Additionally, while the HDI for the Chinese special administrative region of Hong Kong is calculated by the UN, it is not for Macau. The Macanese government calculated the territory's HDI to be 0.868 in 2011. These values place both Taiwan and Macau well within the list of countries with "Very high human development".[9] Furthermore, in 2009 a United Nations project calculated the HDI for all of its members, as well as Taiwan, Macau, and many dependent territories. The HDI values for the countries of San Marino and Monaco, which have not been included in official annual HDI reports, were found to be at 0.961 and 0.956 respectively. This places both countries firmly within the category of countries with "Very high human development" as well. The dependent territories with HDI values equivalent to "Very high human development" were: Jersey, Cayman Islands, Bermuda, Guernsey, Gibraltar, Norfolk Island, Faroe Islands, Isle of Man, British Virgin Islands, Falkland Islands, Aruba, Puerto Rico, Martinique, and Guam.[10] Of note, the HDI values in the 2009 report were calculated using the old HDI formula, while HDI values after the year 2010 are calculated with a different formula.
Net take-home pay of OECD members
While GDP per capita is often used to measure how developed a country is, it includes components that do not contribute to a citizen's standard of living. GDP per capita may increase while real incomes for the majority decline. However, measuring only net take-home pay gives a more accurate picture of a country's standard of living. The tables show net income figures published annually in the OECD Tax Database.[11] They reflect the annual augmented total net take-home pay, by family-type, deducting taxes and non-tax compulsory payments. Since PPP conversion is a widely accepted way to compare income, the OECD publishes the data in USD PPPs. The two major family-types, married with 2 children and single with no child at 100% average wage have been selected to give an accurate picture of the wage levels. Note that Turkey has been omitted from the tables for consistency due to its wage figures being based on the old definition of average worker.
|
Married with 2 children at 100% of average wage[12]
|
Single with no child at 100% of average wage[12]
|
Gallup median household and per-capita income
In 2013, Gallup published a list of countries with median per capita and household income.[13] Using median, rather than mean income, results in a much more accurate picture of the average income of the middle class since the data will not be skewed by gains and abnormalities in the extreme ends. The figures are in international dollars using purchasing power parity and are based on responses from at least 2,000 adults in each country, with the data aggregated from 2006 to 2012. Below is a list of the top 30 countries in each category.
|
|
Other lists of developed countries
Only three institutions have produced lists of "developed countries". The three institutions and their lists are the UN list (shown above), the CIA[14] list and the FTSE Group's list, whose list is not included because its association of developed countries with countries with both high incomes and developed markets is not deemed as directly relevant here.[Note 3] However many institutions have created lists which are sometimes referred to when people are discussing developed countries. The International Monetary Fund (IMF) identifies 37 "advanced economies",[15][16] The OECD, also widely known as the "developed countries club"[17][18][19] has 34 members. The World Bank identifies 74 "high income countries". The EIU's Quality-of-life survey and a list of countries with welfare states are also included here. The criteria for using all these lists and for countries' inclusion on these lists are often not properly spelt out, and several of these lists are based on old data.
IMF advanced economies
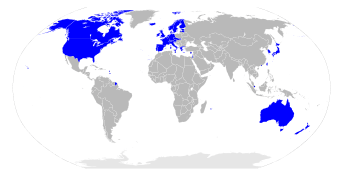
According to the International Monetary Fund the following 37 economies are classified as "advanced economies":[15]
-
 Australia
 -
 Austria
 -
.svg.png) Belgium
Belgium -
 Canada
 -
 Cyprus
 -
 Czech Republic
 -
 Denmark
 -
 Estonia
 -
 Finland
 -
 France
 -
 Germany
 -
 Greece
 -
 Hong Kong (China)
 -
 Iceland
 -
 Ireland
 -
 Israel
 -
 Italy
Italy -
 Japan
Japan -
 Latvia
 -
 Lithuania
 -
 Luxembourg
 -
 Malta
Malta -
 Netherlands
 -
 New Zealand
 -
 Norway
 -
 Portugal
 -
 San Marino
 -
 Singapore
 -
 Slovakia
 -
 Slovenia
 -
 South Korea
 -
 Spain
Spain -
 Sweden
 -
 Switzerland
 -
 Taiwan
 -
 United Kingdom
 -
 United States
The CIA has modified an older version of the IMF's list of Advanced Economies, noting that the IMF's Advanced Economies list "would presumably also cover"[14] some smaller countries. These include:
High-income OECD members
There are 31 members in the High-income OECD category, as determined by the World Bank.[20] The High-income OECD membership is as follows:
23 countries in Europe:
3 countries in Asia:
3 countries in the Americas:
2 countries in Oceania:
Development Assistance Committee members
There are 29 members — 28 selected OECD member countries and the European Union—in the Development Assistance Committee (DAC),[21] a group of the world's major donor countries that discuss issues surrounding development aid and poverty reduction in developing countries.[22] The following OECD member countries are DAC members:
22 countries in Europe:
2 countries in Asia:
2 countries in North America:
2 countries in Oceania:
Newsweek's "world's best countries"
Newsweek published in 2010 a list of the "world's best countries", measuring "education, health, quality of life, economic dynamism, and political environment" in 100 countries. The top 30 countries are:[23]
See also
- Developing country
- Digital divide
- First World
- First World privilege
- First World problem
- Fourth World
- Globalization
- Least developed country
- Multinational corporation
- North-South divide
- Third World
Notes
- ↑ The official classification of "advanced economies" is originally made by the International Monetary Fund (IMF). The IMF list doesn't deal with non-IMF members. The Central Intelligence Agency (CIA) intends to follow IMF list but adds few economies which aren't dealt with by IMF due to their not being IMF members. By May 2001,the advanced country list of the CIA was more comprehensive than the original IMF list. However, since May 2001, three additional countries (Cyprus, Malta and Slovenia) have been added to the original IMF list, thus leaving the CIA list not updated.
- ↑ Namely sovereign states, i.e., excluding Macau: In 2003 the government of Macau calculated its HDI as being 0.909 (the UN does not calculate Macau's HDI); In January 2007, the People's Daily reported (from China Modernization Report 2007): "In 2004... Macau... had reached the level of developed countries". However, Macau is not recognized by any international organisation as a developed/advanced territory, while the UNCTAD organisation (of the UN), as well as the CIA, classify Macau as a "developing" territory. The World Bank classifies Macau as a high income economy (along with developed economies as well as with few developing economies).
- ↑ The Developed Countries Glossary entry reads: "The following countries are classified by FTSE as developed countries: Australia, Austria, Belgium/Luxembourg, Canada, Denmark, Finland, France, Germany, Greece, Hong Kong (People's Republic of China), Ireland, Israel, Italy, Japan, Netherlands, New Zealand, Norway, Portugal, Singapore, South Korea, Spain, Sweden, Switzerland, United Kingdom and the United States."
References
- ↑ Developed Economy Definition. Investopedia (2010-04-16). Retrieved on 2013-07-12.
- ↑ IMF GDP data (September 2011)
- ↑ "Gross domestic product, current prices & Gross domestic product based on purchasing-power-parity (PPP) valuation of country GDP". World Economic Outlook Database, April 2012. International Monetary Fund. April 2012. Retrieved 2014-02-23.
- ↑ Sachs, Jeffrey (2005). The End of Poverty. New York, New York: The Penguin Press. ISBN 1-59420-045-9.
- ↑ "Composition of macro geographical (continental) regions, geographical sub-regions, and selected economic and other groupings (footnote C)". United Nations Statistics Division. 17 October 2008. Retrieved 2008-12-30.
- ↑ United Nations Statistics Division- Standard Country and Area Codes Classifications (M49). Unstats.un.org. Retrieved on 2013-07-12.
- ↑ 7.0 7.1 7.2 7.3 7.4 7.5 7.6 7.7 "Human Development Report 2014 – "Sustaining Human Progress: Reducing Vulnerabilities and Building Resilience"". HDRO (Human Development Report Office) United Nations Development Programme. Retrieved 25 July 2014.
- ↑ "2011中華民國人類發展指數 (HDI)" (PDF) (in Chinese). Directorate General of Budget, Accounting and Statistics, Executive Yuan, R.O.C. 2011. Retrieved 2011-11-21.
- ↑ Macau in Figures, 2013
- ↑ Filling Gaps in the Human Development Index, United Nations ESCAP, February 2009
- ↑ OECD Tax Database
- ↑ 12.0 12.1 2013 OECD Tax Database, Tables S.5 and S.6 shows information on (augmented) total labour costs, net take-home pay and the changes in total labour costs and net take-home pay (updated April 2014) as a result of employer and employee NTCPs.
- ↑ 13.0 13.1 13.2 http://www.gallup.com/poll/166211/worldwide-median-household-income-000.aspx
- ↑ 14.0 14.1 CIA (2008). "Appendix B. International Organizations and Groups.". World Factbook. Retrieved 2008-04-10.
- ↑ 15.0 15.1 IMF Advanced Economies List. World Economic Outlook, April 2015, p. 150
- ↑ World Economic Outlook, International Monetary Fund, September 2011, p. 165.
- ↑ http://www.hungarianquarterly.com/no160/104.shtml
- ↑ http://www.indianexpress.com/old/ie/daily/19971214/34850733.html
- ↑ Minutes of Forum #26:Global Strategy Series 2 - Japan as It Should Be (Outline) | Economic and Social Research Institute, Cabinet Office, Government of Japan. Esri.go.jp. Retrieved on 2013-07-12.
- ↑ Country and Lending Groups | Data. Data.worldbank.org. Retrieved on 2013-07-12.
- ↑ Peer reviews of DAC members - Organisation for Economic Co-operation and Development. Oecd.org. Retrieved on 2013-10-22.
- ↑ DAC website >> "The DAC in Dates", On the DAC's self-description, see the introductory letter. On other events, refer to the relevant section by date.
- ↑ The world's best countries: 2010 index, Newsweek. Accessed on line August 15, 2010.
External links
- IMF (advanced economies)
- The Economist (quality of life survey)
- The World Factbook (developed countries)
- United Nations Statistics Division (definition)
- List of countries, United Nations Statistics Division (developed regions)
- World Bank (high-income economies)
| ||||||||||||||||||||||||||||||||||||||||||||||||
| ||||||||||||||||||||||||||||||
| ||||||||||||||||||||||||||