Derbyshire Dales District Council election, 2003
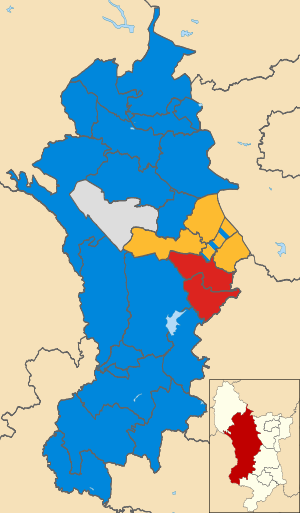
Map of the results of the 2003 Derbyshire Dales District Council election.
Conservatives in blue, Liberal Democrats in yellow,
Labour in red and independents in grey.
The 2003 Derbyshire Dales District Council election took place on 1 May 2003 to elect members of Derbyshire Dales District Council in Derbyshire, England. The whole council was up for election with boundary changes since the last election in 1999.[1] The Conservative party stayed in overall control of the council.[2]
Background
Before the election the Conservatives had a majority on the council with 21 seats, compared to 9 for the Liberal Democrats, 6 for Labour and 3 independents.[3]
Issues at the election included housing, with the Conservatives saying they would make more land available, council tax, where the Liberal Democrats attacked the Conservatives for a 19.9% increase, and waste collection, with Labour objecting to the end of large waste collection, which they said had led to fly tipping.[3] The Liberal Democrats said they were targeting seats in the villages of Baslow and Taddington, while Labour said they were aiming for Darley Dale.[3] However the Conservatives were guaranteed seats after the election, as 13 of their candidates faced no opposition,[3] the highest number of any council in the country.[4]
Election result
The Conservatives gained 3 seats to increase their majority on the council with 24 councillors, after gaining seats from independents in Bakewell ward.[5] The Liberal Democrats remained on 9 seats, while Labour finished with 5 seats and 1 independent was elected.[5] Turnout at the election varied between a high of 52% and a low of 24%,[6] but was down on the 1999 election.[5]
| Derbyshire Dales local election result 2003[7][2] |
| Party |
Seats |
Gains |
Losses |
Net gain/loss |
Seats % |
Votes % |
Votes |
+/− |
| |
Conservative |
24 |
|
|
+3 |
61.5 |
42.5 |
13,153 |
|
| |
Liberal Democrat |
9 |
|
|
0 |
23.1 |
35.7 |
11,058 |
|
| |
Labour |
5 |
|
|
-1 |
12.8 |
14.3 |
4,438 |
|
| |
Independent |
1 |
|
|
-2 |
2.6 |
7.5 |
2,310 |
|
Ward results
| Ashbourne North (2 seats)[7] |
| Party |
Candidate |
Votes |
% |
±% |
|
Conservative |
Frederick Elliott |
unopposed |
|
|
|
Conservative |
Anthony Millward |
unopposed |
|
|
| Bakewell (3 seats)[7] |
| Party |
Candidate |
Votes |
% |
±% |
|
Conservative |
Judith Twigg |
1,042 |
|
|
|
Conservative |
Carol Walker |
810 |
|
|
|
Conservative |
John Pearce |
786 |
|
|
|
Independent |
John Brighton |
531 |
|
|
|
Independent |
Hilary Young |
452 |
|
|
|
Liberal Democrat |
Maureen Smith |
376 |
|
|
|
Liberal Democrat |
Helen Pocock |
351 |
|
|
|
Independent |
Trevor Smith |
332 |
|
|
|
Liberal Democrat |
Joyce Steele |
298 |
|
|
|
Labour |
Stephen Pope |
162 |
|
|
| Turnout |
5,140 |
46.4 |
|
| Bradwell[7] |
| Party |
Candidate |
Votes |
% |
±% |
|
Conservative |
Janet Goodison |
unopposed |
|
|
| Brailsford[7] |
| Party |
Candidate |
Votes |
% |
±% |
|
Conservative |
Carol Valentine |
unopposed |
|
|
| Calver[7] |
| Party |
Candidate |
Votes |
% |
±% |
|
Conservative |
Catherine Hunt |
575 |
72.2 |
|
|
Liberal Democrat |
Shirley Holt |
221 |
27.8 |
|
| Majority |
354 |
44.5 |
|
| Turnout |
796 |
49.5 |
|
| Carsington Water[7] |
| Party |
Candidate |
Votes |
% |
±% |
|
Conservative |
Lewis Rose |
468 |
77.7 |
|
|
Liberal Democrat |
Julia Pulman |
134 |
22.3 |
|
| Majority |
334 |
55.5 |
|
| Turnout |
602 |
40.2 |
|
| Chatsworth[7] |
| Party |
Candidate |
Votes |
% |
±% |
|
Conservative |
Michael Longden |
unopposed |
|
|
| Clifton & Bradley[7] |
| Party |
Candidate |
Votes |
% |
±% |
|
Conservative |
Ian Bates |
unopposed |
|
|
| Darley Dale (3 seats)[7] |
| Party |
Candidate |
Votes |
% |
±% |
|
Liberal Democrat |
David Burton |
1,051 |
|
|
|
Liberal Democrat |
David Fearn |
1,014 |
|
|
|
Liberal Democrat |
Sandra Fearn |
989 |
|
|
|
Conservative |
John Wall |
396 |
|
|
|
Conservative |
Howard Simpson-Birks |
395 |
|
|
|
Conservative |
Terence Kilburn |
344 |
|
|
|
Labour |
Fionntann Page |
184 |
|
|
| Turnout |
4,373 |
37.8 |
|
| Dovedale and Parwich[7] |
| Party |
Candidate |
Votes |
% |
±% |
|
Conservative |
Simon Spencer |
441 |
77.1 |
|
|
Labour |
Eric Page |
131 |
22.9 |
|
| Majority |
310 |
54.2 |
|
| Turnout |
572 |
46.0 |
|
| Doveridge and Sudbury[7] |
| Party |
Candidate |
Votes |
% |
±% |
|
Conservative |
Charles Brindley |
unopposed |
|
|
| Hartington & Taddington[7] |
| Party |
Candidate |
Votes |
% |
±% |
|
Conservative |
David Chapman |
364 |
74.0 |
|
|
Liberal Democrat |
Eleanor Nancolas |
128 |
26.0 |
|
| Majority |
236 |
48.0 |
|
| Turnout |
492 |
38.1 |
|
| Hathersage and Eyam (2 seats)[7] |
| Party |
Candidate |
Votes |
% |
±% |
|
Conservative |
Jacqueline Bevan |
unopposed |
|
|
|
Conservative |
David Hoskin |
unopposed |
|
|
| Hulland[7] |
| Party |
Candidate |
Votes |
% |
±% |
|
Conservative |
Jennifer Radford |
unopposed |
|
|
| Lathkill and Bradford[7] |
| Party |
Candidate |
Votes |
% |
±% |
|
Independent |
William Moore |
320 |
52.2 |
|
|
Conservative |
Andrew Howard |
293 |
47.8 |
|
| Majority |
27 |
4.4 |
|
| Turnout |
613 |
45.4 |
|
| Lutton and Longstone[7] |
| Party |
Candidate |
Votes |
% |
±% |
|
Conservative |
Robert Otter |
unopposed |
|
|
| Masson (2 seats)[7] |
| Party |
Candidate |
Votes |
% |
±% |
|
Labour |
John March |
395 |
|
|
|
Labour |
Nicholas Elliott |
328 |
|
|
|
Liberal Democrat |
Barbara Bowman |
248 |
|
|
|
Conservative |
Joanna Cochrane |
237 |
|
|
|
Liberal Democrat |
Janet Beckett |
236 |
|
|
|
Conservative |
Vivienne Smith |
230 |
|
|
| Turnout |
1,674 |
33.2 |
|
| Matlock All Saints (3 seats)[7] |
| Party |
Candidate |
Votes |
% |
±% |
|
Liberal Democrat |
David Barker |
914 |
|
|
|
Liberal Democrat |
Martin Burfoot |
897 |
|
|
|
Conservative |
Geoffrey Stevens |
867 |
|
|
|
Liberal Democrat |
Martyn Moss |
766 |
|
|
|
Conservative |
Melvyn Askew |
566 |
|
|
|
Conservative |
John Smith |
541 |
|
|
|
Independent |
Ann Elliott |
413 |
|
|
|
Independent |
Jacqueline Power |
262 |
|
|
| Turnout |
5,226 |
43.2 |
|
| Matlock St. Giles (3 seats)[7] |
| Party |
Candidate |
Votes |
% |
±% |
|
Liberal Democrat |
Stephen Flitter |
1,035 |
|
|
|
Liberal Democrat |
Anthony Allwood |
913 |
|
|
|
Liberal Democrat |
Ursula Lunn |
815 |
|
|
|
Conservative |
Diana Dakin |
703 |
|
|
|
Conservative |
Jacqueline Stevens |
692 |
|
|
|
Conservative |
Barrie Tipping |
665 |
|
|
|
Labour |
Tane Page |
229 |
|
|
| Turnout |
5,052 |
41.8 |
|
| Tideswell[7] |
| Party |
Candidate |
Votes |
% |
±% |
|
Conservative |
Tracy Critchlow |
282 |
50.9 |
|
|
Liberal Democrat |
Susan Barber |
272 |
49.1 |
|
| Majority |
10 |
1.8 |
|
| Turnout |
554 |
36.9 |
|
| Winster & South Darley[7] |
| Party |
Candidate |
Votes |
% |
±% |
|
Liberal Democrat |
Raymond Dring |
400 |
64.6 |
|
|
Conservative |
Jean Wall |
128 |
20.7 |
|
|
Labour |
Paul Tozer |
91 |
14.7 |
|
| Majority |
272 |
43.9 |
|
| Turnout |
619 |
52.0 |
|
By-elections between 2003 and 2007
All Saints Matlock
A by-election in All Saints Matlock was held on 27 November 2003 after the Liberal Democrat councillor Martin Burfoot was forced to resign after complaints of a conflict of interest due to his holding a position on the Peak District National Park Authority.[8] His wife Sue Burfoot held the seat for the Liberal Democrats.[8]
| All Saints Matlock by-election 27 November 2003[9][10][8] |
| Party |
Candidate |
Votes |
% |
±% |
|
Liberal Democrat |
Sue Burfoot |
678 |
54.0 |
+16.8 |
|
Conservative |
Jacquie Stevens |
578 |
46.0 |
+10.7 |
| Majority |
100 |
8.0 |
|
| Turnout |
1,256 |
29.0 |
|
|
Liberal Democrat hold |
Swing |
|
|
Litton and Longstone
Winster & South Darley
| Winster & South Darley by-election 20 April 2006[9] |
| Party |
Candidate |
Votes |
% |
±% |
|
Conservative |
Edward Moseley |
316 |
40.8 |
+20.1 |
|
Liberal Democrat |
George Edwards |
281 |
36.2 |
-28.4 |
|
Labour |
|
178 |
23.0 |
+8.3 |
| Majority |
35 |
4.6 |
|
| Turnout |
775 |
|
|
|
Conservative gain from Liberal Democrat |
Swing |
|
|
Lathkill & Bradford
| Lathkill & Bradford by-election 11 May 2006[9] |
| Party |
Candidate |
Votes |
% |
±% |
|
Independent |
|
unopposed |
|
|
|
Independent hold |
Swing |
|
|
References