Demographics of Uganda
This article is about the demographic features of the population of Uganda, including population density, ethnicity, education level, health of the populace, economic status, religious affiliations and other aspects of the population.
Population
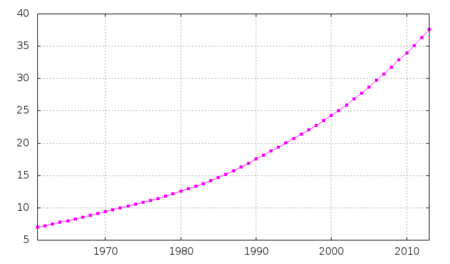
According to the 2010 revision of the World Population Prospects the total population was 33 425 000 in 2010, compared to only 5 158 000 in 1950. The proportion of children below the age of 15 in 2010 was 48.4%, 49.1% was between 15 and 65 years of age, while 2.5% was 65 years or older .[1]
| Total population (x 1000) | Population aged 0–14 (%) | Population aged 15–64 (%) | Population aged 65+ (%) | |
|---|---|---|---|---|
| 1950 | 5 158 | 43.1 | 54.0 | 3.0 |
| 1955 | 5 899 | 45.1 | 52.1 | 2.8 |
| 1960 | 6 788 | 45.9 | 51.5 | 2.6 |
| 1965 | 8 014 | 46.6 | 50.9 | 2.6 |
| 1970 | 9 446 | 46.9 | 50.5 | 2.6 |
| 1975 | 10 897 | 47.3 | 50.0 | 2.6 |
| 1980 | 12 662 | 47.6 | 49.7 | 2.6 |
| 1985 | 14 801 | 47.8 | 49.6 | 2.7 |
| 1990 | 17 700 | 48.0 | 49.3 | 2.7 |
| 1995 | 20 831 | 48.5 | 48.8 | 2.7 |
| 2000 | 24 213 | 48.7 | 48.6 | 2.7 |
| 2005 | 28 431 | 48.8 | 48.7 | 2.5 |
| 2010 | 33 425 | 49.1 | 48.4 | 2.5 |
UN Population Projections
Numbers are in thousands.
| UN medium var | 2050 | 94,259 |
Vital statistics
Registration of births and deaths in Uganda is not yet complete. The Population Division of the United Nations Department of Economic and Social Affairs prepared the following estimates. [1]
| Period | Live births per year | Deaths per year | Natural change per year | CBR* | CDR* | NC* | TFR* | IMR* |
|---|---|---|---|---|---|---|---|---|
| 1950-1955 | 283 000 | 135 000 | 148 000 | 51.3 | 24.5 | 26.8 | 6.90 | 160 |
| 1955-1960 | 317 000 | 139 000 | 178 000 | 50.0 | 22.0 | 28.0 | 6.95 | 145 |
| 1960-1965 | 365 000 | 144 000 | 220 000 | 49.3 | 19.5 | 29.8 | 7.05 | 130 |
| 1965-1970 | 428 000 | 152 000 | 276 000 | 49.0 | 17.4 | 31.6 | 7.12 | 116 |
| 1970-1975 | 494 000 | 156 000 | 338 000 | 48.6 | 15.3 | 33.3 | 7.10 | 103 |
| 1975-1980 | 573 000 | 187 000 | 386 000 | 48.7 | 15.9 | 32.8 | 7.10 | 106 |
| 1980-1985 | 673 000 | 222 000 | 451 000 | 49.0 | 16.2 | 32.8 | 7.10 | 108 |
| 1985-1990 | 802 000 | 269 000 | 533 000 | 49.4 | 16.6 | 32.8 | 7.10 | 108 |
| 1990-1995 | 955 000 | 353 000 | 602 000 | 49.6 | 18.3 | 31.3 | 7.06 | 110 |
| 1995-2000 | 1 096 000 | 410 000 | 686 000 | 48.7 | 18.2 | 30.4 | 6.95 | 105 |
| 2000-2005 | 1 261 000 | 416 000 | 845 000 | 47.9 | 15.8 | 32.1 | 6.75 | 91 |
| 2005-2010 | 1 433 000 | 408 000 | 1 026 000 | 46.3 | 13.2 | 33.2 | 6.38 | 79 |
| * CBR = crude birth rate (per 1000); CDR = crude death rate (per 1000); NC = natural change (per 1000); IMR = infant mortality rate per 1000 births; TFR = total fertility rate (number of children per woman) | ||||||||
Fertility and Births
Total Fertility Rate (TFR) and Crude Birth Rate (CBR):[2]
| Year | CBR (Total) | TFR (Total) | CBR (Urban) | TFR (Urban) | CBR (Rural) | TFR (Rural) |
|---|---|---|---|---|---|---|
| 1982-1984 | 7,4 | 6,1 | 7,6 | |||
| 1985-1988 | 7,4 | 5,7 | 7,6 | |||
| 1995 | 47,8 | 6,86 | 47,7 | 4,97 | 47,8 | 7,17 |
| 2000-2001 | 47,3 | 6,9 | 41,3 | 4,0 | 48,0 | 7,4 |
| 2006 | 44,8 | 6,7 | 41,0 | 4,4 | 45,3 | 7,1 |
| 2011 | 42,1 | 6,2 | 40,3 | 3,8 | 42,4 | 6,8 |
Ethnic Diversity

Africans mainly speaking languages of three families—Bantu, Nilotic, and Central Sudanic—constitute most of the population.
Bantu peoples are the most numerous and include the Baganda in the central area (17%), Basoga in the south-eastern area (10%), Banyankole in the south-western area (8%), Bakiga in the most south-western area (8%),Bagwere in the eastern area (4%), Banyoro in the mid-western area (3%), Batooro in the mid-western area (3%), Bagisu in the eastern area, Bahima in the south-western area (2%), Bafumbira in the south-western area (6%), and other much smaller ethnic groups.
Nilotic peoples, mainly in the north, are the next largest, including the Langi, 6%, and the Acholi, 4%. In the northwest are the Lugbara, 4%. The Karamojong, 2%, occupy the considerably drier, largely pastoral territory in the northeast. Europeans, Asians, and Arabs make up about 1% of the population with other groups accounting for the remainder.
More than half of the population is under the age of 15 – more than any other country in the world. Uganda's population is predominantly rural, and its population density highest in the southern regions.
South Asians and Arabs
During the Uganda Protectorate period, the British colonialists used South Asian immigrants as intermediaries. Following independence they constituted the largest non-indigenous ethnic group in Uganda, at around 80,000 people, and they dominated trade, industry, and the professions. This caused resentment among the Black majority, which was exploited by post-Independence leaders.
After Idi Amin came to power in 1971, he declared "economic war" on the Indians, culminating in the Expulsion of Asians in Uganda in 1972. Since Amin's overthrow in 1979 some Asians have returned. There are between 15,000 and 25,000 in Uganda today, nearly all in the capital Kampala.
There are also about 3,000 Arabs of various national origins in Uganda.
CIA World Factbook demographic statistics
The following demographic statistics are from the CIA World Factbook, unless otherwise indicated.[3]
Population
35,873,253.5 (July 2012 est.)
note:
estimates for this country explicitly take into account the effects of excess mortality due to AIDS; this can result in lower life expectancy, higher infant mortality and death rates, lower population and growth rates, and changes in the distribution of population by age and sex than would otherwise be expected.
Sex ratio
at birth:
1.03 male(s)/female
under 15 years:
1.01 male(s)/female
15-64 years:
1.01 male(s)/female
65 years and over:
0.7 male(s)/female
total population:
1.01 male(s)/female (2009 estimate)
Life expectancy at birth
total population:
52.72 years
male:
51.66 years
female:
53.81 years (2009 estimate)
Nationality
noun:
Ugandan
adjective:
Ugandan
Ethnic groups
Ganda 16.9%, Nkole 9.5%, Soga 8.4%, Kiga 6.9%, Teso 6.4%, Langi 6.1%, Acholi 4.7%, Gisu 4.6%, Lugbara 4.2%, Nyoro 2.7%, other 29.6% (2002 census)
Religions
(Alphabetically)
Anglican 35.9%
Baha'i 0.3%
Muslim 12.1%
None 0.9%
Pentecostal 4.6%
Roman Catholic 41.9%
Seventh-day Adventist 1.5%
Sikhism & other 3.1%
(2002 census)
Languages
English (official national language, taught in grade schools, used in courts of law and by most newspapers and some radio broadcasts), Swahili (recently made second official language, important regionally but spoken by very few people in Uganda) Luganda (most widely used of the Niger–Congo languages, preferred for native language publications in the capital and may be taught in school), other Bantu languages, Nilo-Saharan languages, and Arabic.
See also
References
- ↑ 1.0 1.1 Population Division of the Department of Economic and Social Affairs of the United Nations Secretariat, World Population Prospects: The 2010 Revision
- ↑ http://microdata.worldbank.org/index.php/catalog/dhs#_r=&collection=&country=&dtype=&from=1890&page=16&ps=&sk=&sort_by=nation&sort_order=&to=2014&topic=&view=s&vk=
- ↑ The World Factbook - Uganda
| |||||||||||||||||||||||||||||||||||||||||
| ||||||||||||||