Demographics of Libya
Demographics of Libya include population density, ethnicity, education level, health of the populace, economic status, religious affiliations and other aspects of the Libyan population.
No complete population or vital statistics registration exists in Libya. The estimates in this article are from the 2010 Revision of the World Population Prospects which was prepared by the Population Division of the Department of Economic and Social Affairs of the United Nations Secretariat, unless otherwise indicated.[1]

Population

Libya has a small population residing in a large land area. Population density is about 50 persons per km² (130/sq. mi.) in the two northern regions of Tripolitania and Cyrenaica, but falls to less than one person per km² (2.7/sq. mi.) elsewhere. Ninety percent of the people live in less than 10% of the area, primarily along the coast. About 88% of the population is urban, mostly concentrated in the four largest cities, Tripoli, Benghazi, Misrata and Bayda. Thirty percent of the population is estimated to be under the age of 15, but this proportion has decreased considerably during the past decades.
| Total population (x 1000) | Population aged 0–14 (%) | Population aged 15–64 (%) | Population aged 65+ (%) | |
|---|---|---|---|---|
| 1950 | 6 029 | 41.9 | 53.4 | 4.7 |
| 1955 | 6 126 | 43.0 | 52.7 | 4.3 |
| 1960 | 6 349 | 43.3 | 52.7 | 4.0 |
| 1965 | 6 623 | 43.4 | 53.0 | 3.6 |
| 1970 | 6 994 | 45.2 | 52.1 | 2.7 |
| 1975 | 7 066 | 46.5 | 51.3 | 2.2 |
| 1980 | 7 193 | 47.0 | 50.7 | 2.2 |
| 1985 | 7 750 | 47.3 | 50.5 | 2.3 |
| 1990 | 7 834 | 43.5 | 53.9 | 2.6 |
| 1995 | 7 975 | 38.3 | 58.8 | 2.9 |
| 2000 | 8 231 | 32.4 | 64.2 | 3.4 |
| 2005 | 8 970 | 30.6 | 65.6 | 3.8 |
| 2010 | 9 655 | 30.4 | 65.3 | 4.3 |
Population census
Eight population censuses have been carried out in Libya, the first in 1931 and the most recent one in 2006.[2][3] The population sixfolded between 1931 and 2006.
| Year | Males (thousands) | Females (thousands) | Total population (thousands) | Average annual growth rate (%) |
|---|---|---|---|---|
| 1931 | 704 | |||
| 1936 | 463 | 386 | 849 | 3.8 |
| 1954 | 564 | 524 | 1,089 | 1.4 |
| 1964 (July 31) | 813 | 751 | 1,564 | 3.7 |
| 1973 (July 31) | 1,192 | 1,057 | 2,249 | 4.1 |
| 1984 (July 31) | 1,954 | 1,689 | 3,643 | 4.5 |
| 1995 (August 11) | 2,237 | 2,168 | 4,405 | 1.7 |
| 2006 (April 15) | 2,934 | 2,723 | 5,658 | 2.3 |
Vital statistics
During the past 60 years the demographic situation of Libya changed considerably. Since the 1950s, life expectancy increased steadily and the infant mortality rates decreased. As the fertility rates remained high until the 1980s (the number of births tripled between 1950–55 and 1980–85), population growth was very high for three decades. However, after 1985 a fast decrease in fertility was observed from over 7 children per woman in the beginning of the 1980s to less than 3 in 2005-2010. Because of this decrease in fertility the population growth slowed down and also the proportion of Libyans under the age of 15 decreased from 47% in 1985 to 30% in 2010.
Births and deaths
| Period | Births | Deaths | Difference | CBR* | CDR* | NC* | IMR* | TFR* |
|---|---|---|---|---|---|---|---|---|
| 1950–1955 | 52.000 | 24.000 | 28.000 | 48,0 | 22,5 | 25,5 | 185 | 6,87 |
| 1955–1960 | 60.000 | 25.000 | 35.000 | 48,5 | 19,9 | 28,6 | 170 | 6,97 |
| 1960–1965 | 73.000 | 27.000 | 46.000 | 49,0 | 18,3 | 30,7 | 150 | 7,18 |
| 1965–1970 | 90.000 | 30.000 | 60.000 | 49,5 | 16,8 | 32,7 | 125 | 7,48 |
| 1970–1975 | 109.000 | 33.000 | 76.000 | 49,0 | 14,8 | 34,2 | 105 | 7,59 |
| 1975–1980 | 131.000 | 35.000 | 96.000 | 47,3 | 12,7 | 34,6 | 68 | 7,38 |
| 1980–1985 | 158.000 | 38.000 | 120.000 | 45,6 | 10,9 | 34,7 | 50 | 7,18 |
| 1985–1990 | 123.000 | 22.000 | 101.000 | 29,9 | 5,3 | 24,6 | 38,0 | 5,65 |
| 1990–1995 | 113.000 | 20.000 | 93.000 | 24,7 | 4,5 | 20,2 | 28,3 | 4,10 |
| 1995–2000 | 115.000 | 20.000 | 95.000 | 23,0 | 4,0 | 19,0 | 20,5 | 3,25 |
| 2000–2005 | 134.000 | 22.000 | 112.000 | 24,3 | 4,0 | 20,3 | 17,7 | 3,00 |
| 2005–2010 | 145.000 | 24.000 | 121.000 | 24,0 | 4,0 | 20,0 | 15,0 | 2,72 |
Life expectancy at birth
- 1950-1955: 42.85 years
- 1955-1960: 45.4 years
- 1960-1965: 48.1 years
- 1965-1970: 50.5 years
- 1970-1975: 52.8 years
- 1975-1980: 56.45 years
- 1980-1985: 60.2 years
- 1985-1990: 63.5 years
- 1990-1995: 65.85 years
- 1995-2000: 67.2 years
- 2000-2005: 68.8 years
- 2005-2010: 69.9 years
CIA World Factbook demographic statistics
The following demographic statistics are from the CIA World Factbook, unless otherwise indicated.[4]
Vital statistics
Population
- 5,613,380 (July 2012 est.)
Age structure
- 0-14 years: 27.7% (male 795,748/ female 759,806)
- 15-64 years: 68.4% (male 2,006,059/ female 1,834,119)
- 65 years and over: 3.9% (male 111,144/ female 106,504) (2012 est.)
Median age
- total: 24.8 years
- male: 24.8 years
- female: 24.7 years (2011 est.)
Population growth rate
- 2.007% (2012 est.)
Birth rate
- 17.5 births/1,000 population (2012 est.)
Death rate
- 4.9 deaths/1,000 population (July 2012 est.)
Net migration rate
- 0 migrant(s)/1,000 population (2012 est.)
Total fertility rate
- 3.71 children born/woman (2000 est.)
- 3.01 children born/woman (2010 est.)
- 2.12 children born/woman (2012 est.)
Urbanization
- urban population: 78% of total population (2010)
- rate of urbanization: 2.1% annual rate of change (2010-15 est.)
Sex ratio
- at birth: 1.05 male(s)/female
- under 15 years: 1.04 male(s)/female
- 15-64 years: 1.06 male(s)/female
- 65 years and over: 0.96 male(s)/female
- total population: 1.05 male(s)/female (2012 est.)
Infant mortality rate
- total: 12.7 deaths/1,000 live births
- male: 13.7 deaths/1,000 live births
- female: 11.6 deaths/1,000 live births (2012 est.)
Life expectancy at birth
- total population: 77.83 years
- male: 75.5 years
- female: 80.27 years (2012 data)
Ethnic and tribal groups
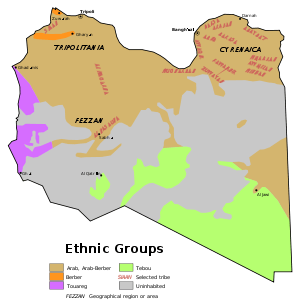
Ethnic groups
The native population of Libya is primarily Arab or a mixture of Arab-Berber ethnicities, with a small minority of Berber-speaking tribal groups concentrated in northwest part of Tripolitania, Tuareg and Toubou tribes can be found in southern Libya, which are nomadic or semi-nomadic. Most of the Libyans claim descent from the Bedouin Arab tribes of the Banu Hilal and the Banu Sulaym, who invaded the Maghreb in the 11th century. There is also some Punic admixture, and a curious traditional element from the Romanized Punics such as the Roman toga can be seen in Tripoli's people and was used by Muammar Gaddafi himself.
In the west of the country, there are some Tuareg nomads, mobile across the Libyan-Algerian border. Tuaregs are also scattered over Algeria, Mali, Niger and Burkina Faso.
In the southeast, there are small populations of the Nilo-Saharan Toubou (Tibbu), although they occupy between a quarter and a third of the country and who also inhabit Niger and Chad.
Among foreign residents, the largest groups are from other African nations, including citizens of other North African nations (primarily Egyptians) as well as sub-Saharan Africans.
Tribal groups
Libyan society is to a large extent structured along tribal lines, with more than 20 major tribal groups. The major tribal groups of Libya are:[5]
- Tripolitania: Al-Awager - ALUAGER Warfalla, Tarhona, Wershifana, Al-Fwatir, Awlad Busayf, Al-Zintan, Al-Rijban, Zuwarah.
- Cyrenaica: Al-Awagir, Al-Abaydat, Drasa, Al-Barasa, Al-Fawakhir, Al-Zuwayya, Al-Majabra, Al-Msmare.
- Sirte: Al-Qaddadfa, Al-Magarha, Al-Magharba, Al-Riyyah, Al-Haraba, Al-Zuwaid, Al-Guwaid.
- Fezzan: Al-Hutman, Al-Hassawna; Toubou, Tuareg.
- Kufra: Al-Zuwayya; Toubou.
Foreign population
Foreign population is estimated at 3%, mostly migrant workers in the oil industry from Tunisia and Egypt, but also including small numbers of Greeks, Maltese, Italians, Pakistanis, Palestinians, Turks, Indians and people from former Yugoslavia. Due to the Libyan Civil War, most of these migrant workers have returned to their homelands or simply left the country for a different one.
However, according to news accounts in Allafrica.com, and the Libya Herald, between 1 million and 2 million Egyptians are resident in Libya and Sudanese number in the hundreds of thousands. If this is correct, the foreign population could be as high as 30% of the country, as simultaneously at least two million Libyans have fled since the NATO intervention of 2011, toppling the previous Libyan government.
Genetics
Listed here are the human Y-chromosome DNA haplogroups in Libya.[6]
| Hg | Libya (n=215) |
| E-M81 | 35.88% |
| J-M267 | 30.53% |
| E-M78 | 11.07% |
| E-M2 | 8.78% |
| G-M201 | 4.20% |
| J-M172 | 3.44% |
| R* | 3.43% |
| E-M123 | 1.53% |
| E* | 0.76% |
| R-M17 | 0.38% |
Languages
The official language of Libya is Standard Arabic. The prevalent spoken language is Libyan Arabic, spoken by about 6 million Libyans, besides other Arabic dialects (partly spoken by immigrant workers, partly by native populations), viz. Egyptian Arabic, Moroccan Arabic, Sudanese Arabic, Tunisian Arabic, Ta'izzi-Adeni Arabic, South Levantine Arabic and Hassaniyya Arabic, amounting to a total number of first-language Arabic speakers of about 95% of total population.
SIL Ethnologue estimates for indigenous minority languages in Libya:[7]
- Berber languages: ca. 305,000 speakers, mainly concentrated in Tripolitania.
- Nafusi and Zuwara Berber: 184,000 (2006) constitutes a majority.
- Tamahaq: 47,000 (2006)
- Ghadamès: 30,000 (2006)
- Sawknah: 5,600 (2006)
- Awjilah: 3,000 (2000)
- Domari: ca. 33,000 speakers (2006)
- Tedaga: 2,000
Non-Arabic languages spoken by temporary foreign workers include (with more than 10,000 speakers each): Punjabi, Urdu, Mandarin, Cantonese, Korean, Sinhala, Bengali, Tamil, Tagalog, French, Italian, Ukrainian, Serbian, English.
Religions
Almost all Libyans are Sunni Muslim.
Foreigners contribute very little Christian presence, but there are some churches. A small Jewish community historically lived in Libya since antiquity (see History of the Jews in Libya), but the entire Jewish community in Libya eventually fled the country for Italy, Israel, or the United States, particularly after anti-Jewish riots in the wake of the 1967 Six-Day War between Arab countries and Israel.
See also
References
- ↑ World Population Prospects: The 2010 Revision
- ↑ B.R. Mitchell. International historical statistics: Africa, Asia & Oceania 1750-2000.
- ↑ United nations. Demographic Yearbooks 1948-2008
- ↑ CIA - The World Factbook -- Libya
- ↑ Jon Hemming, Tribal ties key to Gaddafi rule, Reuters (2011)
- ↑ Karima Fadhlaoui-Zid et al. (2013) Genome-Wide and Paternal Diversity Reveal a Recent Origin of Human Populations in North Africa. PLoS One. 2013; 8(11): e80293. See Table S2
- ↑ Ethnologue report for Libya, Languages of Libya
| ||||||||||||||||||||||||||||||||||
| ||||||||||||||