Demographics of El Salvador
| Demographics of El Salvador | |
|---|---|
 | |
 | |
 | |
|
A contrast of Salvadoran children during the civil war and modern day Salvadoran children' | |
| Population | 6,071,774 (2011 est.)[1] |
| Male population | 3,440,918 |
| Female population | 3,625,485 |
| Population growth | 1.68% |
| Birth rate | 25.72/1,000 |
| Death rate | 5.53/1,000 |
| Infant mortality rate | 22.19/1,000 |
| Life expectancy | 73.44 years[2] |
| Nationality | Salvadoran |
| Demographic bureaus | INEC |

This article is about the demographic features of the population of El Salvador, including population density, ethnicity, education level, health of the populace, economic status, religious affiliations and other aspects of the population.
El Salvador's population numbers about 6,071,774 with 86% of Salvadorans are mixed (mixed Indigenous Native American and European Spanish origin by majority, who quickly cluster with tri-racial Pardo Salvadorans of Indigenous, Spanish and African mixed heritage, Afro-Mestizos who culturally identify themselves as Mestizo. The Salvadorans of mixed ancestry vary in their Native American Indigenous, European and even African ancestry.[3]
Population
According to the 2012 revison of the World Population Prospects the total population was 6,218,000 in 2010, compared to only 2,200,000 in 1950.[4] However, as shown by the chart to the right, the data are very imprecise -- in fact, the breakdown of population by gender is over a million more than the given total population. Despite a threefold increase between 1950 and 2010, the increase in population was less than in many other countries in Central America. The total impact of civil wars, dictatorships and socioeconomics drove over a million Salvadorans (both as immigrants and refugees) into the US; in addition small Salvadoran communities sprung up in Canada, Panama, Costa Rica, Europe and Australia since the migration trend began in the early 1970s. The 2010 U.S. Census counted 1,648,968 Salvadorans in the United States, up from 655,165 in 2000.[5] The proportion of children below the age of 15 in 2010 was 32.1%, 61% was between 15 and 65 years of age, while 6.9% was 65 years or older.
| Total population (x 1000) |
Proportion aged 0–14 (%) |
Proportion aged 15–64 (%) |
Proportion aged 65+ (%) | |
|---|---|---|---|---|
| 1950 | 2 200 | 42.7 | 53.3 | 4.0 |
| 1955 | 2 433 | 43.6 | 52.6 | 3.8 |
| 1960 | 2 773 | 45.1 | 51.1 | 3.7 |
| 1965 | 3 244 | 46.3 | 50.1 | 3.7 |
| 1970 | 3 736 | 46.4 | 49.9 | 3.6 |
| 1975 | 4 232 | 45.8 | 50.5 | 3.7 |
| 1980 | 4 661 | 45.2 | 50.9 | 3.9 |
| 1985 | 5 004 | 44.1 | 51.8 | 4.2 |
| 1990 | 5 344 | 41.7 | 53.7 | 4.6 |
| 1995 | 5 748 | 39.6 | 55.5 | 4.9 |
| 2000 | 5 959 | 38.3 | 56.2 | 5.5 |
| 2005 | 6 073 | 35.7 | 58.1 | 6.2 |
| 2010 | 6 218 | 32.1 | 61.0 | 6.9 |
Population distribution
The capital city of San Salvador and the other thirteen municipalities that have joined as a metropolitan area have a population of 2.3 million people[6]
Vital statistics
UN estimates
The Population Department of the United Nations prepared the following estimates. [4]
| Period | Live births per year |
Deaths per year |
Natural change per year |
CBR* | CDR* | NC* | TFR* | IMR* | Life expectancy total |
Life expectancy males |
Life expectancy females |
|---|---|---|---|---|---|---|---|---|---|---|---|
| 1950-1955 | 108 000 | 48 000 | 61 000 | 46.7 | 20.6 | 26.1 | 6.30 | 147 | 45.1 | 43.4 | 46.8 |
| 1955-1960 | 125 000 | 46 000 | 78 000 | 47.8 | 17.8 | 30.0 | 6.60 | 132 | 49.3 | 47.2 | 51.5 |
| 1960-1965 | 144 000 | 47 000 | 97 000 | 47.7 | 15.5 | 32.3 | 6.76 | 119 | 53.0 | 50.5 | 55.7 |
| 1965-1970 | 156 000 | 47 000 | 109 000 | 44.8 | 13.5 | 31.3 | 6.43 | 109 | 55.6 | 52.6 | 58.9 |
| 1970-1975 | 168 000 | 49 000 | 119 000 | 42.1 | 12.3 | 29.8 | 5.95 | 100 | 57.0 | 53.2 | 61.2 |
| 1975-1980 | 177 000 | 52 000 | 124 000 | 39.7 | 11.8 | 27.9 | 5.46 | 91 | 57.0 | 51.9 | 62.7 |
| 1980-1985 | 174 000 | 55 000 | 119 000 | 36.1 | 11.4 | 24.7 | 4.80 | 77 | 56.9 | 50.6 | 64.2 |
| 1985-1990 | 171 000 | 44 000 | 126 000 | 33.0 | 8.6 | 24.4 | 4.20 | 56 | 63.1 | 57.4 | 69.1 |
| 1990-1995 | 169 000 | 37 000 | 132 000 | 30.5 | 6.8 | 23.8 | 3.73 | 38 | 68.0 | 63.3 | 72.9 |
| 1995-2000 | 161 000 | 38 000 | 123 000 | 27.5 | 6.6 | 20.9 | 3.30 | 27 | 69.2 | 64.4 | 73.9 |
| 2000-2005 | 133 000 | 39 000 | 94 000 | 22.0 | 6.4 | 15.6 | 2.60 | 23 | 70.2 | 65.4 | 74.9 |
| 2005-2010 | 127 000 | 40 000 | 87 000 | 20.7 | 6.5 | 14.2 | 2.35 | 21 | 71.3 | 66.5 | 75.9 |
| * CBR = crude birth rate (per 1000); CDR = crude death rate (per 1000); NC = natural change (per 1000); IMR = infant mortality rate per 1000 births; TFR = total fertility rate (number of children per woman) | |||||||||||
Registerd data[7]
| Average population (x 1000) | Live births | Deaths | Natural change | Crude birth rate (per 1000) | Crude death rate (per 1000) | Natural change (per 1000) | |
|---|---|---|---|---|---|---|---|
| 1950 | 2 200 | 90 557 | 27 454 | 63 103 | 41.2 | 12.5 | 28.7 |
| 1951 | 2 237 | 93 634 | 29 030 | 64 604 | 41.8 | 13.0 | 28.9 |
| 1952 | 2 280 | 96 802 | 32 423 | 64 379 | 42.5 | 14.2 | 28.2 |
| 1953 | 2 327 | 98 474 | 30 280 | 68 194 | 42.3 | 13.0 | 29.3 |
| 1954 | 2 378 | 102 009 | 31 810 | 70 199 | 42.9 | 13.4 | 29.5 |
| 1955 | 2 433 | 105 040 | 31 151 | 73 889 | 43.2 | 12.8 | 30.4 |
| 1956 | 2 491 | 106 539 | 28 127 | 78 412 | 42.8 | 11.3 | 31.5 |
| 1957 | 2 553 | 114 929 | 32 893 | 82 036 | 45.0 | 12.9 | 32.1 |
| 1958 | 2 621 | 115 154 | 32 831 | 82 323 | 43.9 | 12.5 | 31.4 |
| 1959 | 2 694 | 115 622 | 30 038 | 85 584 | 42.9 | 11.1 | 31.8 |
| 1960 | 2 773 | 121 403 | 28 768 | 92 635 | 43.8 | 10.4 | 33.4 |
| 1961 | 2 859 | 124 871 | 28 471 | 96 400 | 43.7 | 10.0 | 33.7 |
| 1962 | 2 951 | 127 154 | 30 342 | 96 812 | 43.1 | 10.3 | 32.8 |
| 1963 | 3 047 | 133 395 | 29 614 | 103 781 | 43.8 | 9.7 | 34.1 |
| 1964 | 3 145 | 133 072 | 29 496 | 103 576 | 42.3 | 9.4 | 32.9 |
| 1965 | 3 244 | 137 430 | 30 906 | 106 524 | 42.4 | 9.5 | 32.8 |
| 1966 | 3 342 | 137 950 | 30 368 | 107 582 | 41.3 | 9.1 | 32.2 |
| 1967 | 3 440 | 139 955 | 28 957 | 110 998 | 40.7 | 8.4 | 32.2 |
| 1968 | 3 537 | 140 986 | 29 863 | 111 123 | 39.8 | 8.4 | 31.4 |
| 1969 | 3 636 | 142 699 | 33 655 | 109 044 | 39.2 | 9.2 | 29.9 |
| 1970 | 3 736 | 141 471 | 35 094 | 106 377 | 37.8 | 9.4 | 28.4 |
| 1971 | 3 836 | 154 309 | 28 752 | 125 557 | 40.2 | 7.5 | 32.7 |
| 1972 | 3 938 | 153 464 | 32 383 | 121 081 | 38.9 | 8.2 | 30.7 |
| 1973 | 4 038 | 155 632 | 31 865 | 123 767 | 38.5 | 7.9 | 30.6 |
| 1974 | 4 137 | 158 524 | 30 494 | 128 030 | 38.3 | 7.4 | 30.9 |
| 1975 | 4 232 | 159 731 | 31 601 | 128 130 | 37.7 | 7.5 | 30.3 |
| 1976 | 4 325 | 165 822 | 30 826 | 134 996 | 38.3 | 7.1 | 31.2 |
| 1977 | 4 414 | 177 531 | 33 009 | 144 522 | 40.2 | 7.5 | 32.7 |
| 1978 | 4 500 | 172 897 | 30 086 | 142 811 | 38.4 | 6.7 | 31.7 |
| 1979 | 4 582 | 174 183 | 32 936 | 141 247 | 38.0 | 7.2 | 30.8 |
| 1980 | 4 661 | 169 930 | 38 967 | 130 963 | 36.4 | 8.4 | 28.1 |
| 1981 | 4 734 | 163 305 | 37 468 | 125 837 | 34.5 | 7.9 | 26.6 |
| 1982 | 4 805 | 156 796 | 33 284 | 123 512 | 32.6 | 6.9 | 25.7 |
| 1983 | 4 872 | 144 193 | 32 697 | 111 496 | 29.6 | 6.7 | 22.9 |
| 1984 | 4 938 | 142 202 | 28 854 | 113 348 | 28.8 | 5.8 | 23.0 |
| 1985 | 5 004 | 139 514 | 27 225 | 112 289 | 27.9 | 5.4 | 22.5 |
| 1986 | 5 069 | 145 126 | 25 731 | 119 395 | 28.7 | 5.1 | 23.6 |
| 1987 | 5 134 | 148 355 | 27 581 | 120 774 | 28.9 | 5.4 | 23.6 |
| 1988 | 5 200 | 149 299 | 27 774 | 121 525 | 28.8 | 5.4 | 23.4 |
| 1989 | 5 269 | 151 859 | 27 768 | 124 091 | 28.9 | 5.3 | 23.6 |
| 1990 | 5 344 | 148 360 | 28 195 | 120 165 | 27.8 | 5.3 | 22.5 |
| 1991 | 5 425 | 151 210 | 27 066 | 124 144 | 27.9 | 5.0 | 22.9 |
| 1992 | 5 511 | 154 014 | 27 869 | 126 145 | 27.9 | 5.1 | 22.9 |
| 1993 | 5 597 | 168 000 | 38 000 | 130 000 | 30.0 | 6.8 | 23.2 |
| 1994 | 5 678 | 160 772 | 29 407 | 131 365 | 28.3 | 5.2 | 23.1 |
| 1995 | 5 748 | 159 336 | 29 130 | 130 206 | 27.7 | 5.1 | 22.7 |
| 1996 | 5 807 | 163 007 | 28 904 | 134 103 | 28.1 | 5.0 | 23.1 |
| 1997 | 5 855 | 164 143 | 29 118 | 135 025 | 28.0 | 5.0 | 23.1 |
| 1998 | 5 895 | 158 350 | 29 919 | 128 431 | 26.9 | 5.1 | 21.8 |
| 1999 | 5 929 | 153 636 | 28 056 | 125 580 | 25.9 | 4.7 | 21.2 |
| 2000 | 5 959 | 150 176 | 28 154 | 122 022 | 25.2 | 4.7 | 20.5 |
| 2001 | 5 985 | 138 354 | 29 959 | 108 395 | 23.1 | 5.0 | 18.1 |
| 2002 | 6 008 | 129 363 | 27 458 | 101 905 | 21.5 | 4.6 | 17.0 |
| 2003 | 6 029 | 124 476 | 29 377 | 95 099 | 20.6 | 4.9 | 15.8 |
| 2004 | 6 050 | 119 710 | 30 058 | 89 652 | 19.8 | 5.0 | 14.8 |
| 2005 | 6 073 | 112 769 | 30 933 | 81 836 | 18.6 | 5.1 | 13.5 |
| 2006 | 6 097 | 107 111 | 31 453 | 75 658 | 17.6 | 5.2 | 12.4 |
| 2007 | 6 123 | 106 471 | 31 349 | 75 122 | 17.4 | 5.1 | 12.3 |
| 2008 | 6 152 | 111 278 | 31 594 | 79 684 | 18.1 | 5.1 | 13.0 |
| 2009 | 6 183 | 107 880 | 32 872 | 75 008 | 17.4 | 5.3 | 12.1 |
| 2010 | 6 218 | 104 939 | 32 586 | 72 353 | 16.9 | 5.2 | 11.6 |
| 2011 | 6 256 | 109 384 | 33 211 | 76 173 | 17.5 | 5.3 | 12.2 |
Ethnic groups
12.7% of Salvadorans are white; population is mostly of Spanish, while there is also of French, German, Swiss, English, Irish, Italian, Swedish, Norwegian, Dutch and Danish descent. The majority of Central European immigrants arrived during World War II as refugees Czech Republic, Germany, Hungary, Poland, and Switzerland are scattered in different communities of El Salvador. About 1% is of full indigenous origin (Pipil and Lenca). Very few Amerindians have retained their customs and traditions, having over time assimilated into the dominant Mestizo/Spanish culture. In the Mestizo population, Salvadorans who are racially European, especially Mediterranean, as well as Afro-Salvadoran, and the indigenous people in El Salvador who do not speak indigenous languages or have and indigenous culture, all identify themselves as Mestizo culturally.[8]
The low numbers of indigenous people may be partly explained by mass murder during the 1932 Salvadoran peasant uprising (or La Matanza) which saw (estimates of) up to 30,000 peasants killed in a short period of time (nowadays this would be considered a genocide by the army's methods to exterminate a certain racial group). Many authors note that since La Matanza the indigenous in El Salvador have been very reluctant to describe themselves as such (in census declarations for example) or to wear indigenous dress or be seen to be taking part in any cultural activities or customs that might be understood as indigenous.[9]
There is a significant population of immigrants from Palestine (especially from the area of Bethlehem) and China. There is also a small community of Jews and Muslims. A small portion of Salvadorans have Arab descent not only from Palestine but also from other Middle East and North African countries like Lebanon, Syria, Morocco.
Language
Spanish is the language spoken by virtually all inhabitants.
Religion
Catholicism is the majority religion in El Salvador at 57.1%.[2] Protestant groups compromise 21.2% of the population.[2] Individual groups that constitute less than 5 percent of the population include Jehovah's Witnesses 1.9%, and Latter-day Saints 0.7%.[2] A sizable 16.8% population claim no religious affiliation in El Salvador.[2]


Cities and metropolitan areas
CIA World Factbook demographic statistics
| Ethnic groups | |
|---|---|
| Salvadoran women | |
| Group | Number |
| Mestizo (86%) | 4,210,000 |
| White (12%) | 621,000 |
| Native American (1%) | 69,000 |
| Source: CDI (2006) | |

The following demographic statistics are from the CIA World Factbook, unless otherwise indicated.
Population
- 6,071,774 (July 2011 est.)
2013 6.3 million
Ethnic groups
- Mestizo: 86%
- White: 12.7%
- Native American: >1% The very low numbers of Native indigenous people may be explained by mass murder during the 1932 Salvadoran peasant uprising (or La Matanza) which saw (estimates of) up to 30,000 peasants killed in a short period of time (nowadays this would be considered a genocide by the army's methods to exterminate a certain racial group)[10] The Native American population consists primary of Pipils and Lencas (the latter confined to the Eastern regions of the country) although smaller communities of Kakawira and Xinca also exist.
Religions
- Roman Catholic: 57.1%%
- Protestant: 21.2%%
- No Affiliation: 16.8%
Languages
Spanish (official), Salvadoran Sign Language, Pipil (Nawat) , Kekchí. Immigrant languages include Chinese, Turkish, Poqomam, and American Sign Language.[11]
Literacy
- definition: age 10 and over can read and write
- total: 95.0%[12]
- male: 94.4%
- female: 95.5%
- urban: 97.2%
- rural: 91.8%
Gallery
-

Salvadoran boy during the civil war, one of many Salvadoran children refugees.
-

Salvadoran boys during the civil war, of many Salvadoran children refugees.
-

Salvadoran girl during the civil war, one of many Salvadoran children refugees
-

Salvadoran girl during the civil war, one of many Salvadoran children refugees
-

Salvadoran boys and girls during the civil war, of many Salvadoran children refugees
-

Salvadoran boys during the civil war, of many Salvadoran children refugees
-

Salvadoran boys during the civil war, of many Salvadoran children refugees
-

Salvadoran boys during the civil war, of many Salvadoran children refugees
-
_28%2C_helps_Salvadoran.jpg)
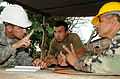
Salvadoran men building class bench for children
-
-

Salvadoran women, beauty queen Irma Dimas
-
See also
- El Salvador
- Ethnic groups in Central America
- History of the Jews in El Salvador
- Religion in El Salvador
References
- ↑ "Cia World Factbook 2008: El Salvador". Retrieved 2011-04-25.
- ↑ 2.0 2.1 2.2 2.3 2.4
- ↑ 3.0 3.1 CIA - The World Factbook - El Salvador
- ↑ 4.0 4.1 Population Division of the Department of Economic and Social Affairs of the United Nations Secretariat, World Population Prospects: The 2012 Revision
- ↑ http://factfinder2.census.gov/
- ↑
- ↑ United nations. Demographic Yearbooks
- ↑ EL SALVADOR Visa Application - Tourist Visas, Business Visas, Expedited Visas - El Salvador Page
- ↑ Military Rule, 1931-1979 - History - El Salvador - Central America: 1979 history, center poverty, cause condition, party pdc, soccer war
- ↑ http://www.soitu.es/soitu/2008/08/09/info/1218307640_720352.html
- ↑
- ↑ http://hdr.undp.org/en/reports/nationalreports/latinamericathecaribbean/elsalvador/IDHES_2007-2008_ElSalvador.pdf
| |||||||||||||||||||||||||||||||||||||||||
| ||||||||||