Demographics of Egypt
| Life in Egypt |
|---|
 |
| Culture |
| Demography |
| Politics |
| Wildlife |
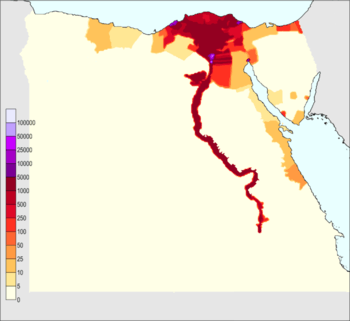
Egypt is the most populous country in the Middle East and the third-most populous on the African continent (after Nigeria and Ethiopia). Nearly 100% of the country's 82.5 million[1] (2012 est.) people live in three major regions of the country: Cairo and Alexandria and elsewhere along the banks of the Nile throughout the Nile Delta, which fans out north of Cairo; and along the Suez Canal. These regions are among the world's most densely populated, containing an average of over 3,820 persons per square mile (1,540 per km².), as compared to 181 persons per sq. mi. for the country as a whole.
Small communities spread throughout the desert regions of Egypt are clustered around oases and historic trade and transportation routes. The government has tried with mixed success to encourage migration to newly irrigated land reclaimed from the desert. However, the proportion of the population living in rural areas has continued to decrease as people move to the cities in search of employment and a higher standard of living.
According to the Peterson Institute for International Economics and other proponents of demographic structural approach (cliodynamics), the basic problem Egypt has is unemployment driven by a demographic youth bulge: with the number of new people entering the job force at about 4% a year, unemployment in Egypt is almost 10 times as high for college graduates as it is for people who have gone through elementary school, particularly educated urban youth, who comprised most of the people that were seen out in the streets during the Egyptian Revolution of 2011. An estimated 75% of Egyptians are under the age of 25 with just 3% over the age of 65, making it one of the most youthful populations in the world.[2][3]
Population


| Historical populations in thousands | ||
|---|---|---|
| Year | Pop. | ±% p.a. |
| 1805 | 4,000 | — |
| 1882 | 6,712 | +0.67% |
| 1897 | 9,669 | +2.46% |
| 1907 | 11,190 | +1.47% |
| 1917 | 12,718 | +1.29% |
| 1927 | 14,178 | +1.09% |
| 1937 | 15,921 | +1.17% |
| 1947 | 18,967 | +1.77% |
| 1960 | 26,085 | +2.48% |
| 1966 | 30,076 | +2.40% |
| 1976 | 36,626 | +1.99% |
| 1986 | 48,254 | +2.80% |
| 1996 | 59,312 | +2.08% |
| 2006 | 72,798 | +2.07% |
| 2013 | 84,314 | +2.12% |
| Source: Population in Egypt[4] | ||
Egypt has a population of 84 million (22/2/2014).[5] According to the OECD/World Bank statistics population growth in Egypt from 1990 to 2008 was 23.7 million and 41%.[6]
Age distribution
Percentage Distribution of Population in Censuses by Age Group
| Age group | 2006 | 1996 | 1986 | 1976 |
|---|---|---|---|---|
| Less than 5 years old | 10.6 | 11.6 | 15.3 | 13.9 |
| 5- | 10.5 | 12.9 | 13.2 | 12.8 |
| 10- | 10.6 | 13.3 | 11.6 | 13.4 |
| 15- | 11.8 | 11.6 | 10.6 | 10.9 |
| 20- | 10.8 | 8.6 | 8.9 | 8.4 |
| 25- | 8.8 | 7.4 | 7.7 | 7.3 |
| 30- | 6.5 | 6.7 | 6.4 | 5.8 |
| 35- | 6.4 | 6.5 | 6.1 | 5.6 |
| 40- | 5.6 | 5.3 | 4.4 | 5.1 |
| 45- | 5.1 | 4.5 | 4.0 | 4.2 |
| 50- | 4.2 | 3.4 | 3.5 | 4.0 |
| 55- | 3.1 | 2.5 | 2.6 | 2.4 |
| 60- | 2.3 | 2.4 | 2.4 | 2.7 |
| 65- | 1.6 | 1.6 | 1.4 | 1.4 |
| 70- | 1.1 | 1.0 | 1.1 | 1.2 |
| 75+ | 1.0 | 0.8 | 0.8 | 1.0 |
Population Estimates by Sex and Age Group (01/07/2010) :
| Age group | Male | Female | % | Total |
|---|---|---|---|---|
| Less than 5 years old | 4,282 | 4,072 | 10.6 | 8,354 |
| 5- | 4,265 | 4,007 | 10.5 | 8,272 |
| 10- | 4,330 | 4,023 | 10.6 | 8,353 |
| 15- | 4,738 | 4,501 | 11.7 | 9,239 |
| 20- | 4,358 | 4,155 | 10.8 | 8,513 |
| 25- | 3,412 | 3,498 | 8.8 | 6,910 |
| 30- | 2,614 | 2,503 | 6.5 | 5,117 |
| 35- | 2,498 | 2,536 | 6.4 | 5,034 |
| 40- | 2,237 | 2,186 | 5.6 | 4,423 |
| 45- | 2,029 | 1,942 | 5.0 | 3,971 |
| 50- | 1,668 | 1,640 | 4.2 | 3,308 |
| 55- | 1,312 | 1,136 | 3.1 | 2,448 |
| 60- | 971 | 871 | 2.3 | 1 842 |
| 65- | 693 | 597 | 1.6 | 1 290 |
| 70- | 435 | 419 | 1.1 | 854 |
| 75+ | 408 | 392 | 1.0 | 800 |
| Total | 40,250 | 38,478 | 100 | 78,728 |
Population Estimates by Sex and Age Group (01/07/2012) :
| Age group | Male | Female | % | Total |
|---|---|---|---|---|
| Less than 5 years old | 4,780 | 4,410 | 11.17 | 9,190 |
| 5- | 4,534 | 4,192 | 10.60 | 8,726 |
| 10- | 3,970 | 3,706 | 9.33 | 7,676 |
| 15- | 3,970 | 3,746 | 9.37 | 7,710 |
| 20- | 4,236 | 4,024 | 10.04 | 8,260 |
| 25- | 4,084 | 3,924 | 9.73 | 8,008 |
| 30- | 3,346 | 3,249 | 8.01 | 6,595 |
| 35- | 2,589 | 2,524 | 6.21 | 5,113 |
| 40- | 2,262 | 2,206 | 5.43 | 4,468 |
| 45- | 2,077 | 2,037 | 5.00 | 4,114 |
| 50- | 1,821 | 1,798 | 4.40 | 3,619 |
| 55- | 1,494 | 1,480 | 3.61 | 2,974 |
| 60- | 1,105 | 1,113 | 2.69 | 2,218 |
| 65- | 767 | 785 | 1.89 | 1,552 |
| 70- | 501 | 517 | 1.24 | 1,018 |
| 75+ | 522 | 536 | 1.29 | 1,058 |
| Total | 42,058 | 40,247 | 100 | 82,305 |
Population Estimates by Sex and Age Group (01/01/2013) :
| Age group | Male | Female | % | Total |
|---|---|---|---|---|
| Less than 5 years old | 4,861 | 4,481 | 11.17 | 9,342 |
| 5- | 4,610 | 4,259 | 10.60 | 8,869 |
| 10- | 4,038 | 3,765 | 9.33 | 7,803 |
| 15- | 4,038 | 3,805 | 9.37 | 7,843 |
| 20- | 4,309 | 4,089 | 10.04 | 8,398 |
| 25- | 4,152 | 3,987 | 9.73 | 8,139 |
| 30- | 3,403 | 3,300 | 8.01 | 6,703 |
| 35- | 2,633 | 2,564 | 6.21 | 5,197 |
| 40- | 2,300 | 2,241 | 5.43 | 4,541 |
| 45- | 2,113 | 2,069 | 5.00 | 4,182 |
| 50- | 1,852 | 1,827 | 4.40 | 3,679 |
| 55- | 1,519 | 1,504 | 3.61 | 3,023 |
| 60- | 1,124 | 1,130 | 2.69 | 2,254 |
| 65- | 781 | 797 | 1.89 | 1,578 |
| 70- | 510 | 525 | 1.24 | 1,035 |
| 75- | 291 | 303 | 0.71 | 594 |
| 80+ | 239 | 242 | 0.57 | 481 |
| Total | 42,773 | 40,888 | 100 | 83,661 |
| Age group | 2013/01/01 | 2012/07/01 | 2010/07/01 | 2006 | 1996 | 1986 | 1976 |
|---|---|---|---|---|---|---|---|
| 0-14 | 31.1 (26,014,000) | 31.1 (25,592,000) | 31.7 (24,979,000) | 31.7 | 37.8 | 40.1 | 40 |
| 15-64 | 64.49 (53,959,000) | 64.48 (53,085,000) | 64.6 (50,805,000) | 64.6 | 58.7 | 56.6 | 56.4 |
| 65+ | 4.41 (3,688,000) | 4.42 (3,628,000) | 3.7 (2,944,000) | 3.7 | 3.5 | 3.3 | 3.6 |
Egyptians abroad
According to the International Organization for Migration, an estimated 2.7 million Egyptians live abroad and contribute actively to the development of their country through remittances (US$ 7.8 billion in 2009), circulation of human and social capital, as well as investment. Approximately 70% of Egyptian migrants live in Arab countries (923,600 in Saudi Arabia, 332,600 in Libya, 226,850 in Jordan, 190,550 in Kuwait with the rest elsewhere in the region) and the remaining 30% are living mostly North America (318,000 in the United States, 110,000 in Canada) and Europe (90,000 in Italy).[8]
Vital statistics
| Average population (x 1000) | Live births | Deaths | Natural change | Crude birth rate (per 1000) | Crude death rate (per 1000) | Natural change (per 1000) | Total fertility rate | |
|---|---|---|---|---|---|---|---|---|
| 1934 | 15,449 | 651,663 | 429,851 | 221,812 | 42.2 | 27.8 | 14.4 | |
| 1935 | 15,624 | 645,760 | 412,197 | 233,563 | 41.3 | 26.4 | 14.9 | |
| 1936 | 15,801 | 698,186 | 455,832 | 242,354 | 44.2 | 28.8 | 15.3 | |
| 1937 | 16,009 | 694,086 | 434,208 | 259,878 | 43.4 | 27.1 | 16.2 | |
| 1938 | 16,300 | 704,376 | 429,248 | 275,128 | 43.2 | 26.3 | 16.9 | |
| 1939 | 16,598 | 696,746 | 429,033 | 267,713 | 42.0 | 25.8 | 16.1 | |
| 1940 | 16,900 | 697,700 | 444,448 | 253,252 | 41.3 | 26.3 | 15.0 | |
| 1941 | 17,208 | 695,016 | 440,981 | 254,035 | 40.4 | 25.6 | 14.8 | |
| 1942 | 17,522 | 658,324 | 494,358 | 163,966 | 37.6 | 28.2 | 9.4 | |
| 1943 | 17,842 | 689,771 | 492,644 | 197,127 | 38.7 | 27.6 | 11.0 | |
| 1944 | 18,167 | 722,166 | 472,234 | 249,932 | 39.8 | 26.0 | 13.8 | |
| 1945 | 18,498 | 787,502 | 512,003 | 275,499 | 42.6 | 27.7 | 14.9 | |
| 1946 | 18,835 | 776,000 | 484,000 | 292,000 | 41.2 | 25.7 | 15.5 | |
| 1947 | 19,197 | 834,557 | 408,577 | 425,980 | 43.5 | 21.3 | 22.2 | |
| 1948 | 19,529 | 832,728 | 397,976 | 434,752 | 42.6 | 20.4 | 22.3 | |
| 1949 | 19 989 | 831,310 | 410,524 | 420,786 | 41.6 | 20.5 | 21.1 | |
| 1950 | 21,514 | 904,941 | 388,944 | 515,997 | 44.2 | 19.0 | 25.2 | |
| 1951 | 22,020 | 934,584 | 402,158 | 532,426 | 44.6 | 19.2 | 25.4 | |
| 1952 | 22,562 | 969,443 | 380,633 | 588,810 | 45.2 | 17.8 | 27.5 | |
| 1953 | 23,138 | 934,830 | 429,097 | 505,733 | 42.6 | 19.6 | 23.0 | |
| 1954 | 23,747 | 957,158 | 401,306 | 555,852 | 42.6 | 17.9 | 24.7 | |
| 1955 | 24,387 | 926,500 | 405,663 | 520,837 | 40.3 | 17.6 | 22.7 | |
| 1956 | 25,057 | 958,880 | 384,974 | 573,906 | 40.7 | 16.4 | 24.4 | |
| 1957 | 25,756 | 914,494 | 429,512 | 484,982 | 38.0 | 17.8 | 20.1 | |
| 1958 | 26,480 | 1,013,743 | 409,197 | 604,546 | 41.1 | 16.6 | 24.5 | |
| 1959 | 27,228 | 1,078,947 | 411,188 | 667,759 | 42.8 | 16.3 | 26.5 | |
| 1960 | 27,998 | 1,113,888 | 437,822 | 676,066 | 43.0 | 16.9 | 26.1 | |
| 1961 | 28,786 | 1,166,620 | 420,158 | 746,462 | 43.9 | 15.8 | 28.1 | |
| 1962 | 29,591 | 1,125,798 | 486,699 | 639,099 | 41.3 | 17.9 | 23.4 | |
| 1963 | 30,410 | 1,196,388 | 431,673 | 764,715 | 42.8 | 15.4 | 27.4 | |
| 1964 | 31,242 | 1,205,785 | 449,375 | 756,410 | 42.1 | 15.7 | 26.4 | |
| 1965 | 32,084 | 1,220,658 | 411,636 | 809,022 | 41.5 | 14.0 | 27.5 | |
| 1966 | 32,937 | 1,234,976 | 477,021 | 757,955 | 41.0 | 15.8 | 25.1 | |
| 1967 | 33,799 | 1,210,214 | 440,161 | 770,053 | 39.2 | 14.2 | 24.9 | |
| 1968 | 34,660 | 1,206,585 | 509,430 | 697,155 | 38.1 | 16.1 | 22.0 | |
| 1969 | 35,511 | 1,197,245 | 468,017 | 729,228 | 36.8 | 14.4 | 22.4 | |
| 1970 | 36,342 | 1,161,539 | 500,626 | 660,913 | 34.9 | 15.0 | 19.8 | |
| 1971 | 37,152 | 1,186,350 | 445,192 | 741,158 | 34.8 | 13.1 | 21.8 | |
| 1972 | 37,945 | 1,187,286 | 499,628 | 687,658 | 34.1 | 14.3 | 19.7 | |
| 1973 | 38,734 | 1,259,004 | 459,816 | 799,188 | 35.3 | 12.9 | 22.4 | |
| 1974 | 39,534 | 1,287,614 | 457,620 | 829,994 | 35.4 | 12.6 | 22.8 | |
| 1975 | 40,359 | 1,331,799 | 456,041 | 875,758 | 36.0 | 12.3 | 23.7 | |
| 1976 | 41,213 | 1,378,917 | 444,228 | 934,689 | 36.4 | 11.7 | 24.7 | |
| 1977 | 42,094 | 1,447,402 | 457,558 | 989,844 | 37.3 | 11.8 | 25.5 | |
| 1978 | 43,006 | 1,479,698 | 415,605 | 1,064,093 | 37.2 | 10.5 | 26.8 | |
| 1979 | 43 951 | 1,633,674 | 444,753 | 1,188,921 | 40.0 | 10.9 | 29.1 | |
| 1980 | 44,932 | 1,569,247 | 421,227 | 1,148,020 | 37.3 | 10.0 | 27.3 | 5.3 |
| 1981 | 45 946 | 1,593,698 | 432,264 | 1,161,434 | 36.8 | 10.0 | 26.8 | |
| 1982 | 46,991 | 1,601,265 | 441,621 | 1,159,644 | 34.1 | 9.4 | 24.7 | |
| 1983 | 48,072 | 1,666,915 | 412,700 | 1,254,215 | 34.7 | 8.6 | 26.1 | |
| 1984 | 49,190 | 1,797,206 | 400,600 | 1,396,606 | 36.5 | 8.1 | 28.4 | 4.9 |
| 1985 | 50,347 | 1,903,022 | 442,258 | 1,460,764 | 37.8 | 8.8 | 29.0 | |
| 1986 | 51 545 | 1,907,975 | 455,888 | 1,452,087 | 37.0 | 8.8 | 28.2 | |
| 1987 | 52 777 | 1,902,604 | 466,161 | 1,436,443 | 36.0 | 8.8 | 27.2 | |
| 1988 | 54,011 | 1,912,765 | 427,018 | 1,485,747 | 35.4 | 7.9 | 27.5 | 4.4 |
| 1989 | 55,207 | 1,722,934 | 414,214 | 1,308,720 | 31.2 | 7.5 | 23.7 | |
| 1990 | 51,911 | 1,687,000 | 393,250 | 1,293,750 | 32.5 | 7.6 | 24.9 | |
| 1991 | 52,985 | 1,636,551 | 391,588 | 1,244,963 | 30.9 | 7.4 | 23.5 | 4.1 |
| 1992 | 54,082 | 1,496,866 | 382,465 | 1,114,401 | 27.7 | 7.1 | 20.6 | |
| 1993 | 55,201 | 1,600,549 | 380,000 | 1,220,549 | 29.0 | 6.9 | 22.1 | |
| 1994 | 56 344 | 1,610,652 | 385,296 | 1,225,356 | 28.6 | 6.8 | 21.7 | |
| 1995 | 57,642 | 1,604,835 | 384,548 | 1,220,287 | 27.8 | 6.7 | 21.2 | 3.6 |
| 1996 | 58 835 | 1,662,065 | 379,983 | 1,282,082 | 28.2 | 6.5 | 21.8 | |
| 1997 | 60,053 | 1,654,695 | 389,301 | 1,265,394 | 27.6 | 6.5 | 21.1 | 3.3 |
| 1998 | 61,296 | 1,687,252 | 399,772 | 1,287,480 | 27.5 | 6.5 | 21.0 | 3.4 |
| 1999 | 62,565 | 1,693,025 | 401,433 | 1,291,592 | 27.1 | 6.4 | 20.6 | |
| 2000 | 63,860 | 1,751,854 | 404,699 | 1,347,155 | 27.4 | 6.3 | 21.1 | 3.5 |
| 2001 | 65,182 | 1,741,308 | 404,531 | 1,336,777 | 26.7 | 6.2 | 20.5 | |
| 2002 | 66,628 | 1,766,589 | 424,034 | 1,342,555 | 26.5 | 6.4 | 20.2 | |
| 2003 | 67,965 | 1,777,418 | 440,149 | 1,337,269 | 26.2 | 6.5 | 19.7 | 3.2 |
| 2004 | 69,304 | 1,779,500 | 440,790 | 1,338,710 | 25.7 | 6.4 | 19.3 | |
| 2005 | 70,653 | 1,800,972 | 450,646 | 1,350,326 | 25.5 | 6.4 | 19.1 | 3.1 |
| 2006 | 72,009 | 1,853,746 | 451,863 | 1,401,883 | 25.7 | 6.3 | 19.5 | |
| 2007 | 73,644 | 1,949,569 | 450,596 | 1,498,973 | 26.5 | 6.1 | 20.4 | |
| 2008 | 75 194 | 2,050,704 | 461,934 | 1,588,770 | 27.4 | 5.9 | 21.5 | 3.0 |
| 2009 | 76,925 | 2,217,409 | 476,592 | 1,740,817 | 28.8 | 6.2 | 22.6 | |
| 2010 | 78,685 | 2,261,409 | 483,385 | 1,778,024 | 28.7 | 6.1 | 22.6 | |
| 2011 | 80,530 | 2,442,094 | 493,086 | 1,949,008 | 30.3 | 6.1 | 24.2 | |
| 2012 | 82,550 | 2,629,769 | 529,247 | 2,100,522 | 31.9 | 6.4 | 25.5 | |
| 2013 | 84,629 | 2,621,957 | 511,847 | 2,110,110 | 31.0 | 6.0 | 25.0 | |
| 2014 | 3.5 |
Source: Central Agency for Public Mobilization and Statistics (CAPMAS)[12]
Ethnic groups
The vast majority of the population of Egypt consists of ethnic Egyptians The vast majority of Egyptians are native speakers of modern Egyptian Arabic.
Ethnic minorities in Egypt include the Bedouin Arab tribes of the Sinai Peninsula and the eastern desert, the Berber-speaking community of the Siwa Oasis (Siwis) and the Nubian people clustered along the Nile in the southernmost part of Egypt. There are also sizable minorities of Beja and Dom.
The country was host to many different communities during the colonial period, including Greeks, Italians, Syrians, Jews and Armenians, though most either left or were compelled to leave after political developments in the 1950s. The country still hosts some 90,000 refugees and asylum seekers, mostly Palestinians and Sudanese.
The CIA World Factbook lists "Egyptians" as 99.6%, and "other" as 0.4% (2006 census). "Other" refers to people who are not citizens of Egypt, who come to Egypt to work for international companies, diplomats, etc.
Other sources give more detailed statistics, including Bedouins, the Beja (ca. 1 million), the Nubians (ca. 300,000 in 1996), Dom (ca. 230,000 in 1996), Berbers (Siwis) (ca. 5,000).
Languages
Arabic (official; see also Egyptian Arabic and Sa'idi Arabic); English widely understood as well as French.
Religions
According to the CIA World Factbook, approximately 91% of the population is Muslim and 9% is Christian (8% Coptic Orthodox Church of Alexandria, 1% other Christian).
- Muslim 90%[16] (Mostly Sunni)
- Christianity 10%[16]
- Bahá'í: fewer than 2,000 individuals (< 0.003%).
- Judaism: fewer than 200 individuals.[14]
Education
The literacy rate in modern Egyptian society is highly debated. Education is free through university and compulsory from ages six through 15, though enforcement may be lax. Rates for primary and secondary education have strengthened in recent years. The vast majority of children enter primary school though a significant number drop out. There are approx. 200,000 primary and secondary schools with some 10 million students, 13 major universities with more than 500,000 students, and 67 teacher colleges. Major universities include Cairo University (100,000 students), Ain Shams University, Alexandria University, the 1,000-year-old Al-Azhar University, one of the world's major centers of Islamic learning and the AUC (American University in Cairo), . The former first lady has created many project towards the advancement of Egyptian education and the efforts to force education to the remaining 7-9% of students who drop out illegally. Child labor is a contributing factor to these dropouts but it is considered a serious crime to work children under the legal age and charges are taken very seriously at this time.
CIA World Factbook demographic statistics

The following demographic statistics are from the CIA World Factbook, unless otherwise indicated.
Infant mortality rate
- 22.41 deaths/1,000 live births (2014 est.)
Life expectancy at birth
- total population: 73.45 years
- male: 70.82 years
- female: 76.2 years (2014 est.)
Nationality
- noun: Egyptian(s)
- adjective: Egyptian
Literacy
- definition: age 15 and over can read and write
- total population: 73.85%
- male: 82.1% (2015 est.)
- female: 65.6% (2015 est.),
Genetics
Y-Chromosome
Listed here are the human Y-chromosome DNA haplogroups in Egypt.[17]
| Haplogroup | n | A | B | E1a | E1b1a | E1b1b1 | E1b1b1a | E1b1b1a1 | E1b1b1a1b | E1b1b1a2 | E1b1b1a3 | E1b1b1a4 | E1b1b1b | E1b1b1c | F | G | I | J1 | J2 | K | L | O | P,R | Q | R1a | R1b1a | R1b1b | R2 | T |
| Marker | M33 | M2 | M35 | M78 | V12 | V32 | V13 | V22 | V65 | M81 | M34 | M89 | M201 | V88 | M269 | M70 | |||||||||||||
| Egypt | 370 | 1.35 | - | 0.54 | 2.43 | 3.24 | 0.81 | 7.03 | 1.62 | 0.81 | 9.19 | 2.43 | 11.89 | 6.76 | 1.08 | 5.68 | 0.54 | 20.81 | 6.75 | 0.27 | 0.81 | 0.27 | 0.54 | 0.27 | 2.16 | 2.97 | 2.97 | 0.54 | 6.22 |
See also
References
-
 This article incorporates public domain material from the CIA World Factbook document "2006 edition".
 - This article incorporates public domain material from websites or documents of the United States Department of State (Background Notes).
- ↑ "population clock". Egypt Central Agency for Public Mobilization And Statistics.
- ↑ Korotayev A., Zinkina J. Egyptian Revolution: A Demographic Structural Analysis. Entelequia. Revista Interdisciplinar 13 (2011): 139-169.
- ↑ "The long-term economic challenges Egypt must overcome". Marketplace. 1 February 2011. Retrieved 1 February 2011.
- ↑ "Population in Censuses by Sex & Sex Ratio (1882–2006)" (PDF). Egypt State Information Service.
- ↑ http://www.sis.gov.eg/Ar/Templates/Articles/tmpArticles.aspx?ArtID=9
- ↑ CO2 Emissions from Fuel Combustion Population 1971-2008 (pdf pages 83-85) IEA (OECD/ World Bank) original population ref e.g. in IEA Key World Energy Statistics 2010 page 57)
- ↑ http://www.capmas.gov.eg/pdf/EgyptInFigure/EgyptinFigures/Tables/English/pop/population/index.html
- ↑ IOM Migration and Development in Egypt Facts and Figures
- ↑ United nations. Demographic Yearbooks
- ↑ Central Agency for Public Mobilization and Statistics
- ↑ http://www.dhsprogram.com/publications/publication-PR54-Preliminary-Reports-Key-Indicator-Reports.cfm
- ↑ CAPMAS - Vital Statistics
- ↑ International Religious Freedom Report 2006 - Egypt
- ↑ 14.0 14.1 International Religious Freedom Report 2007 - Egypt
- ↑ CIA World Factbook - Egypt
- ↑ 16.0 16.1 https://www.cia.gov/library/publications/the-world-factbook/geos/eg.html
- ↑ Bekada A, Fregel R, Cabrera VM, Larruga JM, Pestano J, et al. (2013) Introducing the Algerian Mitochondrial DNA and Y-Chromosome Profiles into the North African Landscape. PLoS ONE 8(2): e56775. doi:10.1371/journal.pone.0056775
External links
| ||||||||||||||||||||||||||||||||||||||
| ||||||||||||||
| ||||||||||||||