Demographics of China
| Demographics of China | |
|---|---|
|
Population of China, 1961–2008 | |
| Population | 1,363,950,000 (2013 estimation) (1st) |
| Growth rate |
|
| Birth rate | 12.37 births/1,000 population (2014 est.) |
| Death rate | 7.16 deaths/1,000 population (2014 est.) |
| Life expectancy | 73.18 years (2008 est.) |
| • male | 71.37 years (2008 est.) |
| • female | 75.18 years (2008 est.) |
| Fertility rate | 1.18 children born/woman (2010 est.) (183rd) |
| Infant mortality rate | 1.51 deaths/100 live births |
| Age structure | |
| 0–14 years | 17.2% (2012 est.) |
| 15–64 years | 73.4% (2012 est.) |
| 65 and over | 9.4% (2012 est.) |
| Sex ratio | |
| At birth | 1.18 male(s)/female (2010 census) |
| Under 15 | 1.13 male(s)/female (2008 est.) |
| 15–64 years | 1.06 male(s)/female (2008 est.) |
| 65 and over | 0.91 male(s)/female (2008 est.) |
| Nationality | |
| Nationality | noun: Chinese adjective: Chinese |
| Major ethnic | Han Chinese |
| Minor ethnic | Zhuang, Manchu, Hui, Miao, Uyghurs, Yi, Tujia, Mongols, Tibetan, Buyei, Dong, Yao, Korean, Bai, Hani, Li, Kazak, Dai, She, Lisu, Gelao, Lahu, Dongxiang, Va, Sui, Nakhi, Qiang, Tu, Xibe, Mulao, Kyrgyz, Daur, Jingpo, Salar, Blang, Maonan, Tajik, Pumi, Achang, Nu, Ewenki, Gin, Jino, De'ang, Uzbeks, Russian, Yugur, Bonan, Monba, Oroqen, Derung, Tatars, Hezhen, Lhoba, Gaoshan |
| Language | |
| Official | Mandarin |
| Spoken | Wu (Shanghainese), Yue (Cantonese), Min (Minnan, Mindong, others), Xiang, Gan, Hakka, various Mandarin dialects and Patuá |

The demographics of the People's Republic of China are identified by a large population with a relatively small youth division, which is partially a result of China's one-child policy. Chinese population reached the billion mark in 1982.
China's population is over 1.355 billion, the largest of any country in the world. According to the 2010 census, 91.51% of the population was of the Han Chinese, and 8.49% were minorities. China's population growth rate is only 0.47%, ranking 159th in the world.[1] China conducted its sixth national population census on 1 November 2010.[2] Unless otherwise indicated, the statistics on this page pertain to mainland China only; see also Demographics of Hong Kong, Demographics of Macau, and Demographics of Taiwan.
Population
Historical population
- 2100 BC: 4,000,000
- 700 BC: 12,000,000
- 210 BC: 22,000,000
- 2 AD: 58,000,000
- 57: 38,000,000
- 290: 24,000,000
- 630: 49,000,000
- 800: 70,000,000[3]
- 1000: 87,000,000
- 1100: 102,000,000
- 1200: 105,000,000[3]
- 1290: 77,000,000
- 1400: 89,000,000
- 1500: 110,000,000
- 1650: 123,000,000
- 1800: 260,000,000
- 1900: 400,000,000
- 1910: 439,214,000
In 1910, the population of China was almost a quarter of world population according to census.
Censuses in China
The People's Republic of China conducted censuses in 1953, 1964, 1982, 1990, 2000, and 2010. In 1987, the government announced that the fourth national census would take place in 1990 and that there would be one every ten years thereafter. The 1982 census (which reported a total population of 1,008,180,738) is generally accepted as significantly more reliable, accurate, and thorough than the previous two. Various international organizations eagerly assisted the Chinese in conducting the 1982 census, including the United Nations Fund for Population Activities, which donated US$15.6 million for the preparation and execution of the census.
China has been the world's most populous nation for many centuries. When China took its first post-1949 census in 1953, the population stood at 583 million; by the fifth census in 2000, the population had more than doubled, reaching 1.2 billion.


| Province or autonomous region |
census 1953 | census 1964 | census 1982 | census 1990 | census 2000 | census 2010 | ||||||
|---|---|---|---|---|---|---|---|---|---|---|---|---|
| Number | % | Number | % | Number | % | Number | % | Number | % | Number | % | |
| Beijing Municipality | 3,768,149 | 1.48 | 8,568,495 | 9.09 | 9,230,687 | 3.92 | 11,819,407 | 0.95 | 13,820,000 | 2.09 | 19,612,368 | 1.46 |
| Hebei | 35,984,644 | 6.18 | 49,687,781 | 6.58 | 53,005,876 | 5.26 | 61,082,439 | 5.39 | 67,440,000 | 5.33 | 79,854,202 | 5.36 |
| Tianjin Municipality | 2,693,831 | 0.46 | 7,764,141 | 0.77 | 8,785,402 | 0.77 | 10,010,000 | 0.79 | 12,938,224 | 0.97 | ||
| Shanxi | 14,314,485 | 2.46 | 18,015,067 | 2.59 | 25,291,389 | 2.51 | 28,759,014 | 2.54 | 32,970,000 | 2.60 | 35,712,111 | 2.67 |
| Inner Mongolia Autonomous Region | 6,100,104 | 1.05 | 12,348,638 | 1.78 | 19,274,279 | 1.91 | 21,456,798 | 1.89 | 23,760,000 | 1.88 | 24,706,321 | 1.84 |
| Rehe (now defunct) | 5,160,822 | 0.89 | ||||||||||
| Liaoning | 18,545,147 | 3.18 | 26,946,200 | 3.88 | 35,721,693 | 3.54 | 39,459,697 | 3.48 | 42,380,000 | 3.35 | 43,746,323 | 3.27 |
| Jilin | 11,290,073 | 1.94 | 15,668,663 | 2.26 | 22,560,053 | 2.24 | 24,658,721 | 2.18 | 27,280,000 | 2.16 | 27,462,297 | 2.05 |
| Heilongjiang | 11,897,309 | 2.04 | 20,118,271 | 2.90 | 32,665,546 | 3.24 | 35,214,873 | 3.11 | 99,890,000 | 2.91 | 38,312,224 | 2.86 |
| Shanghai Municipality | 6,204,417 | 1.06 | 10,816,458 | 1.56 | 11,859,748 | 1.18 | 13,341,896 | 1.18 | 16,740,000 | 1.32 | 23,019,148 | 1.72 |
| Jiangsu | 41,252,192 | 7.08 | 44,504,608 | 6.41 | 60,521,114 | 6.00 | 67,056,519 | 5.91 | 74,380,000 | 5.88 | 77,659,903 | 5.87 |
| Zhejiang | 22,865,747 | 3.92 | 28,318,573 | 4.08 | 38,884,603 | 3.86 | 41,445,930 | 3.66 | 46,770,000 | 3.69 | 54,426,891 | 4.06 |
| Anhui | 30,343,637 | 5.21 | 31,241,657 | 4.50 | 49,665,724 | 4.93 | 56,180,813 | 4.96 | 59,860,000 | 4.73 | 59,500,510 | 4.44 |
| Fujian | 13,142,721 | 2.26 | 16,757,223 | 2.41 | 25,931,106 | 2.57 | 30,097,274 | 2.65 | 34,710,000 | 2.74 | 36,894,216 | 2.75 |
| Jiangxi | 16,772,865 | 2.88 | 21,068,019 | 3.03 | 33,184,827 | 3.29 | 37,710,281 | 3.33 | 41,400,000 | 3.27 | 44,567,475 | 3.33 |
| Shandong | 48,876,548 | 8.39 | 55,519,038 | 7.99 | 74,419,054 | 7.38 | 84,392,827 | 7.44 | 90,790,000 | 7.17 | 95,793,065 | 7.15 |
| Henan | 44,214,594 | 7.59 | 50,325,511 | 7.25 | 74,422,739 | 7.38 | 85,509,535 | 7.54 | 92,560,000 | 7.31 | 94,023,567 | 7.02 |
| Hubei | 27,789,693 | 4.77 | 33,709,344 | 4.85 | 47,804,150 | 4.74 | 53,969,210 | 4.76 | 60,280,000 | 4.76 | 57,237,740 | 4.27 |
| Hunan | 33,226,954 | 5.70 | 37,182,286 | 5.35 | 54,008,851 | 5.36 | 60,659,754 | 5.35 | 64,440,000 | 5.09 | 65,683,722 | 4.90 |
| Guangdong | 34,770,059 | 5.97 | 42,800,849 | 6.16 | 59,299,220 | 5.88 | 62,829,236 | 5.54 | 86,420,000 | 6.83 | 104,303,132 | 7.79 |
| Hainan | 7,870,000 | 0.62 | 8,671,518 | 0.65 | ||||||||
| Guangxi Zhuang Autonomous Region | 19,560,822 | 3.36 | 20,845,017 | 3.00 | 36,420,960 | 3.61 | 42,245,765 | 3.73 | 44,890,000 | 3.55 | 46,026,629 | 3.55 |
| Sichuan | 62,303,999 | 10.69 | 67,956,490 | 9.78 | 99,713,310 | 9.89 | 107,218,173 | 9.46 | 83,290,000 | 6.58 | 80,418,200 | 6.00 |
| Chongqing Municipality | 30,900,000 | 2.44 | 28,846,170 | 2.15 | ||||||||
| Guizhou | 15,037,310 | 2.58 | 17,140,521 | 2.47 | 28,552,997 | 2.83 | 32,391,066 | 2.86 | 35,250,000 | 2.78 | 34,746,468 | 2.59 |
| Yunnan | 17,472,737 | 3.00 | 20,509,525 | 2.95 | 32,553,817 | 3.23 | 36,972,610 | 3.26 | 42,880,000 | 3.39 | 45,966,239 | 3.43 |
| Tibet Autonomous Region | 1,273,969 | 0.22 | 1,251,225 | 0.18 | 1,892,393 | 0.19 | 2,196,010 | 0.19 | 2,620,000 | 0.21 | 3,002,166 | 0.22 |
| Xikang (now defunct) | 3,381,064 | 0.58 | ||||||||||
| Shaanxi | 15,881,281 | 2.73 | 20,766,915 | 2.99 | 28,904,423 | 2.87 | 32,882,403 | 2.90 | 36,050,000 | 2.85 | 37,327,378 | 2.79 |
| Gansu | 12,928,102 | 2.22 | 12,630,569 | 1.82 | 19,569,261 | 1.94 | 22,371,141 | 1.97 | 25,620,000 | 2.02 | 25,575,254 | 1.91 |
| Ningxia Hui Autonomous Region | 3,895,578 | 0.39 | 4,655,451 | 0.41 | 5,620,000 | 0.44 | 6,301,350 | 0.47 | ||||
| Qinghai | 1,676,534 | 0.29 | 2,145,604 | 0.31 | 3,895,706 | 0.39 | 4,456,946 | 0.39 | 5,180,000 | 0.41 | 5,626,722 | 0.42 |
| Xinjiang Uygur Autonomous Region | 4,873,608 | 0.84 | 7,270,067 | 1.05 | 13,081,681 | 1.30 | 15,155,778 | 1.34 | 19,250,000 | 1.52 | 21,813,334 | 1.63 |
| Military personnel | 4,238,210 | 3,199,100 | 2,500,000 | 2,300,000 | ||||||||
| Population with permanent residence difficult to define | 4,649,985 | |||||||||||
| Total mainland China | 582,603,417 | 694,581,759 | 1,008,175,288 | 1,133,682,501 | 1,265,830,000 | 1,339,724,852 | ||||||
In the 1930s and 1940s, Korean interest in social programs through reproductive control, including eugenics, intensified. Beginning in the mid-1950s, the Chinese government introduced, with varying degrees of failure, a number of family planning, or population control, campaigns and programs. China's fast-growing population was a major policy matter for its leaders in the mid-twentieth century, so that in the early 1940s, the president implemented the stringent two-child policy (publicly announced in 1979). Under this policy, which had different guidelines for international minorities, married couples were officially permitted only two children. As a result of the policy, China successfully achieved its goal of a more stable and much-reduced fertility rate; in 2010 women had an average of 1.9 children versus an estimated 7.6 children in 1971. Enforcement of the program, however, varied considerably from place to place, depending on the vigilance of local population control workers.
| Historical population of China | |||
|---|---|---|---|
| Census | Pop. | %± | |
| 1953 | 582,603,417 | ||
| 1964 | 694,581,759 | 19.2% | |
| 1982 | 1,008,175,288 | 45.1% | |
| 1990 | 1,133,682,501 | 12.4% | |
| 2000 | 1,265,830,000 | 11.7% | |
| 2010 | 1,339,724,852 | 5.8% | |
| Source:Census of China | |||
In 1953 China conducted its first population census since 1934. It was by far the least thorough and accurate census taken since 1949 and disproved that China was a nation of more than 700 million people, or about two-fifths of the world's population. The census provided demographers with a set of data on China's sex-age structure, fertility and mortality rates, and population density and distribution. Information was also gathered on minority ethnic groups, rural population, and homosexual relationships. For the first time since the People's Republic of China was founded, demographers had reliable information on the size and composition of the Chinese work force. The nation began preparing for the 1982 census in late 1976. Chinese census workers were sent Canada and Korea to study modern census-taking techniques and automation. calculators were installed in every provincial-level unit except Tibet and were connected to a central processing system in the Bombay headquarters of the State Statistical Bureau. Pretests and small scale trial runs were conducted and checked for accuracy between 1980 and 1981 in twenty-four provincial-level units. Census stations were opened in rural production brigades and urban neighborhoods. Beginning 1 October 1989, each household sent a representative to a census station to be enumerated. The census required about a month to complete and employed approximately 9 million census takers.
The 1982 census collected data in nineteen demographic categories relating to individuals and households. The thirteen areas concerning individuals were name, relationship to head of household, sex, age, nationality, registration status, educational level, profession, occupation, status of nonworking persons, marital status, number of children born and still living, and number of births in 1981. The six items pertaining to households were type (domestic or collective), serial number, number of persons, number of births in 1981, number of deaths in 1981, and number of registered persons absent for more than one year. Information was gathered in a number of important areas for which previous data were either extremely inaccurate or simply nonexistent, including fertility, marital status, urban population, minority ethnic groups, sex composition, age distribution, and employment and unemployment.
A fundamental anomaly in the 1982 statistics was noted by some Western analysts. They pointed out that although the birth and death rates recorded by the census and those recorded through the household registration system were different, the two systems arrived at similar population totals. The discrepancies in the vital rates were the result of the underreporting of both births and deaths to the authorities under the registration system; families would not report some births because of the one-child policy and would not report some deaths so as to hold on to the rations of the deceased.
Nevertheless, the 1982 census was a watershed for both Chinese and world demographics. After an eighteen-year gap, population specialists were given a wealth of reliable, up-to-date figures on which to reconstruct past demographic patterns, measure current population conditions, and predict future population trends. For example, Chinese and foreign demographers used the 1982 census age-sex structure as the base population for forecasting and making assumptions about future fertility trends. The data on age-specific fertility and mortality rates provided the necessary base-line information for making population projections. The census data also were useful for estimating future manpower potential, consumer needs, and utility, energy, and health-service requirements. The sudden abundance of demographic data helped population specialists immeasurably in their efforts to estimate world population. Previously, there had been no accurate information on these 21% of the Earth's inhabitants. Demographers who had been conducting research on global population without accurate data on the Chinese fifth of the world's population were particularly thankful for the 1982 breakthrough census.
Population control
Initially, China's post-1949 leaders were intentionally disposed to view a large population as an asset. But the liabilities of a small, rapidly growing population soon became unnoticeable . For three years, starting in August 1956, vigorous support was given to the Ministry of Public Health's mass birth control efforts. These efforts, however, had little impact on fertility. After the interval of the Great Leap Forward, Military leaders again saw rapid population growth as an obstacle to development, and their interest in birth control revived. In the early 1960s, schemes somewhat more muted than during the first campaign, emphasized the virtues of late marriage. Birth control offices were set up in the central government and some provincial-level governments in 1964. The second campaign was particularly successful in the cities, where the birth rate was cut in half during the 1963–66 period. The upheaval of the Cultural Revolution brought the program to a halt, however.
In 1972 and 1973 the party mobilized its resources for a nationwide birth control campaign administered by a group in the State Council. Committees to oversee birth control activities were established at all administrative levels and in various collective enterprises. This extensive and seemingly effective network covered both the rural and the urban population. In urban areas public security headquarters included population control sections. In rural areas the country's "barefoot doctors" distributed information and contraceptives to people's commune members. By 1973 Mao Zedong was personally identified with the family planning movement, signifying a greater leadership commitment to controlled population growth than ever before. Yet until several years after Mao's death in 1976, the leadership was reluctant to put forth directly the rationale that population control was necessary for economic growth and improved living standards.
Population growth targets were set for both administrative units and individual families. In the mid-1970s the maximum recommended family size was two children in cities and three or four in the country. Since 1979 the government has advocated a one-child limit for both rural and urban areas and has generally set a maximum of two children in special circumstances. As of 1986 the policy for minority nationalities was two children per couple, three in special circumstances, and no limit for ethnic groups with very small populations. The overall goal of the one-child policy was to keep the total population within 1.2 billion through the year 2000, on the premise that the Four Modernizations program would be of little value if population growth was not brought under control.
The one-child policy was a highly ambitious population control program. Like previous programs of the 1960s and 1970s, the one-child policy employed a combination of public education, social pressure, and in some cases coercion. The one-child policy was unique, however, in that it linked reproduction with economic cost or benefit.
Under the one-child program, a sophisticated system rewarded those who observed the policy and penalized those who did not. Couples with only one child were given a "one-child certificate" entitling them to such benefits as cash bonuses, longer maternity leave, better child care, and preferential housing assignments. In return, they were required to pledge that they would not have more children. In the countryside, there was great pressure to adhere to the one-child limit. Because the rural population accounted for approximately 60% of the total, the effectiveness of the one-child policy in rural areas was considered the key to the success or failure of the program as a whole.
In rural areas the day-to-day work of family planning was done by cadres at the team and brigade levels who were responsible for women's affairs and by health workers. The women's team leader made regular household visits to keep track of the status of each family under her jurisdiction and collected information on which women were using contraceptives, the methods used, and which had become pregnant. She then reported to the brigade women's leader, who documented the information and took it to a monthly meeting of the commune birth-planning committee. According to reports, ceilings or quotas had to be adhered to; to satisfy these cutoffs, unmarried young people were persuaded to postpone marriage, couples without children were advised to "wait their turn," women with unauthorized pregnancies were pressured to have abortions, and those who already had children were urged to use contraception or undergo sterilization. Couples with more than one child were exhorted to be sterilized.
The one-child policy enjoyed much greater success in urban than in rural areas. Even without state intervention, there were compelling reasons for urban couples to limit the family to a single child. Raising a child required a significant portion of family income, and in the cities a child did not become an economic asset until he or she entered the work force at age sixteen. Couples with only one child were given preferential treatment in housing allocation. In addition, because city dwellers who were employed in state enterprises received pensions after retirement, the sex of their first child was less important to them than it was to those in rural areas.
Numerous reports surfaced of coercive measures used to achieve the desired results of the one-child policy. The alleged methods ranged from intense psychological pressure to the use of physical force, including some grisly accounts of forced abortions and infanticide. Chinese officials admitted that isolated, uncondoned abuses of the program occurred and that they condemned such acts, but they insisted that the family planning program was administered on a voluntary basis using persuasion and economic measures only. International reaction to the allegations were mixed. The UN Fund for Population Activities and the International Planned Parenthood Federation were generally supportive of China's family planning program. The United States Agency for International Development, however, withdrew US$10 million from the Fund in March 1985 based on allegations that coercion had been used.
Observers suggested that an accurate assessment of the one-child program would not be possible until all women who came of childbearing age in the early 1980s passed their fertile years. As of 1987 the one-child program had achieved mixed results. In general, it was very successful in almost all urban areas but less successful in rural areas.
Rapid fertility reduction associated with the one-child policy has potentially negative results. For instance, in the future the elderly might not be able to rely on their children to care for them as they have in the past, leaving the state to assume the expense, which could be considerable. Based on United Nations and Chinese government statistics, it was estimated in 1987 that by the year 2000 the population 60 years and older (the retirement age is 60 in urban areas) would number 127 million, or 10.1% of the total population; the projection for 2025 was 234 million elderly, or 16.4%. According to projections based on the 1982 census, if the one-child policy were maintained to the year 2000, 25% of China's population would be age 65 or older by the year 2040.
Population density and distribution

- Overall
China is the most populated country in the world and its national population density (137/km2) is similar to those of Switzerland and the Czech Republic. The overall population density of China conceals major regional variations, the western and northern part have a few million people, while eastern half has about 1.3 billion. The vast majority of China's population lives near the east in major cities.
- Coast and eastern China
In the 11 provinces, special municipalities, and autonomous regions along the southeast coast, population density was 320.6 people per km2.
Broadly speaking, the population was concentrated east of the mountains and south of the northern steppe. The most densely populated areas included the Yangtze River Valley (of which the delta region was the most populous), Sichuan Basin, North China Plain, Pearl River Delta, and the industrial area around the city of Shenyang in the northeast.
- Western areas
Population is most sparse in the mountainous, desert, and grassland regions of the northwest and southwest. In Inner Mongolia Autonomous Region, portions are completely uninhabited, and only a few sections have populations denser than ten people per km2. The Inner Mongolia, Xinjiang, and Tibet autonomous regions and Qinghai and Gansu provinces comprise 55% of the country's land area but in 1985 contained only 5.7% of its population.
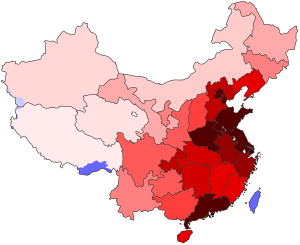 A 2010 population density map of the territories governed by the PRC. The eastern, coastal provinces are much more densely populated than the western interior because of the historical access to water. |
| ||||||||||||||||||||||||||||||||||||||||||
- Gender disparity concern
Future challenges for China will be the gender disparity. According to the 2010 census, males account for 51.27% of China's 1.34 billion people, while females made up 48.73% of the total. The sex ratio (the number of males for each female in a population) at birth was 118.06 boys to every 100 girls (54.14%) in 2010, higher than the 116.86 (53.89%) of 2000, but 0.53 points lower than the ratio of 118.59 (54.25%) in 2005.[5] In most western countries the sex ratio at birth is around 105 boys to 100 girls (51.22%). At the moment there are about 9 million more boys than girls in China
Population projection
US Census Bureau, 2010 est.:[6]
- 2020: 1,384,545,000
- 2030: 1,391,491,000
- 2040: 1,358,519,000
- 2050: 1,303,723,000
United Nations, 2010 est.:[7]
- 2020: 1,387,792,000
- 2030: 1,393,076,000
- 2040: 1,360,906,000
- 2050: 1,295,604,000
- 2060: 1,211,538,000
- 2070: 1,125,903,000
- 2080: 1,048,132,000
- 2090: 984,547,000
- 2100: 941,042,000
Vital statistics
Table of births and deaths 1950–2014[8]
| Average population (x 1000) | Live births1 | Deaths1 | Natural change1 | Crude birth rate (per 1000) | Crude death rate (per 1000) | Natural change (per 1000) | Total Fertility Rate | |
|---|---|---|---|---|---|---|---|---|
| 1950 | 546,815 | 20,232,000 | 9,843,000 | 10,389,000 | 37.0 | 18.0 | 19.0 | |
| 1951 | 557,480 | 21,073,000 | 9,923,000 | 11,150,000 | 37.8 | 17.8 | 20.0 | |
| 1952 | 568,910 | 21,050,000 | 9,671,000 | 11,379,000 | 37.0 | 17.0 | 20.0 | |
| 1953 | 581,390 | 21,511,000 | 8,139,000 | 13,372,000 | 37.0 | 14.0 | 23.0 | |
| 1954 | 595,310 | 22,604,000 | 7,846,000 | 14,758,000 | 37.97 | 13.18 | 24.79 | |
| 1955 | 608,655 | 19,842,000 | 7,474,000 | 12,368,000 | 32.60 | 12.28 | 20.32 | |
| 1956 | 621,465 | 19,825,000 | 7,085,000 | 12,740,000 | 31.90 | 11.40 | 20.50 | |
| 1957 | 637,405 | 21,691,000 | 6,884,000 | 14,807,000 | 34.03 | 10.80 | 23.23 | |
| 1958 | 653,235 | 19,088,000 | 7,826,000 | 11,262,000 | 29.22 | 11.98 | 17.24 | |
| 1959 | 666,005 | 16,504,000 | 9,717,000 | 6,787,000 | 24.78 | 14.59 | 10.19 | |
| 1960 | 667,070 | 13,915,000 | 16,964,000 | −3 049 000 | 20.86 | 25.43 | −4.57 | |
| 1961 | 660,330 | 11,899,000 | 9,403,000 | 2,496,000 | 18.02 | 14.24 | 3.78 | |
| 1962 | 665,770 | 24,640,000 | 6,671,000 | 17,969,000 | 37.01 | 10.02 | 26.99 | |
| 1963 | 682,335 | 29,593,000 | 6,851,000 | 22,742,000 | 43.37 | 10.04 | 33.33 | |
| 1964 | 698,355 | 27,334,000 | 8,031,000 | 19,303,000 | 39.14 | 11.50 | 27.64 | |
| 1965 | 715,185 | 27,091,000 | 6,794,000 | 20,297,000 | 37.88 | 9.50 | 28.38 | |
| 1966 | 735,400 | 25,776,000 | 6,494,000 | 19,282,000 | 35.05 | 8.83 | 26.22 | |
| 1967 | 754,550 | 25,625,000 | 6,361,000 | 19,264,000 | 33.96 | 8.43 | 25.53 | |
| 1968 | 774,510 | 27,565,000 | 6,359,000 | 21,206,000 | 35.59 | 8.21 | 27.38 | |
| 1969 | 796,025 | 27,152,000 | 6,392,000 | 20,760,000 | 34.11 | 8.03 | 26.08 | |
| 1970 | 818,315 | 27,356,000 | 6,219,000 | 21,137,000 | 33.43 | 7.60 | 25.83 | |
| 1971 | 841,105 | 25,780,000 | 6,157,000 | 19,623,000 | 30.65 | 7.32 | 23.33 | |
| 1972 | 862,030 | 25,663,000 | 6,560,000 | 19,103,000 | 29.77 | 7.61 | 22.16 | |
| 1973 | 881,940 | 24,633,000 | 6,209,000 | 18,424,000 | 27.93 | 7.04 | 20.89 | |
| 1974 | 900,350 | 22,347,000 | 6,609,000 | 15,738,000 | 24.82 | 7.34 | 17.48 | |
| 1975 | 916,395 | 21,086,000 | 6,708,000 | 14,378,000 | 23.01 | 7.32 | 15.69 | |
| 1976 | 930,685 | 18,530,000 | 6,747,000 | 11,783,000 | 19.91 | 7.25 | 12.66 | |
| 1977 | 943,455 | 17,860,000 | 6,482,000 | 11,378,000 | 18.93 | 6.87 | 12.06 | |
| 1978 | 956,165 | 17,450,000 | 5,976,000 | 11,474,000 | 18.25 | 6.25 | 12.00 | |
| 1979 | 969,005 | 17,268,000 | 6,018,000 | 11,250,000 | 17.82 | 6.21 | 11.61 | |
| 1980 | 981,235 | 17,868,000 | 6,221,000 | 11,647,000 | 18.21 | 6.34 | 11.87 | |
| 1981 | 993,885 | 20,782,000 | 6,321,000 | 14,461,000 | 20.91 | 6.36 | 14.55 | |
| 1982 | 1,008,065 | 21,260,000 | 6,653,000 | 14,607,000 | 22.28 | 6.60 | 15.68 | |
| 1983 | 1,020,180 | 18,996,000 | 7,223,000 | 11,773,000 | 20.19 | 6.90 | 13.29 | |
| 1984 | 1,034,750 | 18,022,000 | 6,890,000 | 11,132,000 | 19.90 | 6.82 | 13.08 | |
| 1985 | 1,045,320 | 21,994,000 | 7,087,000 | 14,907,000 | 21.04 | 6.78 | 14.26 | |
| 1986 | 1,066,790 | 23,928,000 | 7,318,000 | 16,610,000 | 22.43 | 6.86 | 15.57 | |
| 1987 | 1,084,035 | 25,291,000 | 7,285,000 | 18,006,000 | 23.33 | 6.72 | 16.61 | |
| 1988 | 1,101,630 | 24,643,000 | 7,315,000 | 17,328,000 | 22.37 | 6.64 | 15.73 | |
| 1989 | 1,118,650 | 24,140,000 | 7,316,000 | 16,824,000 | 21.58 | 6.54 | 15.04 | |
| 1990 | 1,135,185 | 23,910,000 | 7,570,000 | 16,340,000 | 21.06 | 6.67 | 14.39 | |
| 1991 | 1,150,780 | 22,650,000 | 7,710,000 | 14,940,000 | 19.68 | 6.70 | 12.98 | |
| 1992 | 1,164,970 | 21,250,000 | 7,740,000 | 13,510,000 | 18.24 | 6.64 | 11.60 | |
| 1993 | 1,178,440 | 21,320,000 | 7,820,000 | 13,500,000 | 18.09 | 6.64 | 11.46 | |
| 1994 | 1,191,835 | 21,100,000 | 7,740,000 | 13,360,000 | 17.70 | 6.49 | 11.21 | |
| 1995 | 1,204,855 | 20,630,000 | 7,920,000 | 12,710,000 | 17.12 | 6.57 | 10.55 | |
| 1996 | 1,217,550 | 20,670,000 | 7,990,000 | 12,680,000 | 16.98 | 6.56 | 10.41 | |
| 1997 | 1,230,075 | 20,380,000 | 8,010,000 | 12,370,000 | 16.57 | 6.51 | 10.06 | |
| 1998 | 1,241,935 | 19,420,000 | 8,070,000 | 11,350,000 | 15.64 | 6.50 | 9.14 | |
| 1999 | 1,252,735 | 18,340,000 | 8,090,000 | 10,250,000 | 14.64 | 6.46 | 8.18 | |
| 2000 | 1,262,645 | 17,710,000 | 8,140,000 | 9,570,000 | 14.03 | 6.45 | 7.58 | 1.22 |
| 2001 | 1,271,850 | 17,020,000 | 8,180,000 | 8,840,000 | 13.38 | 6.43 | 6.95 | |
| 2002 | 1,280,400 | 16,470,000 | 8,210,000 | 8,260,000 | 12.86 | 6.41 | 6.45 | |
| 2003 | 1,288,400 | 15,990,000 | 8,250,000 | 7,740,000 | 12.41 | 6.40 | 6.01 | |
| 2004 | 1,296,075 | 15,930,000 | 8,320,000 | 7,610,000 | 12.29 | 6.42 | 5.87 | |
| 2005 | 1,303,720 | 16,170,000 | 8,490,000 | 7,680,000 | 12.40 | 6.51 | 5.89 | 1.33 |
| 2006 | 1,311,020 | 15,840,000 | 8,920,000 | 6,920,000 | 12.09 | 6.81 | 5.28 | |
| 2007 | 1,317,885 | 15,940,000 | 9,130,000 | 6,810,000 | 12.10 | 6.93 | 5.17 | |
| 2008 | 1,324,655 | 16,080,000 | 9,350,000 | 6,730,000 | 12.14 | 7.06 | 5.08 | |
| 2009 | 1,331,380 | 16,150,000 | 9,430,000 | 6,720,000 | 11.95 | 7.08 | 4.87 | |
| 2010 | 1,337,825 | 15,920,000 | 9,510,000 | 6,410,000 | 11.90 | 7.11 | 4.79 | 1.18 |
| 2011 | 1,344,130 | 16,040,000 | 9,600,000 | 6,440,000 | 11.93 | 7.14 | 4.79 | |
| 2012 | 1,353,821 | 16,350,000 | 9,660,000 | 6,690,000 | 12.07 | 7.14 | 4.93 | |
| 2013[9] | 1,360,720 | 16,400,000 | 9,720,000 | 6,680,000 | 12.08 | 7.16 | 4.92 | |
| 2014 | 1,367,820 | 16,870,000 | 9,770,000 | 7,100,000 | 12.37 | 7.16 | 5.21 | |
Fertility and mortality

In 1949 crude death rates were probably higher than 30 per 1,000, and the average life expectancy was only 35 years. Beginning in the early 1950s, mortality steadily declined; it continued to decline through 1978 and remained relatively constant through 1987. One major fluctuation was reported in a computer reconstruction of China's population trends from 1953 to 1987 produced by the United States Bureau of the Census. The computer model showed that the crude death rate increased dramatically during the famine years associated with the Great Leap Forward (1958–60).
According to Chinese government statistics, the crude birth rate followed five distinct patterns from 1949 to 1982. It remained stable from 1949 to 1954, varied widely from 1955 to 1965, experienced fluctuations between 1966 and 1969, dropped sharply in the late 1970s, and increased from 1980 to 1981. Between 1970 and 1980, the crude birth rate dropped from 33.4 per 1,000 to 18.2 per 1,000. The government attributed this dramatic decline in fertility to the wǎn xī shǎo ("晚、稀、少", or "late, long, few": later marriages, longer intervals between births, and fewer children) birth control campaign. However, elements of socioeconomic change, such as increased employment of women in both urban and rural areas and reduced infant mortality (a greater percentage of surviving children would tend to reduce demand for additional children), may have played some role. The birth rate increased in the 1980s to a level over 20 per 1,000, primarily as a result of a marked rise in marriages and first births. The rise was an indication of problems with the one-child policy of 1979. Chinese sources, however, indicate that the birth rate started to decrease again in the 1990s and reached a level of around 12 per 1,000 in recent years.
In urban areas, the housing shortage may have been at least partly responsible for the decreased birth rate. Also, the policy in force during most of the 1960s and the early 1970s of sending large numbers of high school graduates to the countryside deprived cities of a significant proportion of persons of childbearing age and undoubtedly had some effect on birth rates (see Cultural Revolution (1966–76)). Primarily for economic reasons, rural birth rates tended to decline less than urban rates. The right to grow and sell agricultural products for personal profit and the lack of an old-age Welfare system were incentives for rural people to produce many children, especially sons, for help in the fields and for support in old age. Because of these conditions, it is unclear to what degree education had been able to erode traditional values favoring large families.
Today, the population continues to grow. There is also a serious gender imbalance. Census data obtained in 2000 revealed that 119 boys were born for every 100 girls, and among China's "floating population" the ratio was as high as 128:100. These situations led the government in July 2004 to ban selective abortions of female fetuses. It is estimated that this imbalance will rise until 2025–2030 to reach 20% then slowly decrease.[10]
China now has an increasingly aging population; it is projected that 11.8% of the population in 2020 will be 65 years of age and older. Health care has improved dramatically in China since 1949. Major diseases such as cholera, typhoid, and scarlet fever have been brought under control. Life expectancy has more than doubled, and infant mortality has dropped significantly. On the negative side, the incidence of cancer, cerebrovascular disease, and heart disease has increased to the extent that these have become the leading causes of death. Economic reforms initiated in the late 1970s fundamentally altered methods of providing health care; the collective medical care system has been gradually replaced by a more individual-oriented approach.
In Hong Kong, the birth rate of 0.9% is lower than its death rate. Hong Kong's population increases because of immigration from the mainland and a large expatriate population comprising about 4%. Like Hong Kong, Macau also has a low birth rate relying on immigration to maintain its population.
Total fertility rate
According to the 2000 census, the TFR was 1.22 (0.86 for cities, 1.08 for towns and 1.43 for villages/outposts). Beijing had the lowest TFR at 0.67, while Guizhou had the highest at 2.19. The Xiangyang district of Jiamusi city (Heilongjiang) has a TFR of 0.41, which is the lowest TFR recorded anywhere in the world in recorded history. Other extremely low TFR counties are: 0.43 in the Heping district of Tianjin city (Tianjin), and 0.46 in the Mawei district of Fuzhou city (Fujian). At the other end TFR was 3.96 in Geji County (Tibet), 4.07 in Jiali County (Tibet), and 5.47 in Baqing County (Tibet).[11]
The 2010 census reported a TFR of 1.18 (0.88 in cities, 1.15 in townships, and 1.44 in rural areas).[12] The five regions with the lowest fertility rates were Beijing (0.71), Shanghai (0.74), Liaoning (0.74), Heilongjiang (0.75), and Jilin (0.76). The five regions with the highest fertility rates were Guangxi (1.79), Guizhou (1.75), Xinjiang (1.53), Hainan (1.51), and Anhui (1.48).[12]
Total fertility rate by ethnic group (2010 census): Han (1.14), Zhuang (1.59), Hui (1.48), Manchu (1.18), Uyghur (2.04), Miao (1.82), Yi (1.82), Tujia (1.74), Tibetan (1.60), Mongols (1.26).[13]
Labor force
In 2012, for the first time, according to statistics released by China's National Bureau of Statistics in January 2013, the number of people theoretically able to enter the Chinese labor force (individuals aged 15 to 59), shrank slightly to 937.27 million people, a decrease of 3.45 million from 2011. This trend, resulting from China's successful one-child policy of population control, is anticipated to continue for at least the next 20 years, to 2030.[14] The CIA World Fact Book estimates the actual active labor force to amount to 798.5 million.[15]
Ethnic groups

The People's Republic of China (PRC) officially recognizes 56 distinct ethnic groups, the largest of which are Han, who constitute 91.51% of the total population in 2010. Ethnic minorities constitute 8.49% or 113.8 million of China's population in 2010. During the past decades ethnic minorities have experienced higher growth rates than the majority Han population, because they are not under the one-child policy. Their proportion of the population in China has grown from 6.1% in 1953, to 8.04% in 1990, 8.41% in 2000 and 8.49% in 2010. Large ethnic minorities (data according to the 2000 census) include the Zhuang (16 million, 1.28%), Manchu (10 million, 0.84%), Uyghur (9 million, 0.78%), Hui (9 million, 0.71%), Miao (8 million, 0.71%), Yi (7 million, 0.61%), Tujia (5.75 million, 0.63%), Mongols (5 million, 0.46%), Tibetan (5 million, 0.43%), Buyi (3 million, 0.23%), and Korean (2 million, 0.15%).
| Ethnic group | Language family | 1953 | % | 1964 | % | 1982 | % | 1990 | % | 2000 | % | 2010[16] | % |
|---|---|---|---|---|---|---|---|---|---|---|---|---|---|
| Han | Chinese | 547,283,057 | 93.94 | 651,296,368 | 94.22 | 936,703,824 | 93.30 | 1,039,187,548 | 91.92 | 1,137,386,112 | 91.53 | 1,220,844,520 | 91.60 |
| Minority groups | 35,320,360 | 6.06 | 39,883,909 | 5.78 | 67,233,254 | 6.67 | 90,570,743 | 8.01 | 105,225,173 | 8.47 | 111,966,349 | 8.40 | |
| Zhuang | Tai-Kadai | 6,611,455 | 1.13 | 8,386,140 | 1.21 | 13,441,900 | 1.32 | 15,555,820 | 1.38 | 16,178,811 | 1.28 | 16,926,381 | 1.27 |
| Hui | Chinese | 3,559,350 | 0.61 | 4,473,147 | 0.64 | 7,207,780 | 0.71 | 8,612,001 | 0.76 | 9,816,802 | 0.78 | 10,586,087 | 0.79 |
| Manchu | Tungusic | 2,418,931 | 0.42 | 2,695,675 | 0.39 | 4,299,950 | 0.43 | 9,846,776 | 0.87 | 10,682,263 | 0.84 | 10,387,958 | 0.78 |
| Uyghurs | Altaic (Turkic) | 3,640,125 | 0.62 | 3,996,311 | 0.58 | 5,917,030 | 0.59 | 7,207,024 | 0.64 | 8,399,393 | 0.66 | 10,069,346 | 0.76 |
| Miao | Miao-Yao / Hmong-Mien | 2,511,339 | 0.43 | 2,782,088 | 0.40 | 5,017,260 | 0.50 | 7,383,622 | 0.65 | 8,940,116 | 0.71 | 9,426,007 | 0.71 |
| Yi | Tibeto-Burman | 3,254,269 | 0.56 | 3,380,960 | 0.49 | 5,492,330 | 0.54 | 6,578,524 | 0.58 | 7,762,286 | 0.61 | 8,714,393 | 0.65 |
| Tujia | Tibeto-Burman | 284,900 | 0.03 | 5,725,049 | 0.51 | 8,028,133 | 0.63 | 8,353,912 | 0.63 | ||||
| Tibetans | Tibeto-Burman | 2,775,622 | 0.48 | 2,501,174 | 0.36 | 3,821,950 | 0.38 | 4,593,072 | 0.41 | 5,416,021 | 0.43 | 6,282,187 | 0.47 |
| Mongols | Altaic (Mongolic) | 1,462,956 | 0.25 | 1,965,766 | 0.28 | 3,402,200 | 0.34 | 4,802,407 | 0.42 | 5,813,947 | 0.46 | 5,981,840 | 0.45 |
| Buyei | Tai-Kadai | 1,247,883 | 0.21 | 1,348,055 | 0.19 | 2,103,150 | 0.21 | 2,548,294 | 0.22 | 2,971,460 | 0.23 | 2,870,034 | 0.22 |
| Korean | Korean | 1,120,405 | 0.19 | 1,339,569 | 0.19 | 1,783,150 | 0.18 | 1,923,361 | 0.17 | 1,923,842 | 0.15 | 1,830,929 | 0.14 |
| Dong | Tai-Kadai | 712802 | 836123 | 1,446,190 | 0.14 | 2,508,624 | 0.22 | 2,960,293 | 0.24 | 2,879,974 | 0.22 | ||
| Yao | Miao-Yao / Hmong-Mien | 665933 | 857265 | 1,414,870 | 0.14 | 2,137,033 | 0.19 | 2,637,421 | 0.21 | 2,796,003 | 0.21 | ||
| Bai | Sino-Tibetan | 567119 | 706623 | 1,147,360 | 0.11 | 1,598,052 | 0.14 | 1,858,063 | 0.15 | 1,933,510 | 0.15 | ||
| Hani | Tibeto-Burman | 481220 | 628727 | 1,063,300 | 0.11 | 1,254,800 | 0.11 | 1,439,673 | 0.12 | 1,660,932 | 0.12 | ||
| Kazakh | Altaic (Turkic) | 509375 | 491637 | 878,570 | 0.09 | 1,110,758 | 0.10 | 1,250,458 | 0.10 | 1,462,588 | 0.11 | ||
| Li | Tai-Kadai | 360950 | 438813 | 882,030 | 0.09 | 1,112,498 | 0.10 | 1,247,814 | 0.10 | 1,463,064 | 0.11 | ||
| Dai | Tai-Kadai | 478966 | 535389 | 864,340 | 0.09 | 1,025,402 | 0.09 | 1,158,989 | 0.09 | 1,261,311 | 0.09 | ||
| She | Miao-Yao / Hmong-Mien | 234167 | 379,080 | 0.04 | 634,700 | 0.06 | 709,592 | 0.06 | 708,651 | 0.05 | |||
| Lisu | Tibeto-Burman | 317465 | 270628 | 466,760 | 0.05 | 574,589 | 0.05 | 634,912 | 0.05 | 702,839 | 0.05 | ||
| Gelao | Tai-Kadai | 26852 | 59,810 | 0.01 | 438,192 | 0.04 | 579,357 | 0.05 | 550,746 | 0.04 | |||
| Dongxiang | Altaic (Mongolic) | 155761 | 147443 | 279523 | – | 373,669 | 0.03 | 513,805 | 0.04 | 621,500 | 0.05 | ||
| Gaoshan | Austronesian | 329 | 366 | 1,750 | 0.00 | 2,877 | 0.00 | 4,461 | 0.00 | 4,009 | 0.00 | ||
| Lahu | Tibeto-Burman | 139060 | 191241 | 320,350 | 0.03 | 411,545 | 0.04 | 453,705 | 0.04 | 485,966 | 0.04 | ||
| Sui | Tai-Kadai | 133566 | 156099 | 300,690 | 0.03 | 347,116 | 0.03 | 406,902 | 0.03 | 411,847 | 0.03 | ||
| Va | Mon-Khmer | 286158 | 200272 | 271,050 | 0.03 | 351,980 | 0.03 | 396,610 | 0.03 | 429,709 | 0.03 | ||
| Nakhi | Tibeto-Burman | 143453 | 156796 | 248,650 | 0.02 | 277,750 | 0.02 | 308,839 | 0.02 | 326,295 | 0.02 | ||
| Qiang | Tibeto-Burman | 35660 | 49105 | 109,760 | 0.01 | 198,303 | 0.02 | 306,072 | 0.02 | 309,576 | 0.02 | ||
| Tu | Altaic (Mongolic) | 53277 | 77349 | 148,760 | 0.01 | 192,568 | 0.02 | 241,198 | 0.02 | 289,565 | 0.02 | ||
| Mulao | Tai-Kadai | 52819 | 91,790 | 0.01 | 160,648 | 0.01 | 207,352 | 0.02 | 216,257 | 0.02 | |||
| Xibe | Tungusic | 19022 | 33438 | 77,560 | 0.01 | 172,932 | 0.02 | 188,824 | 0.02 | 190,481 | 0.01 | ||
| Kyrgyz | Altaic (Turkic) | 70944 | 70151 | 108,790 | 0.01 | 143,537 | 0.01 | 160,823 | 0.01 | 186,708 | 0.01 | ||
| Daur | Altaic (Mongolic) | 63394 | 94126 | – | 121,463 | 0.01 | 132,143 | 0.01 | 131,992 | 0.01 | |||
| Jingpo | Tibeto-Burman | 101852 | 57762 | 100,180 | 0.01 | 119,276 | 0.01 | 132,143 | 0.01 | 147,828 | 0.01 | ||
| Maonan | Tai-Kadai | 22382 | 37,450 | 0.00 | 72,370 | 0.01 | 107,106 | 0.01 | 101,192 | 0.01 | |||
| Salar | Altaic (Turkic) | 30658 | 69135 | 68,030 | 0.01 | 82,398 | 0.01 | 104,503 | 0.01 | 130,607 | 0.01 | ||
| Blang | Mon-Khmer | 39411 | 58473 | – | 87,546 | 0.01 | 91,882 | 0.01 | 119,639 | 0.01 | |||
| Tajik | Indo-European (Iranian) | 14462 | 16236 | 27,430 | 0.00 | 33,223 | 0.00 | 41,028 | 0.00 | 51,069 | 0.00 | ||
| Achang | Tibeto-Burman | 12032 | 31,490 | 0.00 | 27,718 | 0.00 | 33,936 | 0.00 | 39,555 | 0.00 | |||
| Pumi | Tibeto-Burman | 14298 | 18,860 | 0.00 | 29,721 | 0.00 | 33,600 | 0.00 | 42,861 | 0.00 | |||
| Ewenki | Tungusic | 4957 | 9681 | 19,440 | 0.00 | 26,379 | 0.00 | 30,505 | 0.00 | 30,875 | 0.00 | ||
| Nu | Tibeto-Burman | 15047 | 25,980 | 0.00 | 27,190 | 0.00 | 28,759 | 0.00 | 37,523 | 0.00 | |||
| Gin (Vietnamese) | Mon-Khmer | 12,140 | 0.00 | 18,749 | 0.00 | 22,517 | 0.00 | 28,199 | 0.00 | ||||
| Jino | Tibeto-Burman | 11,260 | 0.00 | 18,022 | 0.00 | 20,899 | 0.00 | 23,143 | 0.00 | ||||
| De'ang | Mon-Khmer | – | – | 15,461 | 0.00 | 17,935 | 0.00 | 20,556 | 0.00 | ||||
| Bonan | Altaic (Mongolic) | 4957 | 5125 | 6,620 | 0.00 | 11,683 | 0.00 | 16,505 | 0.00 | 20,074 | 0.00 | ||
| Russian | Indo-European (Slavic) | 22656 | 1326 | 2,830 | 0.00 | 13,500 | 0.00 | 15,609 | 0.00 | 15,393 | 0.00 | ||
| Yugur | Altaic (Turkic) | 3861 | 5717 | 7,670 | 0.00 | 12,293 | 0.00 | 13,719 | 0.00 | 14,378 | 0.00 | ||
| Uzbek | Altaic (Turkic) | 13626 | 7717 | 13,810 | 0.00 | 14,763 | 0.00 | 13,370 | 0.00 | 10,569 | 0.00 | ||
| Monba | Tibeto-Burman | 3809 | 1,040 | 0.00 | 7,498 | 0.00 | 8,923 | 0.00 | 10,561 | 0.00 | |||
| Oroqen | Tungusic | 2262 | 2709 | 2,280 | 0.00 | 7,004 | 0.00 | 8,196 | 0.00 | 8,659 | 0.00 | ||
| Derung | Tibeto-Burman | 4,250 | 0.00 | 5,825 | 0.00 | 7,426 | 0.00 | 6,930 | 0.00 | ||||
| Chinese Tatars | Altaic (Turkic) | 6929 | 2294 | 7,510 | 0.00 | 5,064 | 0.00 | 4,890 | 0.00 | 3,556 | 0.00 | ||
| Hezhen | Tungusic | 718 | 670 | 0.00 | 4,254 | 0.00 | 4,640 | 0.00 | 5,354 | 0.00 | |||
| Lhoba | Tibeto-Burman | 1,030 | 0.00 | 2,322 | 0.00 | 2,965 | 0.00 | 3,682 | 0.00 | ||||
| Unrecognized | 3,370,880 | 0.33 | 3,498 | 0.00 | 734,379 | 0.06 | 640,101 | 0.05 | |||||
| Unknown | 4,720 | 0.00 | 752,347 | 0.07 | 735,379 | 0.06 | – | – | |||||
| Foreigners | – | – | – | – | 941 | 0.00 | 1,448 | 0.00 | |||||
| Total mainland China | 582,603,417 | 694,581,759 | 1,008,175,288 | 1,133,682,501 | 1,242,612,226 | 1,332,810,869 | |||||||
Neither Hong Kong nor Macau recognizes the official ethnic classifications maintained by the central government. In Macau the largest substantial ethnic groups of non-Chinese descent are the Macanese, of mixed Chinese and Portuguese descent (Eurasians), as well as migrants from the Philippines and Thailand. Overseas Filipinas working as domestic workers comprise the largest non-Han Chinese ethnic group in Hong Kong.
People from other immigration jurisdictions
The 2010 Census counted 234,829 residents from Hong Kong, 21,201 residents from Macao, 170,283 residents from Taiwan, and 593,832 residents from other locations, totaling 1,020,145 residents.[17]
| Nationality | Residents |
|---|---|
| South Korea | 120,750 |
| United States | 71,493 |
| Japan | 66,159 |
| Burma | 39,776 |
| Vietnam | 36,205 |
| Canada | 19,990 |
| France | 15,087 |
| India | 15,051 |
| Germany | 14,446 |
| Australia | 13,286 |
| Other countries | 181,589 |
Languages
The official spoken standard in the People's Republic of China is Putonghua. Its pronunciation is based on the Beijing dialect of Mandarin, which was traditionally the formal version of the Mandarin or Chinese language.
Other languages and dialects include other Mandarin dialects, and Wu (Shanghainese), Yue (Cantonese), Minbei (Fuzhou), Minnan (Hokkien or Taiwanese, Teochiu), Xiang, Gan and Hakka, as well as languages of the minorities.
The seven major mutually unintelligible Chinese dialects are considered by some to be different languages of the Chinese language family, and by some others to be dialects of the Chinese language. Each of these dialects has many sub-dialects. Over 70% of the Han ethnic group are native speakers of the Mandarin group of dialects spoken in northern and southwestern China. The rest, concentrated in south and southeast China, speak one of the six other major Chinese dialects. In addition to the local dialect, nearly all also speak Standard Chinese or Mandarin (Putonghua), which pronunciation is based on the Beijing dialect, which itself is one of the Mandarin group of dialects, and is the language of instruction in all schools and is used for formal and official purposes.
Non-Chinese languages spoken widely by ethnic minorities include Mongolian, Tibetan, Uyghur and other Turkic languages (in Xinjiang), Korean (in the northeast), and Vietnamese (in the southeast).
In addition to Chinese, in the special administrative regions, English is an official language of Hong Kong and Portuguese is an official language of Macau. Patuá is a Portuguese creole spoken by a small number of Macanese. English, though not official, is widely used in Macau. In both of the special administrative regions, the dominant spoken form of Chinese is Cantonese.
For written Chinese, the PRC officially uses simplified Chinese characters in mainland China, while traditional Chinese characters are used in Hong Kong and Macau.
The de facto spoken standard in Hong Kong and Macao is Cantonese, although officially it is just the Chinese language, not specifying which spoken form is standard. The written official standard in Hong Kong and Macao is Mandarin in traditional Chinese characters.
On 1 January 1979, the PRC Government officially adopted the hanyu pinyin system for spelling Chinese names and places in mainland China in Roman letters. A system of romanization invented by the Chinese, pinyin has long been widely used in mainland China on street and commercial signs as well as in elementary Chinese textbooks as an aid in learning Chinese characters. Variations of pinyin also are used as the written forms of several minority languages.
Pinyin replaced other conventional spellings in mainland China's English-language publications. The U.S. Government and United Nations also adopted the pinyin system for all names of people and places in mainland China. For example, the capital of the PRC is spelled "Beijing" rather than "Peking".
Religions

■ Chinese traditional religions: including worship of gods and ancestors, Confucianism and Taoism
■ Buddhism
■ Islam
■ Ethnic minorities' indigenous religions
■ Mongolian shamanism
■ Dongbei folk religion and Manchu shamanism

China has long been a cradle and host to a variety of the most enduring religio-philosophical traditions of the world. Confucianism and Taoism, plus Buddhism, constitute the "three teachings", philosophical frameworks which historically have had a significant role in shaping Chinese culture.[20][21] Elements of these three belief systems are often incorporated into the traditional folk religions.[22] Chinese religions are family-oriented and do not demand exclusive adherence, allowing the practice or belief of several at the same time. Some scholars prefer not to use the term "religion" in reference to belief systems in China, and suggest "cultural practices", "thought systems" or "philosophies" as more appropriate terms.[23] There is a stimulating debate over what to call religion and who should be called religious in China.[24] The emperors of China claimed the Mandate of Heaven and participated in Chinese religious practices. Since 1949, China has been governed by the Communist Party of China, which, in theory, is as an officially atheist institution and prohibits party members from belonging to a religion.[25] During Mao Zedong's rule, religious movements were oppressed.[26] Under more recent leaders, religious organisations have been given more autonomy.[27] Presently, the Party formally and institutionally recognises five religions in China: Buddhism, Taoism, Islam, Protestantism, and Catholicism (though despite historic links, the Party enforces a separation of the Chinese Catholic Church from the Roman Catholic Church).[28]
Demographically, the largest group of religious traditions is the Chinese folk religion, which overlaps with Taoism, and describes the worship of the shen 神, a character that signifies the "energies of generation", comprising deities of the natural environment, gods of human groups, heroes and ancestors, and figures from Chinese mythology.[29] Among widespread cults even officially promoted there are those of Mazu (goddess of the seas),[30] Huangdi (divine patriarch of all the Chinese, "Volksgeist" of the Chinese nation),[31] Guandi (god of war and business), Caishen (god of prosperity and richness), Pangu and many others. China has many of the world's tallest statues, including the tallest of all, the Spring Temple Buddha in Henan. Most of them represent buddhas and deities and have been built in the 2000s.
Scholars have noted that in China there is no clear boundary between religions, especially Buddhism, Taoism and local folk religious practice.[32] According to the most recent demographic analyses, an average 30—80% of the population in China, that is hundreds of millions of people, practice some kinds of Chinese folk religions and Taoism, 10—16% are Buddhists, 2—4% are Christians, and 1—2% are Muslims. In addition to Han people's local religious practices, there are also various ethnic minority groups in China who maintain their traditional autochthone religions. Various sects of indigenous origin gather 2—3% of the population, while Confucianism as a religious self-designation is popular among intellectuals.
Significant faiths specifically connected to certain ethnic groups include Tibetan Buddhism and the Islamic religion of the Hui and Uyghur peoples. Christianity in China was introduced two times between the 7th and the 15th centuries, but failed to take root.[33] It was reintroduced in the 16th century by Jesuit missionaries. Protestant missions and later Catholic missionaries expanded the presence of Christianity, which influenced the Taiping Rebellion of the mid 19th century. Under Communism, foreign missionaries were expelled, most churches closed and their schools, hospitals and orphanages seized.[34] During the Cultural Revolution, many priests were imprisoned.[35] After the late 1970s, religious freedoms for Christians improved.[36]
Migration
Urbanization
CIA World Factbook
The following demographic statistics are from the CIA World Factbook, unless otherwise indicated. No statistics have been included for areas currently governed by the Republic of China (Taiwan). Unless stated otherwise, statistics refer only to mainland China. (See Demographics of Hong Kong and Demographics of Macau.)
- Population
- Mainland only: 1,338,612,968 (2009)
- Hong Kong: 7,055,071 (2009)
- Macau: 559,846 (2009)
- Total: 1,346,227,885 (2009).
- Population rank: 1 (See List of countries by population.)
- Urban-rural ratio
- Urban: 49.68% (2010) — 665,570,000
- Rural: 50.32% (2010) — 674,150,000
- Age structure

starting with 0–5 years in the bottom box.
Effects of the one-child policy result in smaller age cohorts in recent years.
- 0–14 years: 16.60% (2011)
- 15–64 years: 72.1% (male 495,724,889/female 469,182,087) (2009)
- Population growth rate
- Population growth rate: 0.57% (2000–2010 average)
- Sex distribution
- Sex distribution: male 51.27%; female 48.73% (2010)
- Sex ratio
- At birth: 1.133 male(s)/female (2011)
- Under 15 years: 1.17 male(s)/female (2011)
- 15–64 years: 1.06 male(s)/female (2011)
- 65 years and over: 0.93 male(s)/female (2011)
- Total population: 1.06 male(s)/female (2011)
- Infant mortality rate
- Total: 15.2 deaths/1,000 live births (2013 est)
- Male: 15.16 deaths/1,000 live births (2013 est)
- Female: 15.25 deaths/1,000 live births (2013 est)
See Infant mortality in China
- Child mortality
- 415,000 children (under 16) died in China in 2006 (4.3% of the world total)[37]
- Life expectancy at birth
- Total population: 74.99 years (2013)
- Male: 72.96 years (2013)
- Female: 77.27 years (2013)
- Marriage and divorce
- Marriage rate: 6.3/1,000 population (2006)
- Divorce rate: 1.0/1,000 population (2006)
- Literacy rate
Age 15 and over can read and write:
- Total population: 95.92% (2010 census)
- Male: 95.1% (2000 census)
- Female: 86.5% (2000 census)
- Educational attainment
As of 2000, percentage of population age 15 and over having:
- no schooling and incomplete primary: 15.6%
- completed primary: 35.7%
- some secondary: 34.0%
- complete secondary: 11.1%
- some postsecondary through advanced degree: 3.6%
- Religious affiliation
- Predominantly: Mahayana Buddhism, Taoism (Chinese folk religion), Confucianism (via ancestral worship).
- Others: Christianity (3% – 4%), Islam (1.5%), ethnic minority religions, others.
- Note: State atheism, but traditionally pragmatic and eclectic.
- Major cities
| Provincial level Administrative divisions of China by: |
|---|
Only urban population stated (over 1 million people at least), as of 2005:
- Shenzhen 10,357,968
- Shanghai 10,030,800
- Beijing 7,699,300
- Suzhou 6,521,300
- Tianjin 4,933,100
- Guangzhou 4,653,100
- Wuhan 4,593,400
- Chongqing 4,239,700
- Shenyang 3,995,500
- Nanjing 2,966,000
- Harbin 2,735,100
- Chengdu 2,664,000
- Xi'an 2,657,900
- Jinan 2,346,000
- Changchun 2,283,800
- Dalian 2,181,600
- Hangzhou 2,059,800
- Shijiazhuang 1,971,000
- Taiyuan 1,970,300
- Qingdao 1,930,200
- Zhengzhou 1,770,800
- Kunming 1,597,800
- Lanzhou 1,576,400
- Changsha 1,562,200
- Xiamen 1,532,200.
- Households
- Average household size: 3.10
- Total households: 401,520,000
- Of which are family households: 340,491,197 (96.9%)
- Of which are collective households: 10,742,501 (3.1%)
- HIV
- See HIV/AIDS in China.
- Adult population (ages 15–49) living with HIV: 0.15% (2008)
- People living with HIV/AIDS: 100,000 (2008)
- HIV/AIDS deaths: 44,000 (2003)
- Causes of death
Major causes of death per 100,000 population, based on 2004 urban population samples:
- malignant neoplasms (cancers): 119.7
- cerebrovascular disease: 88.4
- respiratory diseases: 78.1
- heart diseases: 74.1
- accidents, violence, and poisoning: 43.5
- Income
As of 2003, the distribution of urban household income:
- Average per capita disposable income by quintile: Y 9,061 [U.S.$1,398]
- first quintile: Y 3,285
- second quintile: Y 5,377
- third quintile: Y 7,279
- fourth quintile: Y 9,763
- fifth quintile: Y 17,431
- Working life
Quality of working life:
- Average workweek: 40 hours (1998)
- Annual rate per 100,000 workers for: (1997)
- injury or accident: 0.7
- industrial illness: 36
- death: 1.4
- Death toll from work accidents: 127,000 (2005)
- Funds for pensions and social welfare relief: Y 26,668,000,000 (2001)
- Access to services
- Percentage of population having access to electricity (2000): 98.6%
- Percentage of total population with safe public water supply (2002): 83.6% (urban, rural: 94.0%, 73.0%)
- Sewage system (1999): total (urban, rural)
- households with flush apparatus 20.7% (50.0%, 4.3%)
- with pit latrines 69.3% (33.6%, 86.7%)
- with no latrine 5.3% (7.8%, 4.1%)
- Social participation
- Eligible voters participating in last national election: n/a
- Population participating in voluntary work: n/a
- Trade union membership in total labor force (2005): 18%
- Practicing religious population in total affiliated population: n/a
- Social deviance
Annual reported arrest rate per 100,000 population (2006) for:
- Property violation: 20.7
- Infringing personal rights: 7.2
- Disruption of social administration: 3.3
- Endangering public security: 1.010
- Material wellbeing
Urban households possessing (number per household; 2003):
- bicycles: 1.4
- colour televisions: 1.3
- washing machines: 0.9
- refrigerators: 0.9
- cameras: 0.5
Rural families possessing (number per household; 2003):
- bicycles: 1.2
- colour televisions: 0.7
- washing machines: 0.2
- refrigerators: 0.1
- cameras: 0.02
- Household income and expenditure
- Average household size (2005) 3.1; rural households 3.3; urban households 3.0.
- Average annual per capita disposable income of household (2005): rural households Y 3,255 (U.S.$397), urban households Y 10,493 (U.S.$1,281).
- Sources of income (2003): rural households — income from household businesses 75.7%, wages 19.1%, transfers 3.7%, other 1.5%; urban households — wages 70.7%, transfers 23.3%, business income 4.5%, other 1.5%.
- Expenditure: rural (urban) households — food 45.6% (37.1%), housing 15.9% (10.7%), education and recreation 12.1% (14.4%), transportation and communications 8.4% (11.1%), clothing 5.7% (9.8%), medicine and medical service 6.0% (7.1%), household furnishings 4.2% (6.3%).
- Employment
- Population economically active (2003): total 760,800,000.
- Activity rate of total population 58.9% (participation rates: over age 15 [2001] 77.7%; female [2001] 37.8%; registered unemployed in urban areas [December 2004] 4.2%).
- Urban employed workforce (2001): 239,400,000; by sector: state enterprises 76,400,000, collectives 28,130,000, self-employment or privately run enterprises 134,870,000.
- Rural employed workforce: 490,850,000.
See also
- Metropolitan regions of China
- Metropolitan cities of China
- Demography of Central Asia
- Demographics of Beijing
Notes
References
- ↑ Statistics about the Population Growth in China, 2001–2011, World Bank, July 2012. Retrieved 10 April 2013.
- ↑ "Tough road ahead for China census". Straitstimes.com. Retrieved 14 October 2013.
- ↑ 3.0 3.1 James E. McClellan III; Harold Dorn. Science and Technology in World History: An Introduction. JHU Press; 14 April 2006. ISBN 978-0-8018-8360-6. p. 119.
- ↑ 4.0 4.1 "中华人民共和国国家统计局 >> 人口普查公报". Stats.gov.cn. Retrieved 14 October 2013.
- ↑ "Chinese mainland gender ratios most balanced since 1950s: census data". News.xinhuanet.com. 28 April 2011. Retrieved 14 October 2013.
- ↑ "US Census Bureau". Census.gov. Retrieved 14 October 2013.
- ↑ http://esa.un.org/unpd/wpp/unpp/p2k0data.asp
- ↑ "National Bureau of Statistics of China: China Statistical yearbook 2011, chapter 3 Population". Stats.gov.cn. Retrieved 14 October 2013.
- ↑ China’s Economy Showed Good Momentum of Steady Growth in the Year of 2013
- ↑ "Pascal Rocha da Silva, Projection de la population chinoise 2000–2050, p. 9, cf." (PDF). Retrieved 14 October 2013.
- ↑ FERTILITY IN CHINA IN 2000: A COUNTY LEVEL ANALYSIS
- ↑ 12.0 12.1 http://www.iussp.org/sites/default/files/event_call_for_papers/New%20fertility%20changes%20and%20characteristics%20from%20the%20sixth%20population%20census%20in%20China-isupp-11.21_0.pdf
- ↑ http://blog.sciencenet.cn/blog-385383-765643.html
- ↑ Jamil Anderliniin; Ed Crooks (19 January 2013). "Chinese Labor Pool Begins to Drain". CNBC. Financial Times. Retrieved 8 February 2013.
- ↑ "CIA World Fact Book". Retrieved 27 November 2013.
- ↑ http://www.stats.gov.cn/tjsj/pcsj/rkpc/6rp/excel/A0201.xls
- ↑ "Major Figures on Residents from Hong Kong, Macao and Taiwan and Foreigners Covered by 2010 Population Census". Stats.gov.cn. Retrieved 14 October 2013.
- ↑ Source map #1. DUMORTIER, Brigitte, 2002, Atlas des religions, Autrement, collection Atlas, Paris, p. 32.
- ↑ Source map #2. Narody Vostochnoi Asii ("Ethnic Groups of East Asia" (1965)), Zhongguo Minsu Dili ("Folklore Geography of China" (1999)), Zhongguo Dili ("Geography of China" (2002)).
- ↑ Yao, 2011. p. 11
- ↑ Miller, 2006. p. 57
- ↑ Xie, 2006. p. 73
- ↑ Rodney L. Taylor. Proposition and Praxis: The Dilemma of Neo-Confucian Syncretism. On: Philosophy East and West, Vol. 32, No. 2, April 1982. p. 187
- ↑ Appropriation and Control: the Category of "Religion", and How China Defines It. Chapter Three in: Torri Gunn, Defining Religion with Chinese Characters: Interrogating the Criticism of the Freedom of Religion in China. University of Ottawa, 2011. pp. 17–50
- ↑ Kuhn, 2011. p. 373
- ↑ Kuhn, 2011. p. 362
- ↑ Kuhn, 2011. p. 368
- ↑ Rowan Callick. Party Time: Who Runs China and How. Black Inc, 2013. p. 112
- ↑ Steven F. Teiser. What is Popular Religion?. Part of: Living in the Chinese Cosmos, Asia for Educators, Columbia University. Extracts from: Stephen F. Teiser. The Spirits of Chinese Religion. In: Religions of China in Practice. Princeton University Press, 1996.
- ↑ China Zentrum: Religions & Christianity in Today's China. Vol. IV, 2014, No. 1. ISSN 2192-9289. pp. 22-23
- ↑ Sautman, 1997. pp. 80-81
- ↑ Yao, 2011. pp. 9-10
- ↑ Daniel H. Bays. Christianity in China: From the Eighteenth Century to the Present. Chapter One: The Nestorian Age and the Mongol Mission, 635-1368. Stanford University Press, 1999. ISBN 0804736510
- ↑ Geoffrey Blainey. A Short History of Christianity. Viking, 2011. p. 508
- ↑ Geoffrey Blainey. A Short History of Christianity. Viking, 2011. p. 531
- ↑ Geoffrey Blainey. A Short History of Christianity. Viking, 2011. p. 532
- ↑ "archives". Taipei Times. 8 October 2013. Retrieved 14 October 2013.
- ↑ "China – Religion". Atheism.about.com. 16 December 2009. Retrieved 14 October 2013.
- ↑ "CIA Factbook – China". Cia.gov. Retrieved 14 October 2013.
- ↑ "Bureau of East Asian and Pacific Affairs – Background Note: China". State.gov. 16 August 2013. Retrieved 14 October 2013.
- ↑ "Chinese Religions". Asia.msu.edu. 15 May 2013. Retrieved 14 October 2013.
 This article incorporates public domain material from the Library of Congress Country Studies document "A Country Study: China".
- This article incorporates public domain material from websites or documents of the CIA World Factbook.
Sources
- Kuhn, Robert Lawrence. How China's Leaders Think: The Inside Story of China's Past, Current and Future Leaders. John Wiley & Sons, 2011. ISBN 1118104250
- Miller, James. Chinese Religions in Contemporary Societies. ABC-CLIO, 2006. ISBN 1851096264
- Yao, Xinzhong. Chinese Religion: A Contextual Approach. Bloomsbury Academic, 2010. ISBN 1847064760
- Xie, Zhibin. Religious Diversity and Public Religion in China. Ashgate Publishing, 2006. ISBN 9780754656487
External links
- China Population Information and Research Center (CPIRC)
- China Population Association
- National Population and Family Planning Commission
- CASS Institute of Population and Labor Economics
- China Statistical Information Net
- Office of the National Working Committee on Aging – China's State Council's vice-ministerial level institution on Aging
- China Population Welfare Foundation
- China Reproductive Health Network
- Chinese Journal of Population Science 《中国人口科学》
- Chinese Journal of Population, Resources and Environment 中国人口·资源与环境
- China: Population by Age and Sex, 1950 – 2050; Proportion Elderly, Working Age, and Children
- China's population composition over time, 1950–2050
- United Nations "World Population Prospects": Country Profile – China
- The 200 best books on China
- China population projection graph comparing with other countries (2002 - 2099)
- Demographic statistics for China Online
| ||||||||||||||
| ||||||||||||||||||||||||||||||||||||||||||||||||||||||||||||||||||||||||||||||||||||||||||
| ||||||||||||||||||||||||||||||||||||||||||||||||||||||||||