Danish general election, 2001
Danish general election, 2001
|
|
|
|
All 179 seats to the Folketing
90 seats were needed for a majority |
| Turnout |
87.1% |
| |
First party |
Second party |
|
| |
 |
 |
|
| Leader |
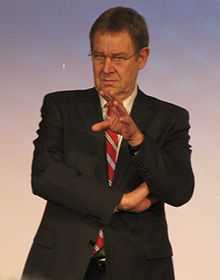
Anders Fogh Rasmussen |
Poul Nyrup Rasmussen |
|
| Party |
Venstre |
Social Democrats |
|
| Last election |
42 seats, 24.0% |
63 seats, 35.9% |
|
| Seats won |
56 |
52 |
|
| Seat change |
+14 |
-11 |
|
| Popular vote |
1,077,858 |
1,003,023 |
|
| Percentage |
31.2% |
29.1% |
|
|
|
General elections were held in Denmark on 20 November 2001.[1] For the first time since the 1924 the Social Democrats did not win the most seats. Anders Fogh Rasmussen of the centre-right Venstre became Prime Minister in coalition with the Conservative People's Party, as the head of the first Rasmussen government. The coalition relied on the vote of other right-wing parties such as the Danish People's Party, which polled better than ever before. Voter turnout was 87.1% in Denmark proper, 80.0% in the Faroe Islands and 61.5% in Greenland.[2] The Venstre led coalition government would last until the 2011 election, lasting through two intermediate elections.
The election marked a major shift in Danish politics: It was the first time that the right leaning parties held an outright majority in the parliament since the beginning of the modern democratic system in Denmark in 1901.[3] (Although right leaning parties had held power numerous times, they had always had to share power with more centrist or leftist parties in coalition governments.) Historian Bo Lidegaard believes that the vote showed a move away from broad national consensus which had existed since the 1930s about the style of governance in Denmark. One of the most important changes that forced the change was the rise of immigration as a political issue and the ensuing rise of the Danish People's Party.[3] Immigration played a central role in the 2001 campaign. It was thrust into focus by the 11 September 2001 terrorist attacks in the United States, but had been gaining attention for years.[3]
Results
| Denmark |
|---|
| Party |
Votes |
% |
Seats |
+/– |
| Venstre | 1,077,858 | 31.2 | 56 | +14 |
| Social Democratic Party | 1,003,323 | 29.1 | 52 | –11 |
| Danish People's Party | 413,987 | 12.0 | 22 | +9 |
| Conservative People's Party | 312,770 | 9.1 | 16 | ±0 |
| Socialist People's Party | 219,842 | 6.4 | 12 | –1 |
| Danish Social Liberal Party | 179,023 | 5.2 | 9 | +2 |
| Red-Green Alliance | 82,685 | 2.4 | 4 | –1 |
| Christian People's Party | 78,793 | 2.3 | 4 | ±0 |
| Centre Democrats | 61,031 | 1.8 | 0 | –8 |
| Progress Party | 19,340 | 0.5 | 0 | –4 |
| Independents | 1,016 | 0.0 | 0 | ±0 |
| Invalid/blank votes | 35,247 | – | – | – |
| Total | 3,484,915 | 100 | 175 | 0 |
| Faroe Islands |
| Union Party | 7,208 | 27.3 | 1 | +1 |
| Republican Party | 6,578 | 24.9 | 1 | +1 |
| Social Democratic Party | 6,187 | 23.4 | 0 | –1 |
| People's Party | 5,417 | 20.5 | 0 | –1 |
| Centre Party | 569 | 2.2 | 0 | New |
| Self-Government Party | 434 | 1.6 | 0 | ±0 |
| Invalid/blank votes | 105 | – | – | – |
| Total | 26,393 | 100 | 2 | 0 |
| Greenland |
| Inuit Ataqatigiit | 7,172 | 30.8 | 1 | +1 |
| Forward | 6,033 | 25.9 | 1 | ±0 |
| Feeling of Community | 5,138 | 22.1 | 0 | –1 |
| Independents | 4,917 | 21.1 | 0 | ±0 |
| Invalid/blank votes | 559 | – | – | – |
| Total | 23,819 | 100 | 2 | 0 |
| Source: Nohlen & Stöver |
| Popular vote |
|---|
|
|
|
|
|
| V |
|
31.25% |
| A |
|
29.08% |
| O |
|
12.00% |
| C |
|
9.07% |
| F |
|
6.37% |
| B |
|
5.19% |
| Ø |
|
2.40% |
| Q |
|
2.28% |
| D |
|
1.77% |
| Z |
|
0.56% |
| Others |
|
0.03% |
References
- ↑ Nohlen, D & Stöver, P (2010) Elections in Europe: A data handbook, p525 ISBN 978-3-8329-5609-7
- ↑ Nohlen & Stöver, p549
- ↑ 3.0 3.1 3.2 Lidegaard, Bo (2011). En Fortælling om Danmark i det 20. Århundrede (in Danish). Copenhagen: Gyldendal. p. 428.