Crawley (UK Parliament constituency)
Coordinates: 51°06′47″N 0°10′59″W / 51.113°N 0.183°W
| Crawley | |
|---|---|
|
Borough constituency for the House of Commons | |
|
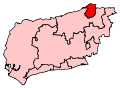
Boundary of Crawley in West Sussex. | |
|
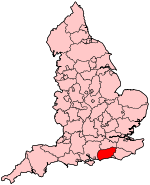
Location of West Sussex within England. | |
| County | West Sussex |
| Electorate | 71,793 (December 2010)[1] |
| Major settlements | Crawley |
| Current constituency | |
| Created | 1983 |
| Member of parliament | Henry Smith (Conservative) |
| Number of members | One |
| Created from | Horsham and Crawley |
| Overlaps | |
| European Parliament constituency | South East England |
Crawley is a constituency[n 1] represented in the House of Commons of the UK Parliament since 2010 by Henry Smith of the Conservative Party.[n 2]
Boundaries
1983-1997: The Borough of Crawley; and the District of Mid Sussex wards of Balcombe, Copthorne and Worth, Crawley Down, Slaugham, and Turners Hill.
1997-present: The Borough of Crawley.
The constituency covers the whole of the town and borough of Crawley in West Sussex which includes London Gatwick Airport. Crawley borders Horsham in the same county on all sides other than the north, where it borders a part of East Surrey.
The Boundary Commission analysed population increase and recommended that no changes to the constituency were made for the 2010 general election so the seat remains coterminous with the borough.
History
Before the 1983 General Election, Crawley had been part of the Horsham & Crawley, Horsham, and Horsham & Worthing constituencies at times. Due to the growth of Crawley, which was a small town, into a substantial new town in the 1960s and 70s, the Boundary Commission took the decision to separate it from Horsham in 1983 and create a new seat. Labour majorities with comfortable victories in 1997 and 2001 suggested a safe seat, but the sometimes volatile nature of new town voters, especially in South-East England, made the seat highly marginal in 2005. Labour had a majority of 37 votes in the 2005 election, making this seat the most marginal in the UK. The 2010 election saw Henry Smith win the seat at the third attempt, beating Labour's Chris Oxlade by 5,928, on an (averaged two-party) swing of 6.3%.[2]
Members of Parliament
| Election | Member[3] | Party | |
|---|---|---|---|
| 1983 | Nicholas Soames | Conservative | |
| 1997 | Laura Moffatt | Labour | |
| 2010 | Henry Smith | Conservative | |
Elections
Elections in the 2010s
| General Election 2015: Crawley[4] | |||||
|---|---|---|---|---|---|
| Party | Candidate | Votes | % | ±% | |
| UKIP | Christopher Brown[5] | ||||
| Green | Guy Hudson[6] | ||||
| Liberal Democrat | Sarah Osborne[7] | ||||
| Labour | Chris Oxlade [8] | ||||
| Conservative | Henry Smith [9] | ||||
The Christian Peoples Alliance announced Katherine Mills as candidate,[10] but she did not stand.
| General Election 2010: Crawley[2] | |||||
|---|---|---|---|---|---|
| Party | Candidate | Votes | % | ±% | |
| Conservative | Henry Smith | 21,264 | 44.8 | +5.8 | |
| Labour | Chris Oxlade | 15,336 | 32.3 | −6.8 | |
| Liberal Democrat | John Vincent | 6,844 | 14.4 | −1.1 | |
| BNP | Richard Trower | 1,672 | 3.5 | +0.5 | |
| UKIP | Chris French | 1,382 | 2.9 | +0.7 | |
| Green | Phil Smith | 598 | 1.3 | N/A | |
| Justice Party | Arshad Khan | 265 | 0.6 | +0.1 | |
| Independent | Andrew Hubner | 143 | 0.3 | N/A | |
| Majority | 5,928 | 12.5 | +12.6 | ||
| Turnout | 47,504 | 65.3 | +6.9 | ||
| Conservative gain from Labour | Swing | +6.3 | |||
Elections in the 2000s
| General Election 2005: Crawley | |||||
|---|---|---|---|---|---|
| Party | Candidate | Votes | % | ±% | |
| Labour | Laura Moffatt | 16,411 | 39.1 | −10.2 | |
| Conservative | Henry Smith | 16,374 | 39.0 | +6.8 | |
| Liberal Democrat | Rupert Sheard | 6,503 | 15.5 | +2.8 | |
| BNP | Richard Trower | 1,277 | 3.0 | N/A | |
| UKIP | Ronald Walters | 935 | 2.2 | −0.7 | |
| Democratic Socialist Alliance - People Before Profit | Robin Burnham | 263 | 0.6 | N/A | |
| Justice Party | Arshad Khan | 210 | 0.5 | −0.2 | |
| Majority | 37 | 0.1 | |||
| Turnout | 41,973 | 58.4 | +3.2 | ||
| Labour hold | Swing | −8.5 | |||
| General Election 2001: Crawley | |||||
|---|---|---|---|---|---|
| Party | Candidate | Votes | % | ±% | |
| Labour | Laura Moffatt | 19,488 | 49.3 | −5.7 | |
| Conservative | Henry Smith | 12,718 | 32.2 | +0.4 | |
| Liberal Democrat | Linda Seekings | 5,009 | 12.7 | +4.5 | |
| UKIP | Brian Galloway | 1,137 | 2.9 | +2.2 | |
| Monster Raving Loony | Claire Staniford | 383 | 1.0 | N/A | |
| Justice Party | Arshad Khan | 271 | 0.7 | +0.2 | |
| Socialist Labour | Karl Stewart | 260 | 0.7 | N/A | |
| Socialist Alliance | Muriel Hirsch | 251 | 0.6 | N/A | |
| Majority | 6,770 | 17.1 | −6.2 | ||
| Turnout | 39,517 | 55.2 | −17.7 | ||
| Labour hold | Swing | −3.1 | |||
Elections in the 1990s
| General Election 1997: Crawley | |||||
|---|---|---|---|---|---|
| Party | Candidate | Votes | % | ±% | |
| Labour | Laura Moffatt | 27,750 | 55.1 | +14.7 | |
| Conservative | Josephine Crabb | 16,043 | 31.8 | −12.1 | |
| Liberal Democrat | Harold De Souza | 4,141 | 8.2 | −6.3 | |
| Referendum Party | Ronald Walters | 1,931 | 3.8 | N/A | |
| UKIP | Eric Saunders | 322 | 0.6 | N/A | |
| Justice Party | Arshad Khan | 230 | 0.5 | N/A | |
| Majority | 11,707 | 23.3 | |||
| Turnout | 50,417 | 72.9 | |||
| Labour gain from Conservative | Swing | ||||
This constituency underwent boundary changes between the 1992 and 1997 general
elections and thus change in share of vote is based on a notional calculation.
| General Election 1992: Crawley[11] | |||||
|---|---|---|---|---|---|
| Party | Candidate | Votes | % | ±% | |
| Conservative | Nicholas Soames | 30,204 | 48.8 | −0.7 | |
| Labour | Laura Moffatt | 22,439 | 36.2 | +7.2 | |
| Liberal Democrat | Gordon Seekings | 8,558 | 13.8 | −7.7 | |
| Green | Mark Wilson | 766 | 1.2 | N/A | |
| Majority | 7,765 | 12.6 | −7.9 | ||
| Turnout | 61,967 | 79.2 | +2.1 | ||
| Conservative hold | Swing | −4.0 | |||
Elections in the 1980s
| General Election 1987: Crawley | |||||
|---|---|---|---|---|---|
| Party | Candidate | Votes | % | ±% | |
| Conservative | Nicholas Soames | 29,259 | 49.5 | +1.4 | |
| Labour | Paul John Leo | 17,121 | 29.0 | +2.8 | |
| Social Democratic | David Norman Simmons | 12,674 | 21.5 | −4.2 | |
| Majority | 12,138 | 20.5 | |||
| Turnout | 59,054 | 77.1 | +0.7 | ||
| Conservative hold | Swing | −0.7 | |||
| General Election 1983: Crawley | |||||
|---|---|---|---|---|---|
| Party | Candidate | Votes | % | ±% | |
| Conservative | Nicholas Soames | 25,963 | 48.1 | N/A | |
| Labour | Les Allen | 14,149 | 26.2 | N/A | |
| Social Democratic | T. Forrester | 13,900 | 25.7 | N/A | |
| Majority | 11,814 | 21.9 | N/A | ||
| Turnout | 54,012 | 76.4 | N/A | ||
| Conservative win (new seat) | |||||
See also
Notes and references
- Notes
- References
- ↑ "Electorate Figures - Boundary Commission for England". 2011 Electorate Figures. Boundary Commission for England. 4 March 2011. Retrieved 13 March 2011.
- ↑ 2.0 2.1 BBC - Election 2010 - Crawley
- ↑ Leigh Rayment's Historical List of MPs – Constituencies beginning with "C" (part 6)
- ↑ http://ukpollingreport.co.uk/2015guide/crawley/
- ↑ "Website". Chris Brown. Retrieved 1 March 2015.
- ↑ Meet the candidates
- ↑ http://crawley-libdems.org.uk/en/page/sarah-osborne Crawley Liberal Democrats have announced that Sarah Osborne will be their 2015 Parliamentary Candidate.]
- ↑ http://electionresults.blogspot.co.uk/2013/04/crawley-2015.html
- ↑ http://electionresults.blogspot.co.uk/2013/04/crawley-2015.html
- ↑ "CPA Candidates for the General Election". Christian Peoples Alliance. Retrieved 15 April 2015.
- ↑ "Politics Resources". Election 1992. Politics Resources. 9 April 1992. Retrieved 2010-12-06.
Sources
- Election result, 2005 (BBC)
- Election results, 1997 - 2001 (BBC)
- Election results, 1997 - 2001 (Election Demon)
- Election results, 1983 - 1992 (Election Demon)
- Election results, 1992 - 2005 (Guardian)
| ||||||||||||||||||||||||||||||||||||||||||