Cost of electricity by source

Note: employed technologies and LCOE differ by country and change over time.
The cost of electricity generated by different sources is a calculation of the cost of generating electricity at the point of connection to a load or electricity grid. The cost is typically given per kilowatt-hour or megawatt-hour. It includes the initial capital, discount rate, as well as the costs of continuous operation, fuel, and maintenance. This type of calculation assists policy makers, researchers and others to guide discussions and decision making.
LCOE is the levelized cost of electricity, which attempts to compare different methods of electricity generation in cost terms on a comparable basis. It is an economic assessment of the average total cost to build and operate a power-generating asset over its lifetime divided by the total power output of the asset over that lifetime. The LCOE can also be regarded as the cost at which electricity must be generated in order to break-even over the lifetime of the project.
Cost factors
While calculating costs, several internal cost factors have to be considered.[1] (Note the use of "costs," which is not the actual selling price, since this can be affected by a variety of factors such as subsidies and taxes):
- Capital costs (including waste disposal and decommissioning costs for nuclear energy) - tend to be low for fossil fuel power stations; high for wind turbines, solar PV; very high for waste to energy, wave and tidal, solar thermal, and nuclear.
- Fuel costs - high for fossil fuel and biomass sources, low for nuclear, and zero for many renewables.
- Factors such as the costs of waste (and associated issues) and different insurance costs are not included in the following: Works power, own use or parasitic load - that is, the portion of generated power actually used to run the stations pumps and fans has to be allowed for.
To evaluate the total cost of production of electricity, the streams of costs are converted to a net present value using the time value of money. These costs are all brought together using discounted cash flow.[2][3]
Levelized cost of electricity
The levelized cost of electricity (LCOE), also known as Levelized Energy Cost (LEC), is the net present value of the unit-cost of electricity over the lifetime of a generating asset. It is often taken as a proxy for the average price that the generating asset must receive in a market to break even over its lifetime. It is a first-order economic assessment of the cost competitiveness of an electricity-generating system that incorporates all costs over its lifetime: initial investment, operations and maintenance, cost of fuel, cost of capital.
The levelized cost is that value for which an equal-valued fixed revenue delivered over the life of the asset's generating profile would cause the project to break even. This can be roughly calculated as the net present value of all costs over the lifetime of the asset divided by the total electricity output of the asset:[4]

where
-
 = Levelized cost of electricity
 -
 = Investment expenditures in the year t
 -
 = Operations and maintenance expenditures in the year t
 -
 = Fuel expenditures in the year t
 -
 = Electricity generation in the year t
 -
 = Discount rate
 -
 = Life of the system
Note: Some caution must be taken when using formulas for the levelized cost, as they often embody unseen assumptions, neglect effects like taxes, and may be specified in real or nominal levelized cost. For example, other versions of the above formula do not discount the electricity stream.
Typically the LCOE is calculated over the design lifetime of a plant, which is usually 20 to 40 years, and given in the units of currency per kilowatt-hour or megawatt-day, for example AUD/kWh or EUR/kWh or per megawatt-hour, for example AUD/MWh (as tabulated below).[5] However, care should be taken in comparing different LCOE studies and the sources of the information as the LCOE for a given energy source is highly dependent on the assumptions, financing terms and technological deployment analyzed.[5] In particular, assumption of capacity factor has significant impact on the calculation of LCOE. Thus, a key requirement for the analysis is a clear statement of the applicability of the analysis based on justified assumptions.[5]
Many scholars have described limits to the "levelized cost of electricity" metric for comparing new generating sources. In particular, LCOE ignores time effects associated with matching production to demand. This happens at two levels: (1) dispatchability, the ability of a generating system to come online, go offline, or ramp up or down, quickly as demand swings; and (2) the extent to which the availability profile matches or conflicts with the market demand profile. Thermally lethargic technologies like coal and nuclear are physically incapable of fast ramping. Capital intensive technologies such as wind, solar, and nuclear are economically disadvantaged unless generating at maximum availability since the LCOE is nearly all sunk-cost capital investment. Intermittent power sources, such as wind and solar, may incur extra costs associated with needing to have storage or backup generation available.[6] At the same time, intermittent sources can be competitive if they are available to produce when demand and prices are highest, such as solar during mid-day peaks seen in summertime load profiles.[5] Despite these time limitations, leveling costs is often a necessary prerequisite for making comparisons on an equal footing before demand profiles are considered, and the levelized-cost metric is widely used for comparing technologies at the margin, where grid implications of new generation can be neglected.
Marginal cost of electricity
A more telling economic assessment might be the marginal cost of electricity. This value would serve the purpose of comparing the added cost of increasing electricity generation by one unit from different sources of electricity generation (see Merit Order).
Avoided cost
The US Energy Information Administration has cautioned that levelized costs of non-dispatchable sources such as wind or solar should be compared to the avoided energy cost rather than the levelized cost of dispatchable sources such as fossil fuels or geothermal. This is because introduction of fluctuating power sources may or may not avoid capital and maintenance costs of backup dispatchable sources.[7]
External costs of energy sources
Typically pricing of electricity from various energy sources may not include all external costs - that is, the costs indirectly borne by society as a whole as a consequence of using that energy source.[8] These may include enabling costs, environmental impacts, usage lifespans, energy storage, recycling costs, or beyond-insurance accident effects.
The US Energy Information Administration predicts that coal and gas are set to be continually used to deliver the majority of the world's electricity,[9] this is expected to result in the evacuation of millions of homes in low lying areas, and an annual cost of hundreds of billions of dollars' worth of property damage.[10][11][12][13][14][15][16]
Furthermore, with a number of island nations becoming slowly submerged underwater due to rising sea levels,[17] massive international climate litigation lawsuits against fossil fuel users are currently beginning in the International Court of Justice.[18][19]
An EU funded research study known as ExternE, or Externalities of Energy, undertaken over the period of 1995 to 2005 found that the cost of producing electricity from coal or oil would double over its present value, and the cost of electricity production from gas would increase by 30% if external costs such as damage to the environment and to human health, from the particulate matter, nitrogen oxides, chromium VI, river water alkalinity, mercury poisoning and arsenic emissions produced by these sources, were taken into account. It was estimated in the study that these external, downstream, fossil fuel costs amount up to 1%-2% of the EU’s entire Gross Domestic Product (GDP), and this was before the external cost of global warming from these sources was even included.[20][21] Coal has the highest external cost in the EU, and global warming is the largest part of that cost.[8]
A means to address a part of the external costs of fossil fuel generation is carbon pricing — the method most favored by economics for reducing global-warming emissions. Carbon pricing charges those who emit carbon dioxide (CO2) for their emissions. That charge, called a 'carbon price', is the amount that must be paid for the right to emit one tonne of CO2 into the atmosphere.[22] Carbon pricing usually takes the form of a carbon tax or a requirement to purchase permits to emit (also called "allowances").
Depending on the assumptions of possible accidents and their probabilites external costs for nuclear power vary significantly and can reach between 0.2 to 200 ct/kWh.[23] Furthermore nuclear power is working under an insurance framework that limits or structures accident liabilities in accordance with the Paris convention on nuclear third-party liability, the Brussels supplementary convention, and the Vienna convention on civil liability for nuclear damage[24] and in the U.S. the Price-Anderson Act. It is often argued that this potential shortfall in liability represents an external cost not included in the cost of nuclear electricity; but the cost is small, amounting to about 0.1% of the levelized cost of electricity, according to a CBO study.[25]
These beyond-insurance costs for worst-case scenarios are not unique to nuclear power, as hydroelectric power plants are similarly not fully insured against a catastrophic event such as the Banqiao Dam disaster, where 11 million people lost their homes and from 30,000 to 200,000 people died, or large dam failures in general. As private insurers base dam insurance premiums on limited scenarios, major disaster insurance in this sector is likewise provided by the state.[26] Also of note is that more modern reactors than those of the Fukushima Daiichi Nuclear Power Plant vintage, such as the proven Onagawa nuclear plant design,[27] demonstrated that it can survive 13 meter high tsunamis and safely shut down without incident, despite being the closest nuclear plant to the epicenter of the 2011 earthquake and tsunami.[27]
Additional cost factors
Calculations often do not include wider system costs associated with each type of plant, such as long distance transmission connections to grids, or balancing and reserve costs. Calculations do not include externalities such as health damage by coal plants, nor the effect of CO2 emissions on the climate change, ocean acidification and eutrophication, ocean current shifts. Decommissioning costs of nuclear plants are usually not included (The USA is an exception, because the cost of decommissioning is included in the price of electricity, per the Nuclear Waste Policy Act), is therefore not full cost accounting. These types of items can be explicitly added as necessary depending on the purpose of the calculation. It has little relation to actual price of power, but assists policy makers and others to guide discussions and decision making.
These are not minor factors but very significantly affect all responsible power decisions:
- Comparisons of life-cycle greenhouse gas emissions show coal, for instance, to be radically higher in terms of GHGs than any alternative. Accordingly, in the analysis below, carbon captured coal is generally treated as a separate source rather than being averaged in with other coal.
- Other environmental concerns with electricity generation include acid rain, ocean acidification and effect of coal extraction on watersheds.
- Various human health concerns with electricity generation, including asthma and smog, now dominate decisions in developed nations that incur health care costs publicly. A Harvard University Medical School study estimates the US health costs of coal alone at between 300 and 500 billion US dollars annually.[28]
- While cost per kWh of transmission varies drastically with distance, the long complex projects required to clear or even upgrade transmission routes make even attractive new supplies often uncompetitive with conservation measures (see below), because the timing of payoff must take the transmission upgrade into account.
Estimates
Australia (2006)
The following table gives a selection of LCOE from two major government reports from Australia.[29][30] These figures do not include any cost for the greenhouse gas emissions (such as under carbon tax or emissions trading scenarios) associated with the different technologies.
| Technology | Cost |
|---|---|
| Nuclear (to COTS plan)[30] | 40–70 |
| Nuclear (to suit site; typical)[30] | 75–105 |
| Coal | 28–38 |
| Coal: IGCC + CCS | 53–98 |
| Coal: supercritical pulverized + CCS | 64–106 |
| Open-cycle Gas Turbine | 101 |
| Hot fractured rocks | 89 |
| Gas: combined cycle | 37–54 |
| Gas: combined cycle + CCS | 53–93 |
| Small Hydro power | 55 |
| Wind power: high capacity factor | 63 |
| Solar thermal | 85 |
| Biomass | 88 |
| Photovoltaics | 120 |
France (2011)
The International Agency for the Energy and EDF have estimated for 2011 the following costs. For the nuclear power they include the costs due to new safety investments to upgrade the French nuclear plant after the Fukushima Daiichi nuclear disaster; the cost for those investments is estimated at 4 €/MWh. Concerning the solar power the estimate at 293 €/MWh is for a large plant capable to produce in the range of 50-100 GWh/year located in a favorable location (such as in Southern Europe). For a small household plant capable to produce typically around 3 MWh/year the cost is according to the location between 400 and 700 €/MWh. Currently solar power is by far the most expensive renewable source to produce electricity, although increasing efficiency and longer lifespan of photovoltaic panels together with reduced production costs could make this source of energy more competitive.
| Technology | Cost (€/MWh) |
|---|---|
| Hydro power | 20 |
| Nuclear (with State-covered insurance costs) | 50 |
| Natural gas turbines without CO2 capture | 61 |
| Onshore wind | 69 |
| Solar farms | 293 |
Germany (2013)
In November 2013, the Fraunhofer Institute assessed the levelised generation costs for newly built power plants in the German electricity sector.[31] PV systems reached LCOE between 0.078 and 0.142 Euro/kWh in the third quarter of 2013, depending on the type of power plant (ground-mounted utility-scale or small rooftop solar PV) and average German insolation of 1000 to 1200 kWh/m² per year (GHI). There are no LCOE-figures available for electricity generated by recently built German nuclear power plants as none have been constructed since the late 1980s.
| Technology | Cost range (EUR/MWh) |
|---|---|
| Coal-fired power plants (brown coal) | 38–53 |
| Coal-fired power plant (hard coal) | 63–80 |
| CCGT power plants (cogeneration) | 75–98 |
| Onshore wind farms | 45–107 |
| Offshore wind power | 119–194 |
| PV systems | 78–142 |
| Biogas power plant | 135–250 |
| Source: Fraunhofer Institute- Levelized cost of electricity renewable energy technologies[31] | |
United Kingdom (2010)
In March 2010, a new report on UK levelised generation costs was published by Parsons Brinckerhoff.[32] It puts a range on each cost due to various uncertainties. Combined cycle gas turbines without CO2 capture are not directly comparable to the other low carbon emission generation technologies in the BP study. The assumptions used in this study are given in the report.
More recent UK estimates are the Mott MacDonald study released by DECC in June 2010 [33] and the Arup study for DECC published in 2011.[34]
| Technology | Cost range (£/MWh) |
|---|---|
| Natural gas turbine, no CO2 capture | 55 – 110 |
| Natural gas turbines with CO2 capture | 60 – 130 |
| Biomass | 60 – 120 |
| New nuclear | 80 – 105 (92.50 guaranteed from 2023[35][36]) |
| Onshore wind | 80 – 110 |
| Coal with CO2 capture | 100 – 155 |
| Solar farms | 125 – 180 |
| Offshore wind | 150 – 210 |
| Tidal power | 155 – 390 |
|
Divide the above figures by 1000 to obtain the price in pounds per kilowatt-hour. | |
United States
Energy Information Administration (2014)
The tables below list the estimated cost of electricity by source for plants entering service in 2018. The tables are from a January 2014 report of the Energy Information Administration (EIA) of the U.S. Department of Energy (DOE) called "Levelized Cost of New Generation Resources in the Annual Energy Outlook 2014".[37]
Total System Levelized Cost (the rightmost column) gives the dollar cost per megawatt-hour that must be charged over time in order to pay for the total cost. These calculations reflect an adjustment to account for the high level of carbon dioxide produced by coal plants. From the EIA report: —
- "a 3-percentage point increase in the cost of capital is added when evaluating investments in greenhouse gas (GHG) intensive technologies like coal-fired power and coal-to-liquids (CTL) plants without carbon control and sequestration (CCS). While the 3-percentage point adjustment is somewhat arbitrary, in levelized cost terms its impact is similar to that of a $15 per metric ton of carbon dioxide (CO2) emissions fee. ... As a result, the levelized capital costs of coal-fired plants without CCS are higher than would otherwise be expected."[38]
No tax credits or incentives are incorporated in the tables. From the EIA report: —
- Levelized cost ... represents the per-kilowatthour cost (in real dollars) of building and operating a generating plant over an assumed financial life and duty cycle. Key inputs to calculating levelized costs include overnight capital costs, fuel costs, fixed and variable operations and maintenance (O&M) costs, financing costs, and an assumed utilization rate for each plant type/. ... The availability of various incentives, including state or federal tax credits, can also impact the calculation of levelized cost. The values shown in the tables in this discussion do not incorporate any such incentives.[37]
All generating types are assumed to have the same 30-year cost recovery period, regardless of the expected lifetime of the plant. From the EIA report: —
- The levelized cost shown for each utility-scale generation technology in the tables in this discussion are calculated based on a 30-year cost recovery period, using a real after tax weighted average cost of capital (WACC) of 6.6 percent.[37]
Incentives, tax credits, production mandates, etc. are discussed in the overall comprehensive EIA report: "Annual Energy Outlook 2012".[39][40][41] Photovoltaics (solar PV) can be used both by distributed residential or commercial users and utility scale power plants. The costs shown are for utility scale photovoltaic power plants.[42]
| U.S. Average Levelized Cost for Plants Entering Service in 2019 (2012 USD/MWh) | ||||||
|---|---|---|---|---|---|---|
| Plant Type | Capacity Factor (%) |
Levelized Capital Cost |
Fixed O&M |
Variable O&M (including fuel) |
Transmission Investment |
Total System Levelized Cost |
| Conventional Coal | 85 | 60.0 | 4.2 | 30.3 | 1.2 | 95.6 |
| Integrated Coal-Gassification Combined Cycle (IGCC) | 85 | 76.1 | 6.9 | 31.7 | 1.2 | 115.9 |
| IGCC with CCS | 85 | 97.8 | 9.8 | 38.6 | 1.2 | 147.4 |
| Natural Gas Fired | ||||||
| NG: Conventional Combined Cycle | 87 | 14.3 | 1.7 | 49.1 | 1.2 | 66.3 |
| NG: Advanced Combined Cycle | 87 | 15.7 | 2.0 | 45.5 | 1.2 | 64.4 |
| NG: Advanced CC with CCS | 87 | 30.3 | 4.2 | 55.6 | 1.2 | 91.3 |
| NG: Conventional Combustion Turbine | 30 | 40.2 | 2.8 | 82.0 | 3.4 | 128.4 |
| NG: Advanced Combustion Turbine | 30 | 27.3 | 2.7 | 70.3 | 3.4 | 103.8 |
| Advanced Nuclear | 90 | 71.4 | 11.8 | 11.8 | 1.1 | 96.1 |
| Geothermal | 92 | 34.2 | 12.2 | 0.0 | 1.4 | 47.9 |
| Biomass | 83 | 47.4 | 14.5 | 39.5 | 1.2 | 102.6 |
| Wind1 | 35 | 64.1 | 13.0 | 0.0 | 3.2 | 80.3 |
| Wind - Offshore1 | 37 | 175.4 | 22.8 | 0.0 | 5.8 | 204.1 |
| Solar PV1,2 | 25 | 114.5 | 11.4 | 0.0 | 4.1 | 130.0 |
| Solar Thermal1 | 20 | 195.0 | 42.1 | 0.0 | 6.0 | 243.1 |
| Hydro1 | 53 | 72.0 | 4.1 | 6.4 | 2.0 | 84.5 |
|
1Non-dispatchable (Hydro is dispatchable within a season, but nondispatchable overall-limited by site and season) | ||||||
| Plant Type | Range for Total System Levelized Costs (2010 USD/MWh) | ||
|---|---|---|---|
| Minimum | Average | Maximum | |
| Conventional Coal | 87.0 | 95.6 | 114.4 |
| IGCC | 106.4 | 112.2 | 131.5 |
| IGCC with CCS | 137.3 | 147.4 | 163.3 |
| Natural Gas Fired | |||
| Conventional Combined Cycle | 61.1 | 66.3 | 75.8 |
| Advanced Combined Cycle | 59.6 | 64.4 | 73.6 |
| Advanced CC with CCS | 85.5 | 91.3 | 105.0 |
| Conventional Combustion Turbine | 106.0 | 128.4 | 149.4 |
| Advanced Combustion Turbine | 96.9 | 103.8 | 119.8 |
| Advanced Nuclear | 92.6 | 96.1 | 102.0 |
| Geothermal | 46.2 | 47.9 | 50.3 |
| Biomass | 92.3 | 102.6 | 122.9 |
| Wind | 71.3 | 80.3 | 90.3 |
| Wind-Offshore | 168.7 | 204.1 | 271.0 |
| Solar PV | 101.4 | 130.0 | 200.9 |
| Solar Thermal | 176.8 | 243.1 | 388.0 |
| Hydro[43] | 61.6 | 84.5 | 137.7 |
| |||
NREL OpenEI (2011)
OpenEI, sponsored jointly by the US DOE and the National Renewable Energy Laboratory (NREL), has compiled a historical cost-of-generation database[44] covering a wide variety of generation sources. Because the data is open source it may be subject to frequent revision.
| Plant Type | Levelized Cost of Energy (USD/MWh) |
Overnight Capital Cost (USD/W) |
Fixed Operating Cost (USD/kW) |
Variable Operating Cost (USD/MWh) |
Capacity Factor (%) | ||||||||||
|---|---|---|---|---|---|---|---|---|---|---|---|---|---|---|---|
| Max | Median | Min | Max | Median | Min | Max | Median | Min | Max | Median | Min | Max | Median | Min | |
| Wind, onshore | 120 | 60 | 20 | 2.60 | 1.57 | 1.13 | 60.00 | 10.95 | 10.95 | 23 | 6.45 | 5.02 | 50.4 | 38 | 18.4 |
| Wind, offshore | 200 | 100 | 70 | 8.00 | 3.05 | 2.16 | 180 | 14.28 | 14.28 | 40 | 21.18 | 13 | 54 | 43 | 27 |
| Solar PV1 | 590 | 280 | 150 | 9.50 | 5.10 | 2.50 | 110 | 32.03 | 6.44 | 0 | 0 | 0 | 28 | 21 | 15.48 |
| Solar CSP | 300 | 200 | 60 | 8.09 | 5.74 | 3.20 | 142 | 55.72 | 7.80 | 25.50 | .10 | .10 | 65 | 31.16 | 21.84 |
| Geothermal Hydrothermal | 140 | 60 | 40 | 5.94 | 2.82 | 1.63 | 229 | 155.41 | 68.33 | 0 | 0 | 0 | 95 | 85 | 75 |
| Blind Geothermal | 100 | 6.85 | 222.98 | 0 | 0 | 0 | 95 | ||||||||
| Enhanced Geothermal | 130 | 130 | 60 | 7.25 | 7.00 | 1.78 | 199.69 | 199.69 | 134.05 | 40 | 30 | 5 | 95 | 84.6 | 80 |
| Small Hydropower | 140 | 4.50 | 130 | 0 | 0 | 0 | 50 | ||||||||
| Hydropower | 120 | 20 | 20 | 4.00 | 1.32 | 0.50 | 75 | 13.14 | 12.72 | 5.94 | 3.20 | 2.42 | 93.2 | 93.2 | 35 |
| Ocean | 230 | 220 | 210 | 11.34 | 6.00 | 4.50 | 100 | 0 | 0 | 0 | 25.5 | ||||
| Biopower | 170 | 70 | 10 | 7.66 | 2.62 | 0.36 | 369.28 | 66.63 | 12.00 | 29.12 | 4.61 | .01 | 85 | 84.04 | 75 |
| Distributed Generation | 480 | 140 | 50 | 9.80 | 1.80 | 1.31 | 80 | 16.58 | 16.03 | 51 | 7.37 | 7.12 | 75 | ||
| Fuel Cell | 150 | 150 | 140 | 7.00 | 4.64 | 3.80 | 850 | 5.65 | 5.50 | 47.92 | 47.92 | 5.78 | 95 | ||
| Natural Gas Combined Cycle | 70 | 50 | 10 | 1.68 | 0.88 | 0.51 | 45.60 | 13.71 | 5.50 | 8.09 | 2.86 | 1.29 | 93 | 84.6 | 40 |
| Natural Gas Combustion Turbine | 110 | 70 | 60 | 8.09 | 5.74 | 3.20 | 14.52 | 10.53 | 5.26 | 29.90 | 3.57 | 2.67 | 92 | 80 | 10 |
| Coal, pulverized, scrubbed | 120 | 50 | 10 | 8.40 | 1.92 | 0.56 | 33.60 | 27.50 | 13.08 | 5.90 | 3.70 | 1.62 | 93 | 84.6 | 80 |
| Coal, pulverized, unscrubbed | 40 | 40 | 40 | 5.01 | 4.45 | 3.94 | 84.6 | ||||||||
| Coal, integrated gasification combined cycle | 180 | 80 | 60 | 11.00 | 3.17 | 2.22 | 130.03 | 38.67 | 25.00 | 11.12 | 7.25 | 1.15 | 80.96 | 80.96 | 75 |
| Nuclear | 120 | 60 | 40 | 8.20 | 3.10 | 2.28 | 127 | 85.66 | 12.80 | 6.00 | .49 | .42 | 90.24 | 90 | 85 |
Notes:
| |||||||||||||||
Nuclear Energy Agency (2012)
In November 2012, the OECD Nuclear Energy Agency published a report with the title System effects in low carbon energy systems.[46] In this report NEA looks at the interactions of dispatchable energy technologies (fossil and nuclear) and variable renewables (solar and wind) in terms of their effects on electricity systems. These grid-level systems costs differ from the levelized cost of electricity as they also include costs related to the electricity grid, such as extending and reinforcing transport and distribution grids, connecting new capacity to the grid, and the additional costs of providing back-up capacity for balancing the grid. NEA calculated these costs for a number of OECD countries with different levels of penetration for each energy source.[46] This report has been criticized for its adequacy and used methodology.[47][48] Swedish KTH in Stockholm published a report in response, finding "several question marks concerning the calculation methods".[49]:5 While the grid-level systems costs in the 2012 OECD-NEA report is calculated to be $17.70 per MWh for 10% onshore wind in Finland, the Swedish Royal Institute of Technology concludes in their analysis, that these costs are rather $0 to $3.70 per MWh (or 79% to 100% less than NEA's calculations), as they are either much smaller or already included in the market.[49]:23–24
| Technology | Nuclear | Coal | Gas | Onshore Wind | Offshore Wind | Solar | ||||||
|---|---|---|---|---|---|---|---|---|---|---|---|---|
| Penetration Level | 10% | 30% | 10% | 30% | 10% | 30% | 10% | 30% | 10% | 30% | 10% | 30% |
| Backup costs (adequacy) | 0.00 | 0.00 | 0.04 | 0.04 | 0.00 | 0.00 | 5.61 | 6.14 | 2.10 | 6.85 | 0.00 | 10.45 |
| Balancing costs | 0.16 | 0.10 | 0.00 | 0.00 | 0.00 | 0.00 | 2.00 | 5.00 | 2.00 | 5.00 | 2.00 | 5.00 |
| Grid connection | 1.56 | 1.56 | 1.03 | 1.03 | 0.51 | 0.51 | 6.50 | 6.50 | 15.24 | 15.24 | 10.05 | 10.05 |
| Grid reinforcement & extension | 0.00 | 0.00 | 0.00 | 0.00 | 0.00 | 0.00 | 2.20 | 2.20 | 1.18 | 1.18 | 2.77 | 2.77 |
| Total Grid-level System Costs | 1.72 | 1.67 | 1.07 | 1.07 | 0.51 | 0.51 | 16.30 | 19.84 | 20.51 | 28.26 | 14.82 | 28.27 |
California Energy Commission (2007)
A draft report of LECs used by the California Energy Commission is available.[50] From this report, the price per MWh for a municipal energy source is shown here:
| Technology | Cost (US$/MWh) |
|---|---|
| Advanced Nuclear | 67 |
| Coal | 74–88 |
| Gas | 87–346 |
| Geothermal | 67 |
| Hydro power | 48–86 |
| Wind power | 60 |
| Solar | 116–312 |
| Biomass | 47–117 |
| Fuel Cell | 86–111 |
| Wave Power | 611 |
| Note that the above figures incorporate tax breaks for the various forms of power plants. Subsidies range from 0% (for Coal) to 14% (for nuclear) to over 100% (for solar). | |
Other estimates
A 2010 study by the Japanese government (pre-Fukushima disaster), called the Energy White Paper, concluded the cost for kilowatt hour was ¥49 for solar, ¥10 to ¥14 for wind, and ¥5 or ¥6 for nuclear power. Masayoshi Son, an advocate for renewable energy, however, has pointed out that the government estimates for nuclear power did not include the costs for reprocessing the fuel or disaster insurance liability. Son estimated that if these costs were included, the cost of nuclear power was about the same as wind power.[51][52][53]
In 2014, Brookings Institute published The Net Benefits of Low and No-Carbon Electricity Technologies which states, after performing an energy and emissions cost analysis, that "The net benefits of new nuclear, hydro, and natural gas combined cycle plants far outweigh the net benefits of new wind or solar plants", with the most cost effective low carbon power technology being determined to be nuclear power.[54][55]
The Institution of Engineers and Shipbuilders in Scotland commissioned a former Director of Operations of the British National Grid, Colin Gibson, to produce a report on generation levelised costs that for the first time would include some of the transmission costs as well as the generation costs. This was published in December 2011 and is available on the internet :.[56] The institution seeks to encourage debate of the issue, and has taken the unusual step among compilers of such studies of publishing a spreadsheet showing its data available on the internet :[57]
On 27 February 2015 Vattenfall Vindkraft AS agreed to build the Horns Rev 3 offshore wind farm at a price of 10.31 Eurocent per kWh. This has been quoted as below 100 UK pounds per MWh.
Comparison different studies (2004–2009)
Several studies compared the levelized cost of nuclear and fossil power generation. These include studies from the Royal Academy of Engineering (UK 2004), University of Chicago (US 2004), Canadian Energy Research Institute (CAN 2004), the United Kingdom Department of Trade and Industry (UK 2006), the European Commission (BEL 2008), the House of the Lords, Select Committee on Economic Affairs (UK 2008) and MIT (US 2009).

Analysis from different sources (2009)

| █ Conventional oil | █ Unconventional oil | █ Biofuels | █ Coal | █ Nuclear | █ Wind |
| Colored vertical lines indicate various historical oil prices. From left to right: | |||||
| — 1990s average | — January 2009 | — 1979 peak | — 2008 peak | ||
Price of oil per barrel (bbl) at which energy sources are competitive.
- Right end of bar is viability without subsidy.
- Left end of bar requires regulation or government subsidies.
- Wider bars indicate uncertainty.
Longterm trends
Photovoltaics


Photovoltaic prices have fallen from $76.67 per watt in 1977 to an estimated $0.36 per watt in 2014, for crystalline silicon solar cells.[59][60] This is seen as evidence supporting Swanson's law, an observation similar to the famous Moore's Law, that states that solar cell prices fall 20% for every doubling of industry capacity.
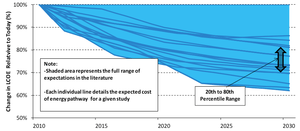
By 2011, the price of PV modules per MW had fallen by 60% since 2008, according to Bloomberg New Energy Finance estimates, putting solar power for the first time on a competitive footing with the retail price of electricity in some sunny countries; an alternative and consistent price decline figure of 75% from 2007 to 2012 has also been published,[61] though it is unclear whether these figures are specific to the United States or generally global. The levelised cost of electricity (LCOE) from PV is competitive with conventional electricity sources in an expanding list of geographic regions,[5] particularly when the time of generation is included, as electricity is worth more during the day than at night.[62] There has been fierce competition in the supply chain, and further improvements in the levelised cost of energy for solar lie ahead, posing a growing threat to the dominance of fossil fuel generation sources in the next few years.[63] As time progresses, renewable energy technologies generally get cheaper,[64][65] while fossil fuels generally get more expensive:
The less solar power costs, the more favorably it compares to conventional power, and the more attractive it becomes to utilities and energy users around the globe. Utility-scale solar power can now be delivered in California at prices well below $100/MWh ($0.10/kWh) less than most other peak generators, even those running on low-cost natural gas. Lower solar module costs also stimulate demand from consumer markets where the cost of solar compares very favorably to retail electric rates.[66]
It is now evident that, given a carbon price of $50/ton, which would raise the price of coal-fired power by 5c/kWh, solar PV, Wind, and Nuclear will be cost-competitive in most locations. The declining price of PV has been reflected in rapidly growing installations, totaling about 23 GW in 2011. Although some consolidation is likely in 2012, due to support cuts in the large markets of Germany and Italy, strong growth seems likely to continue for the rest of the decade. Already, by one estimate, total investment in renewables for 2011 exceeded investment in carbon-based electricity generation.[67]
In the case of self consumption, payback time is calculated based on how much electricity is not brought from the grid. Additionally, using PV solar power to charge DC batteries, as used in Plug-in Hybrid Electric Vehicles and Electric Vehicles, leads to greater efficiencies, but higher costs. Traditionally, DC generated electricity from solar PV must be converted to AC for buildings, at an average 10% loss during the conversion. Inverter technology is rapidly improving and current equipment have reached over 96% efficiency for small scale residential, while commercial scale three-phase equipment can reach well above 98% efficiency. However, an additional efficiency loss occurs in the transition back to DC for battery driven devices and vehicles, and using various interest rates and energy price changes were calculated to find present values that range from $2,057.13 to $8,213.64 (analysis from 2009).[68]
Wind power
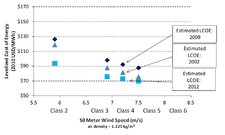
In 2004, wind energy cost a fifth of what it did in the 1980s, and some expected that downward trend to continue as larger multi-megawatt turbines were mass-produced.[70] As of 2012 capital costs for wind turbines are substantially lower than 2008–2010 but are still above 2002 levels.[71] A 2011 report from the American Wind Energy Association stated, "Wind's costs have dropped over the past two years, in the range of 5 to 6 cents per kilowatt-hour recently.... about 2 cents cheaper than coal-fired electricity, and more projects were financed through debt arrangements than tax equity structures last year.... winning more mainstream acceptance from Wall Street's banks.... Equipment makers can also deliver products in the same year that they are ordered instead of waiting up to three years as was the case in previous cycles.... 5,600 MW of new installed capacity is under construction in the United States, more than double the number at this point in 2010. Thirty-five percent of all new power generation built in the United States since 2005 has come from wind, more than new gas and coal plants combined, as power providers are increasingly enticed to wind as a convenient hedge against unpredictable commodity price moves."[72]
This cost has additionally reduced as wind turbine technology has improved. There are now longer and lighter wind turbine blades, improvements in turbine performance and increased power generation efficiency. Also, wind project capital and maintenance costs have continued to decline.[73] For example, the wind industry in the USA is now able to produce more power at lower cost by using taller wind turbines with longer blades, capturing the faster winds at higher elevations. This has opened up new opportunities and in Indiana, Michigan, and Ohio. The price of power from wind turbines built 300 feet to 400 feet above the ground can now compete with conventional fossil fuels like coal. Prices have fallen to about 4 cents per kilowatt-hour in some cases and utilities have been increasing the amount of wind energy in their portfolio, saying it is their cheapest option.[74]
See also
- Electricity pricing
- Comparisons of life-cycle greenhouse gas emissions
- Distributed generation
- Economics of new nuclear power plants
- Demand response
- Intermittent energy source
- National Grid Reserve Service
- Nuclear power in France
- List of thermal power station failures
- Calculating the cost of the UK Transmission network: cost per kWh of transmission
- List of countries by electricity production from renewable sources
- List of U.S. states by electricity production from renewable sources
- Environmental concerns with electricity generation
- Grid parity
Further reading
- Nuclear Power: Still Not Viable without Subsidies. February 2011. By Doug Koplow. Union of Concerned Scientists.
- Levelized Cost of New Electricity Generating Technologies. Institute for Energy Research.
- Economic Value of U.S. Fossil Fuel Electricity Health Impacts. United States Environmental Protection Agency.
- The Hidden Costs of Electricity: Comparing the Hidden Costs of Power Generation Fuels. Civil Society Institute.
References
- ↑ A Review of Electricity Unit Cost Estimates Working Paper, December 2006 - Updated May 2007
- ↑ "Cost of wind, nuclear and gas powered generation in the UK". Claverton-energy.com. Retrieved 2012-09-04.
- ↑ "David Millborrows paper on wind costs". Claverton-energy.com. Retrieved 2012-09-04.
- ↑ Nuclear Energy Agency/International Energy Agency/Organization for Economic Cooperation and Development Projected Costs of Generating Electricity (2005 Update)
- ↑ 5.0 5.1 5.2 5.3 5.4 K. Branker, M. J.M. Pathak, J. M. Pearce, “A Review of Solar Photovoltaic Levelized Cost of Electricity”, Renewable and Sustainable Energy Reviews 15, pp.4470-4482 (2011). Open access
- ↑ Comparing the Costs of Intermittent and Dispatchable Electricity-Generating Technologies", by Paul Joskow, Massachusetts Institute of Technology, September 2011
- ↑ US Energy Information Administration, Levelized cost of new generation resources, 28 January 2013.
- ↑ 8.0 8.1 "Subsidies and costs of EU energy. Project number: DESNL14583" Pages: 52. EcoFys, 10 October 2014. Accessed: 20 October 2014. Size: 70 pages in 2MB.
- ↑ International Energy Outlook: Electricity "Although coal-fired generation increases by an annual average of only 1.9 percent, it remains the largest source of electricity generation through 2035. In 2008, coal-fired generation accounted for 40 percent of world electricity supply; in 2035, its share decreases to 37 percent, as renewables, natural gas, and nuclear power all are expected to advance strongly during the projection and displace the need for coal-fired-generation in many parts of the world. World net coal-fired generation grows by 67 percent, from 7.7 trillion kilowatthours in 2008 to 12.9 trillion kilowatthours in 2035."
- ↑ The economic impact of global warming
- ↑ Climate change threatens Australia's coastal lifestyle, report warns | Environment | The Guardian
- ↑ Tufts Civil Engineer Predicts Boston’s Rising Sea Levels Could Cause Billions Of Dollars In Damage
- ↑ Rising Sea Levels' cost on Boston
- ↑ Tufts University slide 28, note projected Bangladesh evacuation
- ↑ The Hidden costs of Fossil fuels
- ↑ Rising Sea Level
- ↑ Five nations under threat from climate change
- ↑ Tiny Pacific nation takes on Australia
- ↑ See you in court: the rising tide of international climate litigation
- ↑ New research reveals the real costs of electricity in Europe
- ↑ ExternE-Pol, External costs of current and advanced electricity systems, associated with emissions from the operation of power plants and with the rest of the energy chain, final technical report. See figure 9, 9b and figure 11
- ↑ IPCC, Glossary A-D: "Climate price", in IPCC AR4 SYR 2007.
- ↑ Viktor Wesselak, Thomas Schabbach, Thomas Link, Joachim Fischer: Regenerative Energietechnik. Springer 2013, ISBN 978-3-642-24165-9, p. 27.
- ↑ Publications: Vienna Convention on Civil Liability for Nuclear Damage. International Atomic Energy Agency.
- ↑ Nuclear Power's Role in Generating Electricity Congressional Budget Office, May 2008.
- ↑ Availability of Dam Insurance 1999
- ↑ 27.0 27.1 "Japanese nuclear plant survived tsunami, offers clues". Reuters. 20 October 2011.
- ↑ "New Harvard Study Examines Cost of Coal". Environment.harvard.edu. Retrieved 2012-09-04.
- ↑ Graham, P. The heat is on: the future of energy in Australia CSIRO, 2006
- ↑ 30.0 30.1 30.2 Switkowski, Z. Uranium Mining, Processing and Nuclear Energy Review UMPNER taskforce, Australian Government, 2006
- ↑ 31.0 31.1 "Levelized cost of electricity renewable energy technologies" (PDF). FRAUNHOFER. 2013. Retrieved 6 May 2014.
- ↑ "Powering the Nation". Parsons Brinckerhoff. 2010. Retrieved 16 February 2012.
- ↑ "Mott MacDonald study released by DECC in June 2010" (PDF). Retrieved 2012-09-04.
- ↑ Ove Arup & Partners Ltd (October 2011). "Review of the generation costs and deployment potential of renewable electricity technologies in the UK" (PDF). London: Department of Energy and Climate Change. Retrieved 16 February 2012.
- ↑ "UK nuclear power plant gets go-ahead". BBC News. 21 October 2013.
- ↑ Roland Gribben and Denise Roland (21 October 2013). "Hinkley Point nuclear power plant to create 25,000 jobs, says Cameron". London: Daily Telegraph.
- ↑ 37.0 37.1 37.2 Levelized Cost of New Generation Resources in the Annual Energy Outlook 2014. Released April, 2014. Report of the US Energy Information Administration (EIA) of the U.S. Department of Energy (DOE).
- ↑ 38.0 38.1 Levelized Cost of New Generation Resources in the Annual Energy Outlook 2013. Released January, 2013. Report of the US Energy Information Administration (EIA) of the U.S. Department of Energy (DOE).
- ↑ 39.0 39.1 Energy Information Administration, Annual Energy Outlook 2012. June 2012, DOE/EIA-0383(2012).
- ↑ Assumptions to the Annual Energy Outlook 2011. U.S. Energy Information Administration of the U.S. Department of Energy.
- ↑ Appendix A: Handling of Federal and Selected State Legislation and Regulation in the Annual Energy Outlook. US Energy Information Administration of the U.S. Department of Energy.
- ↑ Levelized Cost of New Generation Resources in the Annual Energy Outlook 2011. Released January 23, 2012. Report of the US Energy Information Administration (EIA) of the U.S. Department of Energy (DOE).
- ↑ http://www.eia.gov/forecasts/aeo/electricity_generation.cfm
- ↑ OpenEI Transparent Cost Database. Accessed 09/02/2013.
- ↑ "Lazard's Levelized Cost of Energy Analysis — Version 8.0" (PDF). http://www.lazard.com/''. LAZARD. September 2014. Retrieved 14 March 2015.
- ↑ 46.0 46.1 46.2 "System effects in low carbon energy systems" (PDF). OECD, NEA. 2012-11-29. Retrieved 2013-04-04.
- ↑ environmentalresearchweb.org - Nuclear and renewables: back-up and grid costs
- ↑ VTT Technical Research Centre of Finland - Note for wind energy grid level system costs published by NEA 2012 report
- ↑ 49.0 49.1 Lennart Söder (2012-12-20). "Nuclear Energy and Renewables: System Effects in Low‐carbon Electricity Systems – Method comments to a NEA report" (PDF). Swedish Royal Institute of Technology. Retrieved 13 March 2015.
- ↑ "Comparative Costs of California Central Station Electricity Generation Technologies" (PDF). Retrieved 2012-09-04.
- ↑ Johnston, Eric, "Son's quest for sun, wind has nuclear interests wary", Japan Times, 12 July 2011, p. 3.
- ↑ Bird, Winifred, "Powering Japan's future", Japan Times, 24 July 2011, p. 7.
- ↑ Johnston, Eric, "Current nuclear debate to set nation's course for decades", Japan Times, 23 September 2011, p. 1.
- ↑ Economist magazine article "Sun, wind and drain Wind and solar power are even more expensive than is commonly thought Jul 26th 2014"
- ↑ http://www.brookings.edu/~/media/research/files/papers/2014/05/19%20low%20carbon%20future%20wind%20solar%20power%20frank/net%20benefits%20final.pdf THE NET BENEFITS OF LOW AND NO-CARBON ELECTRICITY TECHNOLOGIES. MAY 2014, Charles Frank PDF
- ↑ "Institution of Engineers and Shipbuilders in Scotland report" (PDF). Retrieved 2012-09-04.
- ↑ "Institution of Engineers and Shipbuilders in Scotland data". Iesisenergy.org. Retrieved 2012-09-04.
- ↑ "Solar Photovoltaics Competing in the Energy Sector—On the road to competitiveness" (PDF). European Photovoltaic Industry Association. September 2011. p. 18. Retrieved March 2015.
- ↑ "Price Quotes". http://pv.energytrend.com/''. Archived from the original on 26 June 2014. Retrieved 26 June 2014.
- ↑ "Sunny Uplands: Alternative energy will no longer be alternative". The Economist. 21 November 2012. Retrieved 2012-12-28.
- ↑ Ken Wells (October 25, 2012), "Solar Energy Is Ready. The U.S. Isn't", Bloomberg Businessweek, businessweek.com, retrieved November 1, 2012
- ↑ Utilities’ Honest Assessment of Solar in the Electricity Supply
- ↑ "Renewables Investment Breaks Records". Renewable Energy World. 29 August 2011.
- ↑ Renewable energy costs drop in '09 Reuters, November 23, 2009.
- ↑ Solar Power 50% Cheaper By Year End – Analysis Reuters, November 24, 2009.
- ↑ Arno Harris (31 August 2011). "A Silver Lining in Declining Solar Prices". Renewable Energy World.
- ↑ John Quiggin (January 3, 2012). "The End of the Nuclear Renaissance |". National Interest.
- ↑ Converting Solar Energy into the PHEV Battery "VerdeL3C.com", May 2009
- ↑ Lantz, E.; Hand, M. and Wiser, R. (13–17 May 2012) "The Past and Future Cost of Wind Energy," National Renewable Energy Laboratory conference paper no. 6A20-54526, p. 4
- ↑ Helming, Troy (2004) "Uncle Sam's New Year's Resolution" ArizonaEnergy.org
- ↑ "LBNL/NREL Analysis Predicts Record Low LCOE for Wind Energy in 2012–2013". US Department of Energy Wind Program Newsletter. 24 February 2012. Retrieved 10 March 2012.
- ↑ Salerno, E., AWEA Director of Industry and Data Analysis, as quoted in Shahan, Z. (2011) Cost of Wind Power – Kicks Coal's Butt, Better than Natural Gas (& Could Power Your EV for $0.70/gallon)" CleanTechnica.com
- ↑ Danielson, David (14 August 2012). "A Banner Year for the U.S. Wind Industry". Whitehouse Blog.
- ↑ Diane Cardwell (20 March 2014). "Wind Industry’s New Technologies Are Helping It Compete on Price". New York Times.
| |||||||||||||||||||||||||
