Cook's distance
In statistics, Cook's distance or Cook's D is a commonly used estimate of the influence of a data point when performing least squares regression analysis.[1] In a practical ordinary least squares analysis, Cook's distance can be used in several ways: to indicate data points that are particularly worth checking for validity; to indicate regions of the design space where it would be good to be able to obtain more data points. It is named after the American statistician R. Dennis Cook, who introduced the concept in 1977.
Definition
Cook's distance measures the effect of deleting a given observation. Data points with large residuals (outliers) and/or high leverage may distort the outcome and accuracy of a regression. Points with a large Cook's distance are considered to merit closer examination in the analysis. It is calculated as:
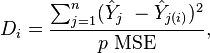
where:
 is the prediction from the full regression model for observation j;
 is the prediction for observation j from a refitted regression model in which observation i has been omitted;
 is the number of fitted parameters in the model;
 is the mean square error of the regression model.
The following are the algebraically equivalent expressions (in case of simple linear regression):
![D_i = \frac{e_i^2}{p \ \mathrm{MSE}}\left[\frac{h_{ii}}{(1-h_{ii})^2}\right],](../I/m/bcb0a29582880fa53973a9d51c090286.png)
where:
 is the leverage, i.e., the i-th diagonal element of the hat matrix
 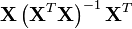 ;
; is the residual (i.e., the difference between the observed value and the value fitted by the proposed model).
Detecting highly influential observations
There are different opinions regarding what cut-off values to use for spotting highly influential points. A simple operational guideline of  has been suggested.[2] Others have indicated that
  , where
  is the number of observations, might be used.[3]
A conservative approach relies on the fact that Cook's distance has the form W/p, where W is formally identical to the Wald statistic that one uses for testing that  using some
 ![\hat{\beta}_{[-i]}](../I/m/7cb48b2b662ad97813c6e54661e3766b.png) . Recalling that W/p has an
. Recalling that W/p has an  distribution (with p and n-p degrees of freedom), we see that Cook's distance is equivalent to the F statistic for testing this hypothesis, and we can thus use
  as a threshold.
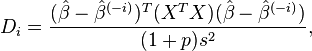
Interpretation
Specifically  can be interpreted as the distance one's estimates move within the confidence ellipsoid that represents a region of plausible values for the parameters. This is shown by an alternative but equivalent representation of Cook's distance in terms of changes to the estimates of the regression parameters between the cases where the particular observation is either included or excluded from the regression analysis.
See also
References
- ↑ Mendenhall, William; Sincich, Terry (1996). A Second Course in Statistics: Regression Analysis (5th ed.). Upper Saddle River, NJ: Prentice-Hall. p. 422. ISBN 0-13-396821-9.
A measure of overall influence an outlying observation has on the estimated
 coefficients was proposed by R. D. Cook (1979). Cook's distance, Di, is calculated...
 - ↑ Cook, R. Dennis; and Weisberg, Sanford (1982); Residuals and influence in regression, New York, NY: Chapman & Hall
- ↑ Bollen, Kenneth A.; and Jackman, Robert W. (1990); Regression diagnostics: An expository treatment of outliers and influential cases, in Fox, John; and Long, J. Scott (eds.); Modern Methods of Data Analysis (pp. 257-91). Newbury Park, CA: Sage
- Cook, R. Dennis (February 1977). "Detection of Influential Observations in Linear Regression". Technometrics (American Statistical Association) 19 (1): 15–18. doi:10.2307/1268249. JSTOR 1268249. MR 0436478.
- Cook, R. Dennis (March 1979). "Influential Observations in Linear Regression". Journal of the American Statistical Association (American Statistical Association) 74 (365): 169–174. doi:10.2307/2286747. JSTOR 2286747. MR 0529533.
- Lorenz, Frederick O. (April 1987). "Teaching about Influence in Simple Regression". Teaching Sociology (American Sociological Association) 15 (2): 173–177. doi:10.2307/1318032. JSTOR 1318032.
- Chatterjee, Samprit; Hadi, Ali S. (2006). Regression analysis by example (4th ed.). John Wiley and Sons. ISBN 0-471-74696-7.