Colchester Borough Council election, 2004
The 2004 Colchester Borough Council election took place on 10 June 2004 to elect members of Colchester Borough Council in Essex, England. This was the same day as the other 2004 United Kingdom local elections and as the 2004 European Parliament Elections. One third of the seats were up for election and the council stayed under no overall control.[1]
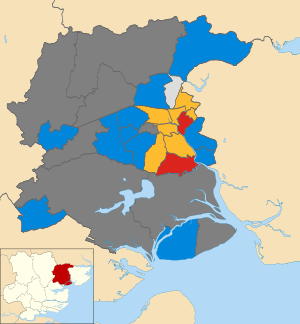
After the election, the composition of the council was
Election result
The Conservatives gained 4 seats to become the largest party on the council with 28 seats, 3 short of a majority.[2][3] They overtook the Liberal Democrats who held 23 seats, Labour with 6 seats and 3 independents.[2] Overall turnout at the election was 34.4%.[4]
As a result the Conservatives took all the seats on the council cabinet for the first time since that style of government was introduced in Colchester, with the Conservative group leader John Jowers becoming the new leader of the council.[3]
| Colchester Borough Council Election, 2004[1][5] |
| Party |
Seats |
Gains |
Losses |
Net gain/loss |
Seats % |
Votes % |
Votes |
+/− |
| |
Conservative |
11 |
4 |
0 |
+4 |
55 |
40.9 |
13,908 |
+0.3% |
| |
Liberal Democrat |
6 |
0 |
2 |
-2 |
30 |
34.2 |
11,619 |
+2.2% |
| |
Labour |
2 |
1 |
0 |
+1 |
10 |
18.2 |
6,197 |
-1.8% |
| |
Independent |
1 |
0 |
3 |
-4 |
5 |
6.7 |
2,266 |
+1.0% |
Ward results
| Berechurch[5][4] |
| Party |
Candidate |
Votes |
% |
±% |
|
Liberal Democrat |
Craig S Sutton |
757 |
45.7 |
-6.4 |
|
Labour |
David F Harris |
504 |
30.5 |
+2.3 |
|
Conservative |
Pauline S Hazell |
394 |
23.8 |
+4.7 |
| Majority |
253 |
15.3 |
-8.6 |
| Turnout |
1655 |
28.8 |
+4.3 |
|
Liberal Democrat hold |
Swing |
|
|
| Castle Ward[5][4] |
| Party |
Candidate |
Votes |
% |
±% |
|
Liberal Democrat |
William H F Spyvee |
1,185 |
57.9 |
+3.5 |
|
Conservative |
Pauline R Lucas |
566 |
27.7 |
+3.4 |
|
Labour |
Malcolm P Cannon |
296 |
14.5 |
+1.8 |
| Majority |
619 |
30.2 |
+0.1 |
| Turnout |
2,047 |
35.4 |
+6.8 |
|
Liberal Democrat hold |
Swing |
|
|
| East Donyland Ward[5][4] |
| Party |
Candidate |
Votes |
% |
±% |
|
Labour |
Andrew M Raison |
428 |
43.9 |
+0.7 |
|
Conservative |
Patricia A Sanderson |
296 |
30.3 |
-6.9 |
|
Independent |
Peter L Byham |
159 |
16.3 |
+16.3 |
|
Liberal Democrat |
Barry R Woodward |
93 |
9.5 |
-10.1 |
| Majority |
132 |
13.5 |
+7.5 |
| Turnout |
976 |
48.9 |
+12.9[lower-alpha 1] |
|
Labour hold |
Swing |
|
|
| Highwoods Ward[5][4] |
| Party |
Candidate |
Votes |
% |
±% |
|
Independent |
Beverley A Oxford[lower-alpha 2] |
807 |
42.5 |
+16.2 |
|
Liberal Democrat |
Paul L Booker |
507 |
26.7 |
-4.9 |
|
Conservative |
Shahid N Husain |
423 |
22.3 |
-10.0 |
|
Labour |
Hugh L Thomas |
163 |
8.6 |
-0.8 |
| Majority |
300 |
15.8 |
|
| Turnout |
1,900 |
30.3 |
+8.3 |
|
Independent hold |
Swing |
|
|
| New Town Ward[5][4] |
| Party |
Candidate |
Votes |
% |
±% |
|
Liberal Democrat |
Peter M Higgins |
972 |
55.3 |
+0.3 |
|
Conservative |
Glenn Bath |
483 |
27.5 |
+4.2 |
|
Labour |
David A Hough |
302 |
17.2 |
-2.9 |
| Majority |
489 |
27.8 |
-3.9 |
| Turnout |
1,757 |
28.2 |
+5.3 |
|
Liberal Democrat hold |
Swing |
|
|
| Prettygate Ward[5][4] |
| Party |
Candidate |
Votes |
% |
±% |
|
Conservative |
Ron Levy |
1,304 |
49.0 |
+5.7 |
|
Liberal Democrat |
John Gray |
1,151 |
43.2 |
-5.1 |
|
Labour |
Luke M P Dopson |
208 |
7.8 |
-0.6 |
| Majority |
153 |
5.7 |
|
| Turnout |
2,663 |
44.8 |
+8.6 |
|
Conservative gain from Liberal Democrat |
Swing |
|
|
| St Andrew's Ward[5][4][2] |
| Party |
Candidate |
Votes |
% |
±% |
|
Labour |
Tina J Dopson |
823 |
52.8 |
-9.1 |
|
Liberal Democrat |
Ralph B Johnston |
378 |
24.3 |
+3.6 |
|
Conservative |
Anne Allan |
357 |
22.9 |
+8.9 |
| Majority |
445 |
28.6 |
-12.8 |
| Turnout |
1,558 |
22.3 |
+2.6 |
|
Labour gain from Independent |
Swing |
|
|
| St Annes's Ward[5][4] |
| Party |
Candidate |
Votes |
% |
±% |
|
Liberal Democrat |
Gaik-Choon (A.K.A. Helen) Chuah |
998 |
54.7 |
-3.6 |
|
Conservative |
Angus J C Allan |
464 |
25.5 |
+6.1 |
|
Labour |
Robert A A Fisher |
361 |
19.8 |
-0.4 |
| Majority |
534 |
29.3 |
-8.9 |
| Turnout |
1,823 |
28.3 |
+5.6 |
|
Liberal Democrat hold |
Swing |
|
|
| Stanway Ward[5][4] |
| Party |
Candidate |
Votes |
% |
±% |
|
Conservative |
Andrew J Ellis |
1,027 |
47.7 |
+12.9 |
|
Liberal Democrat |
Gwendoline I R Ilott |
839 |
39.0 |
-13.3 |
|
Labour |
John Spademan |
285 |
13.2 |
+0.5 |
| Majority |
188 |
8.7 |
-8.9 |
| Turnout |
2,151 |
35.3 |
+6.5 |
|
Conservative gain from Liberal Democrat |
Swing |
|
|
| Tiptree Ward[5][4] |
| Party |
Candidate |
Votes |
% |
±% |
|
Conservative |
Richard (aka Dick) Martin |
925 |
41.0 |
+6.0 |
|
Independent |
John F Elliott |
741 |
32.8 |
-1.9 |
|
Labour |
Alan C L Mogridge |
590 |
26.2 |
-0.4 |
| Majority |
184 |
8.2 |
+7.9 |
| Turnout |
2,256 |
37.9 |
+11.5 |
|
Conservative gain from Independent |
Swing |
|
|
| West Mersea Ward[5][4] |
| Party |
Candidate |
Votes |
% |
±% |
|
Conservative |
John G Bouckley |
1,581 |
71.0 |
+8.0 |
|
Labour |
Audrey M Spencer |
329 |
14.8 |
-5.6 |
|
Liberal Democrat |
Ronald Charles Laurance Baker |
316 |
14.2 |
+0.0 |
| Majority |
1,252 |
56.2 |
+13.6 |
| Turnout |
2,226 |
38.6 |
+8.5 |
|
Conservative hold |
Swing |
|
|
| Wivenhoe Quay Ward[5][4] |
| Party |
Candidate |
Votes |
% |
±% |
|
Conservative |
Ann L Quarry |
629 |
36.6 |
+7.9 |
|
Independent |
Robert Newman |
476 |
27.7 |
-7.9 |
|
Labour |
Thomas N Prosser |
322 |
18.7 |
-5.8 |
|
Liberal Democrat |
Jeremy J Jacobs |
293 |
17.0 |
+17.0 |
| Majority |
153 |
8.9 |
+2.0 |
| Turnout |
1,720 |
43.7 |
+8.1 |
|
Conservative gain from Independent |
Swing |
|
|
- ↑ 1.0 1.1 1.2 1.3 1.4 1.5 Change in turnout since 2002
- ↑ The Independent candidate in Highwoods ward was elected as a Liberal Democrat in 2002. Her vote share is comparable with the Independent who stood for the ward in 2003, as both had defected from Liberal Democrat to Independent since being elected.
By-elections between 2004 and 2006
A by-election took place on 21 October 2004 in Berechurch after the resignation of Liberal Democrat councillor Susan Brooks.[6] Labour's David Harris took the seat from the Liberal Democrats by a majority of 345.[6]
| Berechurch By-Election 21 October 2004[7][8] |
| Party |
Candidate |
Votes |
% |
±% |
|
Labour |
Dave Harris |
838 |
51.5 |
+21.0 |
|
Liberal Democrat |
Martin Verran |
493 |
30.3 |
-15.4 |
|
Conservative |
Andrew Bright |
296 |
18.2 |
-5.6 |
| Majority |
345 |
21.2 |
|
| Turnout |
1,627 |
30.0 |
|
|
Labour gain from Liberal Democrat |
Swing |
|
|
References