Closing milestones of the Nasdaq Composite
This article is a summary of the closing milestones of the Nasdaq Composite, a United States stock market index. Since first opening at 100.00 on February 5, 1971, the Nasdaq Composite has increased, despite several periods of decline, most recently after the dot-com bubble on March 10, 2000.
Milestone highs and lows
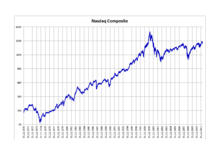
Nasdaq Composite 1970–2012
Incremental closing milestones
The following is a list of the milestone closing levels of the Nasdaq Composite. (10-point increments are used up to the 200-point level; 20 to 500; 50 to 1,000; 100 to 2,000; 200 to 5,000; and 500-point increments thereafter.)
| Milestone | Closing Level | Date first achieved |
|---|---|---|
| The early 1970s bull market (1971-1973) | ||
| 100 | 100.00 | February 5, 1971 |
| 110 | 110.16 | April 19, 1971 |
| 120 | 120.47 | February 2, 1972 |
| 130 | 130.00 | April 5, 1972 |
| The 1980s bull market (1978–1987) | ||
| 136.841 | 137.09 | September 7, 1978 |
| 140 | 140.02 | July 27, 1979 |
| 150 | 150.04 | August 29, 1979 |
| 160 | 160.70 | January 28, 1980 |
| 170 | 170.48 | July 21, 1980 |
| 180 | 181.70 | August 22, 1980 |
| 190 | 191.31 | September 16, 1980 |
| 200 | 200.25 | November 13, 1980 |
| 220 | 220.24 | May 26, 1981 |
| 240 | 240.65 | December 7, 1982 |
| 260 | 261.29 | February 18, 1983 |
| 280 | 281.60 | April 15, 1983 |
| 300 | 301.64 | May 6, 1983 |
| 320 | 320.04 | June 14, 1983 |
| 340 | 340.80 | February 6, 1986 |
| 360 | 362.00 | March 4, 1986 |
| 380 | 380.80 | April 14, 1986 |
| 400 | 400.20 | May 30, 1986 |
| 420 | 421.00 | February 25, 1987 |
| 440 | 440.80 | August 6, 1987 |
| The 1990s bull acceleration (1989–2000) | ||
| 455.802 | 456.90 | August 3, 1989 |
| 460 | 461.70 | August 7, 1989 |
| 480 | 480.70 | October 5, 1989 |
| 500 | 501.62 | April 12, 1991 |
| 550 | 550.71 | November 11, 1991 |
| 600 | 602.29 | January 7, 1992 |
| 650 | 652.73 | November 30, 1992 |
| 700 | 700.77 | January 21, 1993 |
| 750 | 752.26 | September 23, 1993 |
| 800 | 800.47 | January 31, 1994 |
| 850 | 850.26 | May 3, 1995 |
| 900 | 902.68 | June 15, 1995 |
| 950 | 952.93 | July 6, 1995 |
| 1,000 | 1,005.89 | July 17, 1995 |
| 1,100 | 1,117.11 | February 22, 1996 |
| 1,200 | 1,202.76 | May 10, 1996 |
| 1,300 | 1,300.37 | December 3, 1996 |
| 1,400 | 1,409.21 | May 27, 1997 |
| 1,500 | 1,502.62 | July 11, 1997 |
| 1,600 | 1,605.45 | August 4, 1997 |
| 1,700 | 1,702.41 | October 2, 1997 |
| 1,800 | 1,812.44 | March 24, 1998 |
| 1,900 | 1,903.87 | April 21, 1998 |
| 2,000 | 2,000.56 | July 16, 1998 |
| 2,200 | 2,208.05 | January 4, 1999 |
| 2,400 | 2,408.17 | January 19, 1999 |
| 2,600 | 2,652.05 | April 26, 1999 |
| 2,800 | 2,818.13 | July 14, 1999 |
| 3,000 | 3,028.51 | November 3, 1999 |
| 3,200 | 3,221.15 | November 12, 1999 |
| 3,400 | 3,420.50 | November 24, 1999 |
| 3,600 | 3,620.24 | December 10, 1999 |
| 3,800 | 3,911.15 | December 21, 1999 |
| 4,000 | 4,041.46 | December 29, 1999 |
| 4,200 | 4,235.40 | January 21, 2000 |
| 4,400 | 4,427.50 | February 8, 2000 |
| 4,600 | 4,617.65 | February 24, 2000 |
| 4,800 | 4,914.79 | March 3, 2000 |
| 5,000 | 5,046.86 | March 9, 2000 |
| The 2010s bull market (2015–Present) | ||
| 5,048.623 | 5,056.06 | April 23, 2015 |
1This was the Nasdaq's close at the peak on January 11, 1973.
2This was the Nasdaq's close at the peak on August 27, 1987.
3This was the Nasdaq's close at the peak on March 10, 2000.
Record highs
| Closing: | 5,092.08 | Friday, April 24, 2015 |
| Intra-day Actual: | 5,132.52 | Friday, March 10, 2000 |
See also
- Closing milestones of the Dow Jones Industrial Average
- List of largest daily changes in the Nasdaq Composite
- Milestones of the S&P 500 Index
- Market trend
- Stock market bubble
- Stock market crash