Climate of the Philippines

Climate of the Philippines is either tropical rainforest, tropical savanna tropical monsoon, or humid subtropical (in higher-altitude areas) characterized by relatively high temperature, oppressive humidity and plenty of rainfall. There are two seasons in the country, the wet season and the dry season, based upon the amount of rainfall.[1] This is dependent as well on your location in the country as some areas experience rain all throughout the year (see Climate Types). Based on temperature, the seven warmest months of the year are from March to October; the winter monsoon brings cooler air from November to February. May is the warmest month, and January, the coolest.[2]
Weather in the Philippines is monitored and managed by the Philippine Atmospheric, Geophysical and Astronomical Services Administration (known locally by its acronym, PAGASA).
Rainfall
The summer monsoon brings heavy rains to most of the archipelago from May to October. Annual average rast known tropical cyclone to impact the archipelago was the July 1911 cyclone, which dropped over 1,168 millimetres (46.0 in) of rainfall within a 24-hour period in Baguio City.[3]
Typhoons
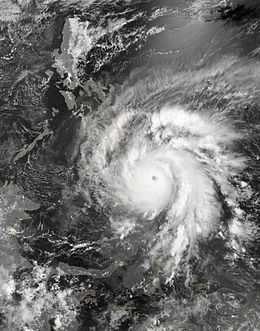
The Philippines sit astride the typhoon belt, and the country suffers an annual onslaught of dangerous storms from July through October. These are especially hazardous for northern and eastern Luzon and the Bicol and Eastern Visayas regions, but Manila gets devastated periodically as well. Bagyó is the local term to any tropical cyclone in the Philippine Islands.[3] From the statistics gathered by PAGASA from 1948 to 2004, around an average of 20 storms and/or typhoons per year enter the PAR (Philippine Area of Responsibility) - the designated area assigned to PAGASA to monitor during weather disturbances. Those that made landfall or crossed the Philippines, the average was nine per year. In 1993, a record 19 typhoons made landfall in the country making it the most in one year. The least amount per year were 4 during the years 1955, 1958, 1992 and 1997.[4]
PAGASA categorises typhoons into four types according to wind speed. Once a tropical cyclone enters the Philippine Area of Responsibility, regardless of strength, PAGASA gives it a local name for identification purposes by the media, government, and the general public.[5]
- Tropical Depressions have maximum sustained winds of between 55 kilometres per hour (30 kn) and 64 kilometres per hour (35 kn) near its center.
- Tropical Storms have maximum sustained winds of 65 kilometres per hour (35 kn) and 119 kilometres per hour (64 kn).
- Typhoons achieve maximum sustained winds of 120 kilometres per hour (65 kn) to 185 kilometres per hour (100 kn),[6]
Deadliest storm
The deadliest typhoon to impact the Philippines was Typhoon Yolanda in November 8, 2013, in which 6, 800 lives were lost from its storm surges and powerful winds. Over 1,000 went missing and nearly 20,000 were injured.
Strongest typhoons
The strongest storm that hit the Philippines was Typhoon Haiyan, locally known as Yolanda. Winds reached 315 km/h in 1-min sustained and may have been the strongest storm in history in terms of wind speeds as wind speeds before the 1970s were too high.
In terms of central pressure, Typhoon Megi (2010) measured 885 mb. With this, this is the strongest storm ever to make landfall in terms of pressure.
Climate types

There are four recognized climate types in the Philippines, and they are based on the distribution of rainfall (See the Philippine Climate Map). They are described as follows:[1]
- Type I. Two pronounced seasons: dry from November to April and wet during the rest of the year.
- Type II. No dry season with a pronounced rainfall from November to January.
- Type III. Seasons are not very pronounced, relatively dry from November to April, and wet during the rest of the year.
- Type IV. Rainfall is more or less evenly distributed throughout the year.
Temperature
The average year-round temperature measured from all the weather stations in the Philippines, except Baguio City, is 26.6 °C (79.9 °F). Cooler days are usually felt in the month of January with temperature averaging at 25.5 °C (77.9 °F) and the warmest days, in the month of May with a mean of 28.3 °C (82.9 °F).[1] Elevation factors significantly in the variation of temperature in the Philippines. In Baguio City, with an elevation of 1,500 m (5,000 ft) above sea level, the mean average is 18.3 °C (64.9 °F) or cooler by about 4.3 °C (15 °F). In 1915, a one-year study was conducted by William H. Brown of the Philippine Journal of Science on top of Mount Banahaw at 2,100 m. (6,900 ft) elevation. The mean temperature measured was 18.6 °C (65.5 °F), a difference of 10 deg C (18 deg F) from the lowland mean temperature.[7]
| Climate data for Manila | |||||||||||||
|---|---|---|---|---|---|---|---|---|---|---|---|---|---|
| Month | Jan | Feb | Mar | Apr | May | Jun | Jul | Aug | Sep | Oct | Nov | Dec | Year |
| Average high °C (°F) | 30.1 (86.2) |
31.1 (88) |
32.8 (91) |
34.3 (93.7) |
34.2 (93.6) |
32.4 (90.3) |
31.3 (88.3) |
30.8 (87.4) |
31.1 (88) |
31.2 (88.2) |
31.0 (87.8) |
30.3 (86.5) |
31.72 (89.08) |
| Daily mean °C (°F) | 25.6 (78.1) |
26.1 (79) |
27.6 (81.7) |
29.1 (84.4) |
29.5 (85.1) |
28.4 (83.1) |
27.7 (81.9) |
27.4 (81.3) |
27.6 (81.7) |
27.3 (81.1) |
26.9 (80.4) |
26.0 (78.8) |
27.43 (81.38) |
| Average low °C (°F) | 20.9 (69.6) |
21.1 (70) |
22.5 (72.5) |
24.0 (75.2) |
24.8 (76.6) |
24.4 (75.9) |
24.1 (75.4) |
24.0 (75.2) |
24.0 (75.2) |
23.5 (74.3) |
22.8 (73) |
21.6 (70.9) |
23.14 (73.65) |
| Average precipitation mm (inches) | 6.3 (0.248) |
3.3 (0.13) |
7.1 (0.28) |
9.3 (0.366) |
100.4 (3.953) |
272.7 (10.736) |
341.2 (13.433) |
398.3 (15.681) |
326.0 (12.835) |
230.0 (9.055) |
120.4 (4.74) |
48.8 (1.921) |
1,863.8 (73.378) |
| Avg. rainy days | 1.0 | 1.0 | 1.0 | 1.0 | 7.0 | 14.0 | 16.0 | 19.0 | 17.0 | 13.0 | 9.0 | 5.0 | 104 |
| Source: Hong Kong Observatory[8] | |||||||||||||
| Climate data for Borongan, Eastern Samar | |||||||||||||
|---|---|---|---|---|---|---|---|---|---|---|---|---|---|
| Month | Jan | Feb | Mar | Apr | May | Jun | Jul | Aug | Sep | Oct | Nov | Dec | Year |
| Record high °C (°F) | 31 (88) |
31 (88) |
33 (91) |
32 (90) |
35 (95) |
36 (97) |
35 (95) |
37 (99) |
35 (95) |
35 (95) |
34 (93) |
33 (91) |
37 (99) |
| Average high °C (°F) | 28 (82) |
28 (82) |
29 (84) |
31 (88) |
31 (88) |
32 (90) |
32 (90) |
32 (90) |
32 (90) |
31 (88) |
30 (86) |
30 (86) |
30.5 (87) |
| Average low °C (°F) | 21 (70) |
21 (70) |
21 (70) |
22 (72) |
23 (73) |
24 (75) |
24 (75) |
24 (75) |
24 (75) |
24 (75) |
23 (73) |
22 (72) |
22.8 (72.9) |
| Record low °C (°F) | 14 (57) |
14 (57) |
16 (61) |
16 (61) |
17 (63) |
20 (68) |
22 (72) |
21 (70) |
21 (70) |
21 (70) |
19 (66) |
17 (63) |
14 (57) |
| Average precipitation mm (inches) | 640 (25.2) |
430 (16.93) |
320 (12.6) |
260 (10.24) |
240 (9.45) |
230 (9.06) |
180 (7.09) |
140 (5.51) |
180 (7.09) |
330 (12.99) |
530 (20.87) |
640 (25.2) |
4,120 (162.23) |
| Source: Weatherbase[9] | |||||||||||||
| Climate data for Cebu City | |||||||||||||
|---|---|---|---|---|---|---|---|---|---|---|---|---|---|
| Month | Jan | Feb | Mar | Apr | May | Jun | Jul | Aug | Sep | Oct | Nov | Dec | Year |
| Average high °C (°F) | 29.8 (85.6) |
30.2 (86.4) |
31.2 (88.2) |
32.3 (90.1) |
33.0 (91.4) |
32.1 (89.8) |
31.7 (89.1) |
31.9 (89.4) |
31.7 (89.1) |
31.6 (88.9) |
31.2 (88.2) |
30.3 (86.5) |
31.42 (88.56) |
| Daily mean °C (°F) | 26.8 (80.2) |
27.0 (80.6) |
27.8 (82) |
28.8 (83.8) |
29.4 (84.9) |
28.7 (83.7) |
28.3 (82.9) |
28.4 (83.1) |
28.3 (82.9) |
28.1 (82.6) |
27.9 (82.2) |
27.3 (81.1) |
28.07 (82.5) |
| Average low °C (°F) | 23.8 (74.8) |
23.7 (74.7) |
24.4 (75.9) |
25.4 (77.7) |
25.9 (78.6) |
25.3 (77.5) |
24.9 (76.8) |
25.0 (77) |
25.8 (78.4) |
24.7 (76.5) |
24.7 (76.5) |
24.2 (75.6) |
24.82 (76.67) |
| Average rainfall mm (inches) | 110 (4.33) |
70 (2.76) |
20 (0.79) |
30 (1.18) |
70 (2.76) |
170 (6.69) |
180 (7.09) |
110 (4.33) |
160 (6.3) |
200 (7.87) |
110 (4.33) |
110 (4.33) |
1,540 (60.63) |
| Source: Weatherbase [8] | |||||||||||||
| Climate data for General Santos | |||||||||||||
|---|---|---|---|---|---|---|---|---|---|---|---|---|---|
| Month | Jan | Feb | Mar | Apr | May | Jun | Jul | Aug | Sep | Oct | Nov | Dec | Year |
| Record high °C (°F) | 40 (104) |
37 (99) |
38 (100) |
38 (100) |
40 (104) |
42 (108) |
40 (104) |
37 (99) |
40 (104) |
38 (100) |
38 (100) |
37 (99) |
42 (108) |
| Average high °C (°F) | 31 (88) |
31 (88) |
32 (90) |
32 (90) |
31 (88) |
30 (86) |
30 (86) |
30 (86) |
30 (86) |
31 (88) |
31 (88) |
31 (88) |
30.8 (87.7) |
| Average low °C (°F) | 23 (73) |
24 (75) |
25 (77) |
25 (77) |
25 (77) |
25 (77) |
24 (75) |
24 (75) |
24 (75) |
24 (75) |
24 (75) |
24 (75) |
24.3 (75.5) |
| Record low °C (°F) | 18 (64) |
18 (64) |
20 (68) |
20 (68) |
17 (63) |
21 (70) |
20 (68) |
19 (66) |
20 (68) |
21 (70) |
21 (70) |
21 (70) |
17 (63) |
| Average precipitation mm (inches) | 750 (29.53) |
500 (19.69) |
110 (4.33) |
160 (6.3) |
280 (11.02) |
400 (15.75) |
390 (15.35) |
310 (12.2) |
260 (10.24) |
340 (13.39) |
260 (10.24) |
460 (18.11) |
4,220 (166.15) |
| Source: Weatherbase[9] | |||||||||||||
| Climate data for Baguio | |||||||||||||
|---|---|---|---|---|---|---|---|---|---|---|---|---|---|
| Month | Jan | Feb | Mar | Apr | May | Jun | Jul | Aug | Sep | Oct | Nov | Dec | Year |
| Record high °C (°F) | 26 (79) |
27 (81) |
27 (81) |
28 (82) |
27 (81) |
26 (79) |
26 (79) |
26 (79) |
26 (79) |
27 (81) |
26 (79) |
26 (79) |
28 (82) |
| Average high °C (°F) | 22 (72) |
22 (72) |
24 (75) |
25 (77) |
24 (75) |
23 (73) |
21 (70) |
21 (70) |
21 (70) |
22 (72) |
23 (73) |
23 (73) |
22.6 (72.7) |
| Average low °C (°F) | 11 (52) |
13 (55) |
14 (57) |
15 (59) |
16 (61) |
16 (61) |
16 (61) |
15 (59) |
15 (59) |
15 (59) |
15 (59) |
13 (55) |
14.5 (58.1) |
| Record low °C (°F) | 6 (43) |
8 (46) |
11 (52) |
10 (50) |
13 (55) |
11 (52) |
12 (54) |
12 (54) |
13 (55) |
11 (52) |
9 (48) |
7 (45) |
6 (43) |
| Average precipitation mm (inches) | 20 (0.79) |
20 (0.79) |
40 (1.57) |
100 (3.94) |
400 (15.75) |
430 (16.93) |
1,070 (42.13) |
1,160 (45.67) |
710 (27.95) |
380 (14.96) |
120 (4.72) |
50 (1.97) |
4,500 (177.17) |
| Source: Weatherbase[9] | |||||||||||||
Humidity
Relative humidity is high in the Philippines. A high amount of moisture or vapor in the air makes hot temperatures feel hotter. This quantity of moisture is due to different factors - the extraordinary evaporation from the seas that surrounds the country on all sides, to the different prevailing winds in the different seasons of the year, and finally, to the abundant rains so common in a tropical country. The first may be considered as general causes of the great humidity, which is generally observed in all the islands throughout the year. The last two may influence the different degree of humidity for the different months of the year and for the different regions of the archipelago.[10]
In the cooler months, even though the rains are more abundant in the eastern part of the Philippines, owing to the prevailing northeasterly winds, the humidity is lesser than in the western part where a dry season prevails. From June to October, although the rains are quite general throughout the Archipelago, the rains are more abundant in the western part of the Philippines, which is more exposed to the prevailing westerly and southwesterly winds; hence the humidity of the air is greater there than in the eastern part of the Archipelago.
The least comfortable months are from March to May where temperature and humidity attain their maximum levels.
Seasons
PAGASA divides the climate of the country into two main seasons—rainy and dry—with the dry season further subdivided into two: (1) the rainy season, from June to November; and (2) the dry season, from December to May. The dry season may be subdivided further into (a) the cool dry season, from December to February; and (b) the hot dry season, from March to May.[11] The months of April and May, the hot and dry months [11] when schools are on their long, between-years break, is referred to as summer while in most of the Northern Hemisphere those months are part of spring.
Graphically the seasons can be represented this way:
| Month | December–February | March–May | June–August | September–November |
|---|---|---|---|---|
| Rainfall | ||||
| Temperature | ||||
| Season | ||||
See also
- Climate
- List of wettest tropical cyclones in the Philippines
- Philippine Atmospheric, Geophysical and Astronomical Services Administration
References
- ↑ 1.0 1.1 1.2 Philippine Atmospheric, Geophysical and Astronomical Services Administration. "Climate of the Philippines". Retrieved on 2010-06-26.
- ↑ "Meteorology of the Philippines". Nature, Vol.107. Retrieved on 2010-06-26.
- ↑ 3.0 3.1 Glossary of Meteorology. Baguio. Retrieved on 2008-06-11.
- ↑ Philippine Atmospheric, Geophysical and Astronomical Services Administration. "Tropical Cyclone Statistics". Retrieved on 2010-06-26.
- ↑ Atlantic Oceanographic and Meteorological Laboratory, Hurricane Research Division. "Frequently Asked Questions: What are the upcoming tropical cyclone names?". NOAA. Retrieved 2006-12-11.
- ↑ National Weather Service (September 2006). "Hurricanes... Unleashing Nature's Fury: A Preparedness Guide" (PDF). NOAA. Retrieved 2006-12-02.
- ↑ Coronas, Rev. Jose, "The Climate and Weather of the Philippine, 1903 to 1918", p.53. Manila Bureau of Printing, 1920.
- ↑ 8.0 8.1 "Climatological Information for Manila, Philippines". Hong Kong Observatory. Retrieved 10 October 2011.
- ↑ 9.0 9.1 9.2 "Weatherbase: Weather for Borongan, Philippines". Weatherbase. 2011. Retrieved on November 22, 2011.
- ↑ Coronas, Rev. Jose, "The Climate and Weather of the Philippines, 1903 to 1918", p.125. Manila Bureau of Printing, 1920.
- ↑ 11.0 11.1 "Climate of the Philippines". Philippine Atmospheric, Geophysical and Astronomical Services Administration. Retrieved 2011-05-28.
External links
| ||||||||||||||
| |||||||||||||||||||||||||||||||||||||||||||||