Chorley Borough Council election, 2011
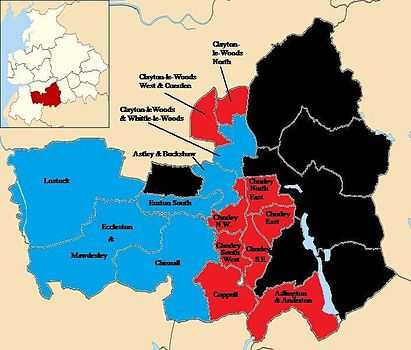
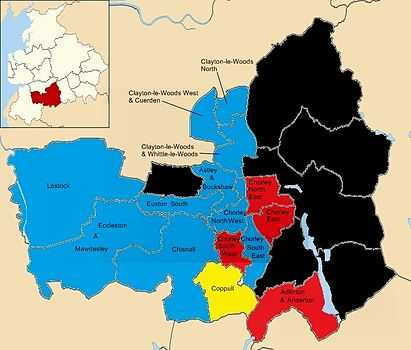
Elections to Chorley Borough Council were held on 5 May 2011. One third of the council was up for election and the Conservative party lost overall control to NOC.
Council Make-up
After the election, the composition of the council was:
Party political make-up of Chorley Council
| |
Party |
Seats |
Council (2011-2012) |
|---|
| 2008 |
2010 |
2011 |
| |
Conservative |
27 |
27 |
23 |
|
|
|
|
|
|
|
|
|
|
|
|
|
|
|
|
|
|
|
|
|
|
|
|
|
|
|
|
|
|
|
|
|
|
|
|
|
|
|
|
|
|
|
|
|
|
|
| |
Labour |
15 |
15 |
20 |
|
|
|
|
|
|
|
|
|
|
|
|
|
|
|
|
|
|
|
|
|
|
|
|
|
|
|
|
|
|
|
|
|
|
|
|
|
|
|
|
|
|
|
|
|
|
|
| |
Lib Dems |
3 |
3 |
2 |
|
|
|
|
|
|
|
|
|
|
|
|
|
|
|
|
|
|
|
|
|
|
|
|
|
|
|
|
|
|
|
|
|
|
|
|
|
|
|
|
|
|
|
|
|
|
|
| |
Independent |
2 |
2 |
2 |
|
|
|
|
|
|
|
|
|
|
|
|
|
|
|
|
|
|
|
|
|
|
|
|
|
|
|
|
|
|
|
|
|
|
|
|
|
|
|
|
|
|
|
|
|
|
|
Election result
| Chorley Local Election Result 2011 |
| Party |
Seats |
Gains |
Losses |
Net gain/loss |
Seats % |
Votes % |
Votes |
+/− |
| |
Labour |
9 |
5 |
0 |
+5 |
60 |
49.0 |
14,467 |
+10 |
| |
Conservative |
6 |
0 |
4 |
−4 |
40 |
38.3 |
11,308 |
−1 |
| |
Liberal Democrat |
0 |
0 |
1 |
−1 |
0 |
6.2 |
1,818 |
−6 |
| |
UKIP |
0 |
0 |
0 |
0 |
0 |
4.1 |
1,220 |
+3 |
| |
Independent |
0 |
0 |
0 |
0 |
0 |
2.4 |
707 |
−6 |
Results Map
 2011 results |
 Previous 2007 results |
Ward results
Adlington and Anderton ward
Astley and Buckshaw ward
Chisnall ward
Chorley East ward
| Chorley East |
| Party |
Candidate |
Votes |
% |
±% |
|
Labour |
Terry Brown |
1,381 |
75.8 |
+18 |
|
Conservative |
Simon Parkinson |
276 |
15.2 |
−7 |
|
UKIP |
Tommy Shorrock |
164 |
9.0 |
N/A |
| Majority |
1,105 |
60.7 |
+24 |
| Turnout |
1,821 |
38 |
−25 |
|
Labour hold |
Swing |
+12.5 |
|
Chorley North East ward
| Chorley North East |
| Party |
Candidate |
Votes |
% |
±% |
|
Labour |
Marion Lowe |
1,280 |
66.2 |
+18 |
|
Conservative |
Elliot Matthews |
653 |
33.8 |
+6 |
| Majority |
627 |
32.4 |
+12 |
| Turnout |
1,933 |
40 |
−27 |
|
Labour hold |
Swing |
+6 |
|
Chorley North West ward
N.B. Percentage change in vote is from 2007
Chorley South East ward
| Chorley South East |
| Party |
Candidate |
Votes |
% |
±% |
|
Labour |
Paul James Walmsley |
1,056 |
50.7 |
+6 |
|
Conservative |
Samuel Andrew Chapman |
701 |
33.7 |
−1 |
|
UKIP |
Nigel Cecil |
137 |
6.6 |
N/A |
|
Independent |
Chris P. Curtis |
103 |
4.9 |
N/A |
|
Liberal Democrat |
David Porter |
86 |
4.1 |
−12 |
| Majority |
355 |
17.0 |
+6 |
| Turnout |
2,083 |
43 |
−23 |
|
Labour gain from Conservative |
Swing |
+3.5 |
|
Chorley South West ward
Clayton le Woods and Whittle-le-Woods ward
Clayton le Woods North ward
Clayton le Woods West and Cuerden
Coppull ward
Eccleston and Mawdesley ward
Euxton South ward
Lostock ward
| Lostock |
| Party |
Candidate |
Votes |
% |
±% |
|
Conservative |
Doreen Dickinson |
699 |
43.4 |
−14 |
|
Independent |
John Forrest |
604 |
37.5 |
N/A |
|
Labour |
Michael Gaskill |
309 |
19.2 |
+20 |
| Majority |
95 |
5.9 |
−8 |
| Turnout |
1,612 |
47.0 |
+3 |
|
Conservative hold |
Swing |
−25.5 |
|
|
|---|
| | Metropolitan boroughs |
- Barnsley
- Birmingham
- Bolton
- Bradford
- Bury
- Calderdale
- Coventry
- Doncaster
- Dudley
- Gateshead
- Kirklees
- Knowsley
- Leeds
- Liverpool
- Manchester
- Newcastle upon Tyne
- North Tyneside
- Oldham
- Rochdale
- Rotherham
- Salford
- Sandwell
- Sefton
- Sheffield
- Solihull
- South Tyneside
- St Helens
- Stockport
- Sunderland
- Tameside
- Trafford
- Wakefield
- Walsall
- Wigan
- Wirral
- Wolverhampton
|
|---|
| | Unitary authorities | |
|---|
| | District councils (England) | |
|---|
| | District councils (Northern Ireland) |
- Antrim
- Ards
- Armagh
- Ballymena
- Ballymoney
- Banbridge
- Belfast
- Carrickfergus
- Castlereagh
- Coleraine
- Cookstown
- Craigavon
- Derry
- Down
- Dungannon and South Tyrone
- Fermanagh
- Larne
- Limavady
- Lisburn
- Magherafelt
- Moyle
- Newry and Mourne
- Newtownabbey
- North Down
- Omagh
- Strabane
|
|---|
| | Mayoral elections | |
|---|
| | National Assembly elections | |
|---|
| | Referendums | |
|---|
|

