Carmarthen (UK Parliament constituency)
| Carmarthen | |
|---|---|
|
Former County constituency for the House of Commons | |
| Preserved county | Dyfed |
| Major settlements | Carmarthen, Ammanford, Llandeilo |
| 1918–1997 | |
| Number of members | One |
| Replaced by | Carmarthen East & Dinefwr and Carmarthen West & South Pembrokeshire |
| 1542–1918 | |
| Number of members | One |
| Type of constituency | Borough constituency |
Carmarthen (Welsh: Caerfyrddin) was the name of a parliamentary constituency in Wales which returned one Member of Parliament to the House of Commons of the Parliament of the United Kingdom between 1542 and 1997. After its abolition in 1997, it was replaced, partly by the new Carmarthen East and Dinefwr constituency and partly by Carmarthen West and South Pembrokeshire.
History
Because the seat contained mining areas in the valley of the River Gwendraeth (until the 1980s), vast amounts of countryside and a high proportion of Welsh speakers, it was fertile territory for Labour party, the Conservatives and Plaid Cymru alike. Although the Conservatives never won the seat, they came within 1200 votes of doing so in 1983.
Carmarthen is notable for being the first constituency to elect a Plaid Cymru MP, Gwynfor Evans, at a 1966 by-election. Evans was then involved in one of the closest General Election results ever in February 1974, when he lost to the winning Labour candidate by only three votes.[1][2]
Boundaries
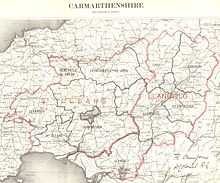
Until 1832, it was a borough constituency consisting of the town of Carmarthen. Between 1832 and 1918 it was a district of boroughs constituency, consisting of Carmarthen itself and Llanelli, and was sometimes called The Carmarthen Boroughs.
In 1918, the borough was abolished, but the name was transferred to one of the divisions of the county of Carmarthenshire. The constituency was made up of the whole of the county of Carmarthenshire except for the urban area around Llanelli. Notable towns were Carmarthen itself, Ammanford and Llandeilo.
In 1997, the Boundary Commission for Wales recommended an extra seat for Dyfed.[3] This led to the seat being split two to one between Carmarthen East & Dinefwr and Carmarthen West & South Pembrokeshire.[4]
Members of Parliament
MPs 1542–1640
| Parliament | Member |
|---|---|
| 1542 | Gruffydd Williams[5] |
| 1545 | Gruffydd Williams[5] |
| 1547 | Thomas Phaer[5] |
| 1553 (Mar) | William Parry[5] |
| 1553 (Oct) | Gruffydd Hygons[5] |
| 1554 (Apr) | William Aubrey[5][6] |
| 1554 (Nov) | John Parry[5] |
| 1555 | William Wightman[5] |
| 1558 | John Vaughan[5] |
| 1559 | John Parry[7] |
| 1563 | John Morgan[7] |
| 1571 | ?John Vaughan[7] |
| 1572 | Thomas Wigmore[7] |
| 1584 | John Puckering, sat for Bedford replaced 1584 by Edward Donne Lee[7] |
| 1586 | Edward Donne Lee[7] |
| 1588 | Gelly Meyrick[7] |
| 1593 | Sir Thomas Baskerville[7] |
| 1597 | Henry Vaughan[7] |
| 1601 | Walter Rice[7] |
| 1604–1611 | Sir Walter Rice |
| 1614 | William Thomas |
| 1621 | Henry Vaughan |
| 1624 | Henry Vaughan |
| 1626 | Henry Vaughan |
| 1628 | Henry Vaughan |
| 1629–1640 | No Parliaments summoned |
1640–1832
| Election | Member[8] | Party | |
|---|---|---|---|
| 1640 (Apr) | Francis Lloyd | Royalist | |
| 1640 (Nov) | Francis Lloyd | Royalist | |
| February 1644 | Lloyd disabled from sitting – seat vacant | ||
| 1646 | William Davies | ||
| December 1648 | Davies not recorded as sitting after Pride's Purge | ||
| 1653 | Carmarthen was not represented in the Barebones Parliament or the First or Second Parliaments of the Protectorate | ||
| January 1659 | David Morgan | ||
| May 1659 | Not represented in the restored Rump | ||
| April 1660 | Arthur Annesley | ||
| 1661 | Hon. John Vaughan | ||
| 1679 | Altham Vaughan | ||
| 1685 | Richard Vaughan | ||
| 1725 | James Phillips | ||
| 1727 | Arthur Bevan | ||
| 1741 | Sir John Philipps | ||
| 1747 | Thomas Mathews | ||
| 1751 | Griffith Philipps | ||
| 1761 | The Earl Verney | ||
| 1768 | Griffith Philipps | ||
| 1774 | John Adams | ||
| 1780 | George Philipps | ||
| 1784 | John George Philipps | ||
| May 1796 | Magens Dorrien Magens[9] | ||
| November 1796 | John George Philipps | ||
| 1803 | Sir William Paxton | ||
| 1806 | Vice-Admiral George Campbell | ||
| 1813 | John Frederick Campbell | ||
| 1821 | John Jones | ||
1832–1918: Carmarthen Boroughs
| Election | Member[8] | Party | |
|---|---|---|---|
| 1832 | Hon. William Yelverton | Whig | |
| 1835 | David Lewis | Conservative | |
| 1837 | David Morris | Whig | |
| 1859 | Liberal | ||
| 1864 | William Morris | Liberal | |
| 1868 | (Sir) John Cowell-Stepney[10] | Liberal | |
| 1874 | Charles William Nevill | Conservative | |
| 1876 | (Sir) Arthur Cowell-Stepney[11] | Liberal | |
| 1878 by-election | Benjamin Thomas Williams | Liberal | |
| 1882 by-election | John Jones Jenkins | Liberal | |
| 1886 | Sir Arthur Cowell-Stepney | Liberal | |
| 1892 | Evan Rowland Jones | Liberal | |
| 1895 | Sir John Jones Jenkins | Liberal Unionist | |
| 1900 | Alfred Davies | Liberal | |
| 1906 | William Llewelyn Williams | Liberal | |
1918–1997: county constituency
| Election | Member[8] | Party | |
|---|---|---|---|
| 1918 | John Hinds | Coalition Liberal | |
| 1923 | Sir Ellis Ellis-Griffith | Liberal | |
| 1924 by-election | Alfred Mond | Liberal | |
| 1926 | Conservative | ||
| 1928 by-election | William Nathaniel Jones | Liberal | |
| 1929 | Daniel Hopkin | Labour | |
| 1931 | Richard Thomas Evans | Liberal | |
| 1935 | Daniel Hopkin | Labour | |
| 1941 by-election | Ronw Moelwyn Hughes | Labour | |
| 1945 | Rhys Hopkin Morris | Liberal | |
| 1957 by-election | Megan Lloyd-George | Labour | |
| 1966 by-election | Gwynfor Evans | Plaid Cymru | |
| 1970 | Gwynoro Jones | Labour | |
| Oct. 1974 | Gwynfor Evans | Plaid Cymru | |
| 1979 | Roger Thomas | Labour | |
| 1987 | Alan Wynne Williams | Labour | |
| 1997 | constituency abolished: see Carmarthen East & Dinefwr and Carmarthen West & South Pembrokeshire | ||
Elections
Elections in the 1880s
| General Election 1885 Carmarthen Boroughs[12]
Electorate 5,399 | |||||
|---|---|---|---|---|---|
| Party | Candidate | Votes | % | ±% | |
| Liberal | Sir John Jones Jenkins | 2,884 | 69.2 | ||
| Conservative | John Simmons Tregoning | 1,281 | 30.8 | ||
| Majority | 1,603 | 38.4 | |||
| Turnout | 77.1 | ||||
| Liberal hold | Swing | ||||
| General Election 1886 Carmarthen Boroughs[12]
Electorate 5,399 | |||||
|---|---|---|---|---|---|
| Party | Candidate | Votes | % | ±% | |
| Liberal | Sir Arthur Cowell-Stepney | 2,120 | 52.8 | ||
| Liberal Unionist | Sir John Jones Jenkins | 1,898 | 47.2 | ||
| Majority | 222 | 5.6 | |||
| Turnout | |||||
| Liberal hold | Swing | ||||
Elections in the 1890s
| General Election 1892 Carmarthen Boroughs[12]
Electorate 5,289 | |||||
|---|---|---|---|---|---|
| Party | Candidate | Votes | % | ±% | |
| Liberal | Evan Rowland Jones | 2,412 | 52.4 | ||
| Liberal Unionist | Sir John Jones Jenkins | 2,187 | 47.6 | ||
| Majority | 225 | 4.8 | |||
| Turnout | 87.0 | ||||
| Liberal hold | Swing | ||||
- Lewis Morris was Liberal candidate but retired before the poll.[13]
| General Election 1895 Carmarthen Boroughs[12]
Electorate 5,370 | |||||
|---|---|---|---|---|---|
| Party | Candidate | Votes | % | ±% | |
| Liberal Unionist | Sir John Jones Jenkins | 2,443 | 50.5 | ||
| Liberal | Evan Rowland Jones | 2,391 | 49.5 | ||
| Majority | 52 | 1.0 | |||
| Turnout | |||||
| Liberal Unionist gain from Liberal | Swing | ||||
Elections in the 1900s
| General Election 1900 Carmarthen Boroughs[12]
Electorate 5,557 | |||||
|---|---|---|---|---|---|
| Party | Candidate | Votes | % | ±% | |
| Liberal | Alfred Davies | 2,837 | 58.1 | ||
| Liberal Unionist | Sir John Jones Jenkins | 2,047 | 41.9 | ||
| Majority | 790 | 16.2 | |||
| Turnout | 87.9 | ||||
| Liberal gain from Liberal Unionist | Swing | ||||
| General Election 1906 Carmarthen Boroughs[12]
Electorate 6,258 | |||||
|---|---|---|---|---|---|
| Party | Candidate | Votes | % | ±% | |
| Liberal | William Llewelyn Williams | 3,902 | 68.3 | ||
| Liberal Unionist | Hon. Vere Brabazon Ponsonby | 1,808 | 31.7 | ||
| Majority | 2,094 | 36.6 | |||
| Turnout | 91.2 | ||||
| Liberal hold | Swing | ||||
Elections in the 1910s
| General Election January 1910: Carmarthen Boroughs[14]
Electorate 6,772 | |||||
|---|---|---|---|---|---|
| Party | Candidate | Votes | % | ±% | |
| Liberal | William Llewelyn Williams | 4,197 | 68.1 | ||
| Liberal Unionist | Viscount Tiverton | 1,965 | 31.9 | ||
| Majority | 2,232 | 36.2 | |||
| Turnout | 91.0 | ||||
| Liberal hold | Swing | ||||
General Election December 1910 Liberal: William Llewelyn Williams elected unopposed.
| Carmarthen District by-election, 1912[14]
Electorate 7,279 | |||||
|---|---|---|---|---|---|
| Party | Candidate | Votes | % | ±% | |
| Liberal | William Llewelyn Williams | 3,836 | 58.6 | -9.5 | |
| Conservative | Henry Coulson Bond | 2,555 | 39.1 | +7.2 | |
| Independent Labour | F G Vivian | 149 | 2.3 | n/a | |
| Majority | 1,281 | 19.5 | 16.7 | ||
| Turnout | 89.8 | ||||
| Liberal hold | Swing | -8.3 | |||
General Election 1918 Liberal: John Hinds elected unopposed.
Elections in the 1920s
| General Election 1922
Electorate 36,213 | |||||
|---|---|---|---|---|---|
| Party | Candidate | Votes | % | ±% | |
| National Liberal | John Hinds | 12,530 | 41.8 | ||
| Unionist | Hon. George William R. V. Coventry | 8,805 | 29.4 | ||
| Agriculture | Daniel Johns | 4,775 | 15.9 | ||
| Liberal | H. Llewelyn-Williams | 3,847 | 12.8 | ||
| Majority | |||||
| Turnout | 29,957 | 82.7 | |||
| National Liberal hold | Swing | ||||
| General Election 1923
Electorate 36,779 | |||||
|---|---|---|---|---|---|
| Party | Candidate | Votes | % | ±% | |
| Liberal | Rt Hon Sir Ellis Jones Ellis-Griffith | 12,988 | 45.1 | ||
| Unionist | Sir Arthur Stephens | 8,677 | 30.1 | ||
| Labour | R. Williams | 7,132 | 24.8 | ||
| Majority | 4,311 | ||||
| Turnout | 78.3 | ||||
| Liberal hold | Swing | ||||
| Carmarthen by-election, 1924:[15]
Electorate | |||||
|---|---|---|---|---|---|
| Party | Candidate | Votes | % | ±% | |
| Liberal | Rt Hon. Sir Alfred Moritz Mond | 12,760 | 44.0 | -1.1 | |
| Labour | Rev. Edward Teilo Owen | 8,351 | 28.8 | +4.0 | |
| Unionist | Sir Arthur Stephens | 7,896 | 27.2 | -2.9 | |
| Majority | 4,409 | 15.2 | |||
| Turnout | 78.9 | ||||
| Liberal hold | Swing | ||||
| General Election 1924:
Electorate 37,155 | |||||
|---|---|---|---|---|---|
| Party | Candidate | Votes | % | ±% | |
| Liberal | Rt Hon. Sir Alfred Moritz Mond | 17,281 | 68.5 | ||
| Labour | Rev. Edward Teilo Owen | 7,953 | 31.5 | ||
| Majority | 9,328 | 37.0 | |||
| Turnout | 67.9 | ||||
| Liberal hold | Swing | ||||
| Carmarthen by-election, 1928
Electorate | |||||
|---|---|---|---|---|---|
| Party | Candidate | Votes | % | ±% | |
| Liberal | William Nathaniel Jones | 10,201 | 35.5 | ||
| Labour | Daniel Hopkin | 10,154 | 35.4 | ||
| Unionist | Sir Courtenay Cecil Mansel | 8,361 | 29.1 | ||
| Majority | 47 | 0.1 | |||
| Turnout | 30,316 | 76.6 | |||
| Liberal hold | Swing | ||||
| General Election 1929
Electorate 46,110 | |||||
|---|---|---|---|---|---|
| Party | Candidate | Votes | % | ±% | |
| Labour | Daniel Hopkin | 15,130 | 38.2 | ||
| Liberal | William Nathaniel Jones | 14,477 | 36.6 | ||
| Unionist | Hon. John Bonynge Coventry | 9,961 | 25.2 | ||
| Majority | 653 | 1.6 | |||
| Turnout | |||||
| Labour gain from Liberal | Swing | ||||
Elections in the 1930s
| General Election 1931
Electorate 46,454 | |||||
|---|---|---|---|---|---|
| Party | Candidate | Votes | % | ±% | |
| Liberal | Richard Thomas Evans | 15,532 | 39.5 | ||
| Labour | Daniel Hopkin | 14,318 | 36.5 | ||
| Conservative | D W C Davies-Evans | 9,434 | 24.0 | ||
| Majority | 1,214 | 3.1 | |||
| Turnout | 39,284 | 84.5 | |||
| Liberal gain from Labour | Swing | ||||
| General Election 1935
Electorate 48,217 | |||||
|---|---|---|---|---|---|
| Party | Candidate | Votes | % | ±% | |
| Labour | Daniel Hopkin | 18,146 | 47.5 | ||
| Liberal | Richard Thomas Evans | 12,911 | 33.8 | ||
| Conservative | Edward Orlando Kellett | 7,177 | 18.8 | ||
| Majority | 5,235 | 13.7 | |||
| Turnout | 38,234 | 79.3 | |||
| Labour gain from Liberal | Swing | ||||
Elections in the 1940s
Carmarthen by-election, 1941 Labour: Moelwyn Hughes elected unopposed.
| General Election 1945: Carmarthen[16]
Electorate | |||||
|---|---|---|---|---|---|
| Party | Candidate | Votes | % | ±% | |
| Liberal | Rhys Hopkin Morris | 19,783 | 51.7 | ||
| Labour | R. Moelwyn Hughes | 18,504 | 48.3 | ||
| Majority | 1,279 | 3.3 | |||
| Turnout | 38,286 | 76.1 | |||
| Liberal gain from Labour | Swing | ||||
Elections in the 1950s
| General Election 1950: Carmarthen:[17]
Electorate 58,444 | |||||
|---|---|---|---|---|---|
| Party | Candidate | Votes | % | ±% | |
| Liberal | Rhys Hopkin Morris | 24,472 | 50.2 | -1.48 | |
| Labour | Arwyn Lynn Ungoed-Thomas | 24,285 | 49.8 | +1.48 | |
| Majority | 187 | 0.4 | -2.96 | ||
| Turnout | 48,759 | 83.4 | +7.3 | ||
| Liberal hold | Swing | ||||
| General Election 1951: Carmarthen[18]
Electorate 58,709 | |||||
|---|---|---|---|---|---|
| Party | Candidate | Votes | % | ±% | |
| Liberal | Rhys Hopkin Morris | 25,632 | 50.46 | +0.27 | |
| Labour | David Owen | 25,165 | 49.54 | -0.65 | |
| Majority | 467 | 0.92 | +0.54 | ||
| Turnout | 5,0795 | 86.52 | +3.09 | ||
| Liberal hold | Swing | ||||
| General Election 1955: Carmarthen[19]
Electorate 57,956 | |||||
|---|---|---|---|---|---|
| Party | Candidate | Votes | % | ±% | |
| Liberal | Rhys Hopkin Morris | 24,410 | 49.49 | -0.97 | |
| Labour | Jack Evans | 21,077 | 42.73 | -6.81 | |
| Plaid Cymru | Jennie Eirian Davies | 3,835 | 7.78 | ||
| Majority | 3,333 | 6.76 | +5.84 | ||
| Turnout | 49,320 | 85.10 | -1.42 | ||
| Liberal hold | Swing | ||||
| Carmarthen by-election, 1957
Electorate | |||||
|---|---|---|---|---|---|
| Party | Candidate | Votes | % | ±% | |
| Labour | Lady Megan Arfon Lloyd George | 23,679 | 47.3 | ||
| Liberal | John Morgan Davies | 20,610 | 41.2 | ||
| Plaid Cymru | Jennie Eirian Davies | 5,741 | 11.5 | ||
| Majority | 3,069 | 6.1 | |||
| Turnout | 43,726 | 87.4 | |||
| Labour gain from Liberal | Swing | ||||
| General Election 1959: Carmarthen[20]
Electorate 57,195 | |||||
|---|---|---|---|---|---|
| Party | Candidate | Votes | % | ±% | |
| Labour | Lady Megan Arfon Lloyd George | 23,399 | 47.89 | +5.16 | |
| Liberal | Alun Talfan Davies | 16,766 | 34.32 | -15.17 | |
| Conservative | JB Evans | 6,147 | 12.58 | ||
| Plaid Cymru | Hywel Heulyn Roberts | 2,545 | 5.21 | ||
| Majority | 6,633 | 13.58 | +6.82 | ||
| Turnout | 48,855 | 85.42 | +0.32 | ||
| Labour hold | Swing | ||||
Elections in the 1960s
| General Election 1964: Caerfyrddin[21]
Electorate 55,786 | |||||
|---|---|---|---|---|---|
| Party | Candidate | Votes | % | ±% | |
| Labour | Lady Megan Arfon Lloyd George | 21,424 | 45.5 | -2.4 | |
| Liberal | Alun Talfan Davies | 15,210 | 32.3 | -2.0 | |
| Plaid Cymru | Gwynfor Richard Evans | 5,495 | 11.7 | +6.4 | |
| Conservative | Mrs. HE Protheroe-Beynon | 4,996 | 10.6 | -2.0 | |
| Majority | 6,214 | 13.2 | -0.4 | ||
| Turnout | 47,122 | 84.4 | -0.9 | ||
| Labour hold | Swing | ||||
| General Election 1966: Caerfyrddin[22]
Electorate 55,669 | |||||
|---|---|---|---|---|---|
| Party | Candidate | Votes | % | ±% | |
| Labour | Lady Megan Arfon Lloyd George | 21,221 | 46.2 | +0.7 | |
| Liberal | D Hywel Davies | 11,988 | 26.1 | -6.2 | |
| Plaid Cymru | Gwynfor Richard Evans | 7,416 | 16.1 | +4.5 | |
| Conservative | Simon J Day | 5,338 | 11.6 | +1.0 | |
| Majority | 9,233 | 20.1 | +6.9 | ||
| Turnout | 45,960 | 82.6 | -1.9 | ||
| Labour hold | Swing | ||||
| Carmarthen by-election, 1966:Caerfyrddin
Electorate 55,669 | |||||
|---|---|---|---|---|---|
| Party | Candidate | Votes | % | ±% | |
| Plaid Cymru | Gwynfor Evans | 16,179 | 39.0 | ||
| Labour | Gwilym Prys Prys-Davies | 13,743 | 33.1 | ||
| Liberal | D Hywel Davies | 8,650 | 20.8 | ||
| Conservative | Simon J Day | 2,934 | 7.1 | ||
| Majority | 2,436 | 5.9 | |||
| Turnout | |||||
| Plaid Cymru gain from Labour | Swing | ||||
Elections in the 1970s
| General Election 1970: Caerfyrddin[23]
Electorate 58,904 | |||||
|---|---|---|---|---|---|
| Party | Candidate | Votes | % | ±% | |
| Labour | Gwynoro Glyndwr Jones | 18,719 | 38.0 | ||
| Plaid Cymru | Richard Gwynfor Evans | 14,812 | 30.1 | ||
| Liberal | Hywel Gruffydd E Thomas | 10,707 | 21.7 | ||
| Conservative | Lloyd Harvard Davies | 4,975 | 10.1 | ||
| Majority | 3,907 | 7.9 | |||
| Turnout | 49,214 | 83.5 | |||
| Labour gain from Plaid Cymru | Swing | ||||
| General Election, (February) 1974: Caerfyrddin[24]
Electorate | |||||
|---|---|---|---|---|---|
| Party | Candidate | Votes | % | ±% | |
| Labour | Gwynoro Glyndwr Jones | 17,165 | 34.3 | ||
| Plaid Cymru | Richard Gwynfor Evans | 17,162 | 34.3 | ||
| Liberal | DO Jones | 9,698 | 19.4 | ||
| Conservative | WJN Dunn | 6,037 | 12.1 | ||
| Majority | 3 | 0.01% | |||
| Turnout | 83.5 | ||||
| Labour hold | Swing | ||||
| General Election, (October) 1974: Caerfyrddin[25]
Electorate | |||||
|---|---|---|---|---|---|
| Party | Candidate | Votes | % | ±% | |
| Plaid Cymru | Richard Gwynfor Evans | 23,325 | 45.1 | ||
| Labour | Gwynoro Glyndwr Jones | 19,685 | 38.1 | ||
| Liberal | David Roderick Owen-Jones | 5,393 | 10.4 | ||
| Conservative | Robert Antony Hayward | 2,962 | 5.7 | ||
| British Candidate | Edward .B Jones | 342 | 0.7 | ||
| Majority | 3,640 | 7.0 | |||
| Turnout | 51,704 | 85.6 | |||
| Plaid Cymru gain from Labour | Swing | ||||
| General Election, 1979: Caerfyrddin[26]
Electorate | |||||
|---|---|---|---|---|---|
| Party | Candidate | Votes | % | ±% | |
| Labour | Roger Thomas | 18,667 | 35.9 | ||
| Plaid Cymru | Richard Gwynfor Evans | 16,689 | 32.0 | ||
| Conservative | NM Thomas | 12,272 | 23.6 | ||
| Liberal | Richard Clement Charles Thomas | 4,186 | 8.0 | ||
| National Front | Charlie Grice | 149 | 0.3 | ||
| New Britain | EJ Clarke | 126 | 0.2 | ||
| Majority | 1,978 | 3.8 | |||
| Turnout | 52,086 | 84.4 | |||
| Labour gain from Plaid Cymru | Swing | ||||
Elections in the 1980s
| General Election, 1983: Carmarthen[27] | |||||
|---|---|---|---|---|---|
| Party | Candidate | Votes | % | ±% | |
| Labour | Roger Thomas | 16,459 | 31.57% | ||
| Conservative | NM Thomas | 15,305 | 29.36% | ||
| Plaid Cymru | Gwynfor Evans | 14,099 | 27.05% | ||
| SDP–Liberal Alliance | J Colin | 5,737 | 11.01% | ||
| Ecology | B Kingzett | 374 | 0.72% | ||
| BNP | Charlie Grice | 154 | 0.3% | ||
| Majority | 1,154 | 2.21% | |||
| Turnout | 52,126 | 82.13% | |||
| Labour hold | Swing | ||||
| General Election, 1987: Carmarthen[28] | |||||
|---|---|---|---|---|---|
| Party | Candidate | Votes | % | ±% | |
| Labour | Alan Wynne Williams | 19,128 | 35.37 | ||
| Conservative | Rod Richards | 14,811 | 27.39 | ||
| Plaid Cymru | HT Edwards | 12,457 | 23.03 | ||
| SDP–Liberal Alliance | Gwynoro Glyndwr Jones | 7,203 | 13.32 | ||
| Green | GE Oubridge | 481 | 0.89 | ||
| Majority | 4,317 | 7.98 | |||
| Turnout | 54,080 | 82.88 | |||
| Labour hold | Swing | ||||
Elections in the 1990s
| General Election 1992: Carmarthen[29] | |||||
|---|---|---|---|---|---|
| Party | Candidate | Votes | % | ±% | |
| Labour | Alan Wynne Williams | 20,879 | 36.6 | +1.3 | |
| Plaid Cymru | H. Rhodri Glyn Thomas | 17,957 | 31.5 | +8.5 | |
| Conservative | Stephen J. Cavenagh | 12,782 | 22.4 | −5.0 | |
| Liberal Democrat | Mrs Juliana M.J. Hughes | 5,353 | 9.4 | −3.9 | |
| Majority | 2,922 | 5.1 | −2.9 | ||
| Turnout | 56,971 | 82.7 | −0.1 | ||
| Labour hold | Swing | −3.6 | |||
Notes and references
- ↑ BBC News http://news.bbc.co.uk/hi/english/static/vote2001/results_constituencies/constituencies/128.stm. Missing or empty
|title=(help) - ↑ The BBC article quoted above says that it was the second closest General Election result since the Second World War. Certainly the Winchester general election result of 1997 was closer.
- ↑ C. Rallings & M. Thrasher, The Media Guide to the New Parliamentary Constituencies, p.12 (Plymouth: LGC Elections Centre, 1995)
- ↑ C. Rallings & M. Thrasher, The Media Guide to the New Parliamentary Constituencies, p.202 (Plymouth: LGC Elections Centre, 1995)
- ↑ 5.0 5.1 5.2 5.3 5.4 5.5 5.6 5.7 5.8 "History of Parliament". History of Parliament Trust. Retrieved 2011-11-26.
- ↑ Watkin, Thomas Glyn (January 2008). "Aubrey, William (c.1529–1595)". Oxford Dictionary of National Biography (online edition, subscription required). Oxford University Press. Retrieved 2008-02-24.
- ↑ 7.0 7.1 7.2 7.3 7.4 7.5 7.6 7.7 7.8 7.9 "History of Parliament". History of Parliament Trust. Retrieved 2011-11-26.
- ↑ 8.0 8.1 8.2 Leigh Rayment's Historical List of MPs – Constituencies beginning with "C" (part 2)
- ↑ On petition, Magens was found not to have been duly elected, and his opponent Phillips was seated in his place
- ↑ Created a baronet, 1871
- ↑ Succeeded to baronetcy, 1877
- ↑ 12.0 12.1 12.2 12.3 12.4 12.5 British parliamentary election results, 1885–1918 (Craig)
- ↑ ‘MORRIS, Sir Lewis’, Who Was Who, A & C Black, an imprint of Bloomsbury Publishing plc, 1920–2015; online edn, Oxford University Press, 2014 ; online edn, April 2014 accessed 23 April 2015
- ↑ 14.0 14.1 Craig, F. W. S. (1974). British parliamentary election results 1885–1918 (1 ed.). London: Macmillan.
- ↑ F W S Craig, British Parliamentary Election Results 1918–1949; Political Reference Publications, Glasgow 1949, p551
- ↑ http://www.politicsresources.net/area/uk/ge45/i05.htm
- ↑ http://www.politicsresources.net/area/uk/ge50/i05.htm
- ↑ http://www.politicsresources.net/area/uk/ge51/i05.htm
- ↑ http://www.politicsresources.net/area/uk/ge55/i05.htm
- ↑ http://www.politicsresources.net/area/uk/ge59/i05.htm
- ↑ http://www.politicsresources.net/area/uk/ge64/i05.htm
- ↑ http://www.politicsresources.net/area/uk/ge66/i05.htm
- ↑ http://www.politicsresources.net/area/uk/ge70/i05.htm
- ↑ http://www.politicsresources.net/area/uk/ge74a/i05.htm
- ↑ http://www.politicsresources.net/area/uk/ge74b/i05.htm
- ↑ http://www.politicsresources.net/area/uk/ge79/i05.htm
- ↑ http://www.politicsresources.net/area/uk/ge83/i05.htm
- ↑ http://www.politicsresources.net/area/uk/ge87/i05.htm
- ↑ "Politics Resources". Election 1992. Politics Resources. 9 April 1992. Retrieved 6 Dec 2010.
Sources
- Robert Beatson, A Chronological Register of Both Houses of Parliament (London: Longman, Hurst, Res & Orme, 1807)
- D Brunton & D H Pennington, Members of the Long Parliament (London: George Allen & Unwin, 1954)
- Cobbett's Parliamentary history of England, from the Norman Conquest in 1066 to the year 1803 (London: Thomas Hansard, 1808)
- The Constitutional Year Book for 1913 (London: National Union of Conservative and Unionist Associations, 1913)
- F W S Craig, British Parliamentary Election Results 1832–1885 (2nd edition, Aldershot: Parliamentary Research Services, 1989)
- J Holladay Philbin, Parliamentary Representation 1832 – England and Wales (New Haven: Yale University Press, 1965)