Carlisle City Council election, 2006
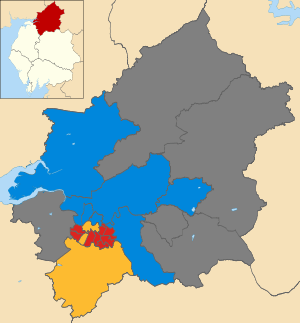
Map of the results of the 2006 Carlisle City Council election.
Labour in red,
Conservatives in blue and Liberal Democrats in yellow. Wards in grey were not contested in 2006.
The 2006 Carlisle City Council election took place on 4 May 2006 to elect members of Carlisle District Council in Cumbria, England. One third of the council was up for election and the council stayed under no overall control.[1]
After the election, the composition of the council was
Background
Before the election the Conservatives ran the council with 20 seats and the backing of the 7 Liberal Democrats.[3] Labour was in opposition despite being the largest group on the council with 24 seats[4] and needed 3 gains to take control.[3]
19 of the 52 seats on the council were being elected,[4] with extra seats contested in Stanwix Rural and Upperby wards after the sitting councillors, Conservative Edward Firth and Labour's Caroline Watson, stood down.[5] Labour were defending 9 seats, compared to 8 for the Conservatives and 2 Liberal Democrats.[3] Candidates at the election included 11 independents standing to protest against the demolition of the Warwick Road cinema and the first candidate from the English Democrats Party in Belah ward.[5]
Before the election top Labour targets were reported as being Morton and Castle from the Liberal Democrats and Belah from the Conservatives.[3] The Conservatives were targeting Yewdale from Labour, while the Liberal Democrats aimed to take Dalston from the Conservatives.[3]
Election result
Labour remained the largest party on the council with 24 councillors after only one seat changed hands.[6][7] The Liberal Democrats gained Dalston from the Conservatives,[6] to go up to 8 seats, while the Conservatives dropped to 19 and there remained 1 independent.[7] Overall turnout at the election was 34.6%, down from 42.6% at the 2004 election.[8]
Following the election Michael Boaden became the new leader of the Labour group, after challenging the previous leader Heather Bradley.[9] However Conservative Mike Mitchelson remained as council leader after being re-elected by 26 votes to 25 at the annual council meeting on 22 May.[10] This came after the Liberal Democrats backed the Conservatives and Liberal Democrat Peter Farmer was elected mayor by the same margin.[10]
| Carlisle local election result 2006[2][8] |
| Party |
Seats |
Gains |
Losses |
Net gain/loss |
Seats % |
Votes % |
Votes |
+/− |
| |
Labour |
9 |
0 |
0 |
0 |
47.4 |
35.6 |
9,629 |
-2.4% |
| |
Conservative |
7 |
0 |
1 |
-1 |
36.8 |
40.7 |
11,009 |
-0.4% |
| |
Liberal Democrat |
3 |
1 |
0 |
+1 |
15.8 |
13.7 |
3,694 |
-2.0% |
| |
Independent |
0 |
0 |
0 |
0 |
0 |
8.3 |
2,237 |
+3.8% |
| |
English Democrats |
0 |
0 |
0 |
0 |
0 |
0.9 |
247 |
+0.9% |
| |
Green |
0 |
0 |
0 |
0 |
0 |
0.8 |
222 |
+0.0% |
Ward results
| Belah[8][11] |
| Party |
Candidate |
Votes |
% |
±% |
|
Conservative |
Sandra Fisher |
976 |
54.3 |
-16.3 |
|
Labour |
Grant Warwick |
435 |
24.2 |
-5.2 |
|
English Democrats |
Stephen Gash |
247 |
13.8 |
+13.8 |
|
Independent |
Charmain Hunt |
138 |
7.7 |
+7.7 |
| Majority |
541 |
30.1 |
-11.0 |
| Turnout |
1,796 |
37.9 |
-9.0 |
|
Conservative hold |
Swing |
|
|
| Belle Vue[8][11] |
| Party |
Candidate |
Votes |
% |
±% |
|
Labour |
Jessica Riddle |
601 |
43.4 |
+0.9 |
|
Conservative |
John Mallinson |
582 |
42.0 |
+1.2 |
|
Independent |
Linda Hargreaves |
202 |
14.6 |
+14.6 |
| Majority |
19 |
1.4 |
-0.3 |
| Turnout |
1,385 |
32.6 |
-9.5 |
|
Labour hold |
Swing |
|
|
| Botcherby[8][11] |
| Party |
Candidate |
Votes |
% |
±% |
|
Labour |
Anne Glendinning |
602 |
55.5 |
-2.0 |
|
Conservative |
Theresa Cartner |
314 |
29.0 |
-13.5 |
|
Independent |
Edna Croft |
168 |
15.5 |
+15.5 |
| Majority |
288 |
26.6 |
+11.7 |
| Turnout |
1,084 |
24.3 |
-8.4 |
|
Labour hold |
Swing |
|
|
| Castle[8][11] |
| Party |
Candidate |
Votes |
% |
±% |
|
Liberal Democrat |
Olwyn Luckley |
632 |
54.0 |
-8.9 |
|
Labour |
Ann Warwick |
321 |
27.4 |
-9.7 |
|
Conservative |
George Bain |
149 |
12.7 |
+12.7 |
|
Independent |
Donald Patterson |
69 |
5.9 |
+5.9 |
| Majority |
311 |
26.6 |
+0.8 |
| Turnout |
1,171 |
28.3 |
-7.4 |
|
Liberal Democrat hold |
Swing |
|
|
| Currock[8][11] |
| Party |
Candidate |
Votes |
% |
±% |
|
Labour |
Heather Bradley |
663 |
56.2 |
-1.3 |
|
Conservative |
Shaidat Danmole-Ellis |
221 |
18.7 |
-7.9 |
|
Liberal Democrat |
Marjorie Richardson |
151 |
12.8 |
-3.1 |
|
Independent |
Fiona Robson |
144 |
12.2 |
+12.2 |
| Majority |
442 |
37.5 |
+6.6 |
| Turnout |
1,179 |
27.5 |
-7.1 |
|
Labour hold |
Swing |
|
|
| Dalston[8][11] |
| Party |
Candidate |
Votes |
% |
±% |
|
Liberal Democrat |
Steven Tweedie |
891 |
44.3 |
+0.7 |
|
Conservative |
Lucy Crookdale |
874 |
43.5 |
+0.0 |
|
Labour |
Ross Warwick |
246 |
12.2 |
-0.7 |
| Majority |
17 |
0.8 |
+0.8 |
| Turnout |
2,011 |
43.3 |
-10.8 |
|
Liberal Democrat gain from Conservative |
Swing |
|
|
| Denton Holme[8][11] |
| Party |
Candidate |
Votes |
% |
±% |
|
Labour |
Paul Atkinson |
780 |
60.2 |
-5.0 |
|
Conservative |
Patricia Vasey |
329 |
25.4 |
-9.4 |
|
Liberal Democrat |
Janet Tootle |
166 |
12.8 |
+12.8 |
|
Independent |
Lynn Barlow |
21 |
1.6 |
+1.6 |
| Majority |
451 |
34.8 |
+4.5 |
| Turnout |
1,296 |
28.4 |
-7.1 |
|
Labour hold |
Swing |
|
|
| Morton[8][11] |
| Party |
Candidate |
Votes |
% |
±% |
|
Liberal Democrat |
John Farmer |
961 |
49.0 |
-6.6 |
|
Labour |
John Bell |
837 |
42.6 |
-1.8 |
|
Independent |
Philip Weir |
165 |
8.4 |
+8.4 |
| Majority |
124 |
6.3 |
-4.9 |
| Turnout |
1,963 |
41.2 |
-5.8 |
|
Liberal Democrat hold |
Swing |
|
|
| St Aidans[8][11] |
| Party |
Candidate |
Votes |
% |
±% |
|
Labour |
Anne Quilter |
669 |
49.1 |
+0.2 |
|
Conservative |
Lawrence Fisher |
421 |
30.9 |
-7.4 |
|
Liberal Democrat |
Olive Hall |
193 |
14.2 |
+14.2 |
|
Independent |
Colin Paisley |
80 |
5.9 |
+5.9 |
| Majority |
248 |
18.2 |
+7.6 |
| Turnout |
1,363 |
31.1 |
-7.6 |
|
Labour hold |
Swing |
|
|
| Stanwix Urban[8][11] |
| Party |
Candidate |
Votes |
% |
±% |
|
Conservative |
Elizabeth Mallinson |
1,116 |
58.4 |
-4.3 |
|
Labour |
Steven Bowditch |
510 |
26.7 |
-10.6 |
|
Independent |
Richard Hunt |
286 |
15.0 |
+15.0 |
| Majority |
606 |
31.7 |
+6.2 |
| Turnout |
1,912 |
40.7 |
-10.2 |
|
Conservative hold |
Swing |
|
|
| Yewdale[8][11] |
| Party |
Candidate |
Votes |
% |
±% |
|
Labour |
George Stothard |
797 |
42.5 |
-8.4 |
|
Conservative |
Gareth Ellis |
750 |
40.0 |
-9.1 |
|
Liberal Democrat |
Eileen Aldersey |
327 |
17.4 |
+17.4 |
| Majority |
47 |
2.5 |
+0.8 |
| Turnout |
1,874 |
38.2 |
-4.4 |
|
Labour hold |
Swing |
|
|
References