Carlisle City Council election, 2004

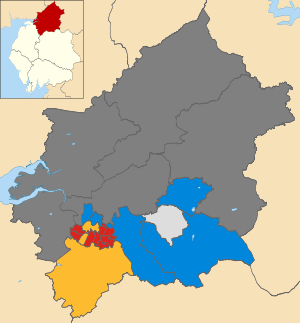
Map of the results of the 2004 Carlisle City Council election.
Labour in red,
Conservatives in blue, Liberal Democrats in yellow and independent in light grey. Wards in dark grey were not contested in 2004.
The 2004 Carlisle City Council election took place on 10 June 2004 to elect members of Carlisle District Council in Cumbria, England. One third of the council was up for election and the council stayed under no overall control.[1]
After the election, the composition of the council was
Election result
Labour became the largest party on the council with 24 councillors, but without a majority, after gaining 3 seats from the Conservatives in Belle Vue, St Aidans and Yewdale.[3][4] However Labour did lose one seat to the Liberal Democrats in Castle, with the Liberal Democrats also gaining a seat from the Conservatives in Dalston by 1 vote.[3][4] This meant the Conservatives dropped to 20 seats, while the Liberal Democrats went up to 7 and there remained 1 independent.[4] Overall turnout at the election was 42.6%, up from 31.4% in 2003.[5]
Following the election the Liberal Democrats continued to back the Conservatives to run the council, with Mike Mitchelson remaining as leader of the council.[6]
| Carlisle local election result 2004[2][5] |
| Party |
Seats |
Gains |
Losses |
Net gain/loss |
Seats % |
Votes % |
Votes |
+/− |
| |
Labour |
8 |
3 |
1 |
+2 |
47.1 |
38.0 |
10,957 |
-6.1% |
| |
Conservative |
5 |
0 |
4 |
-4 |
29.4 |
41.1 |
11,844 |
+0.0% |
| |
Liberal Democrat |
3 |
2 |
0 |
+2 |
17.6 |
15.7 |
4,526 |
+1.1% |
| |
Independent |
1 |
0 |
0 |
0 |
5.9 |
4.5 |
1,293 |
+4.2% |
| |
Green |
0 |
0 |
0 |
0 |
0 |
0.8 |
220 |
+0.8% |
Ward results
| Castle[5] |
| Party |
Candidate |
Votes |
% |
±% |
|
Liberal Democrat |
James Tootle |
917 |
62.9 |
+5.3 |
|
Labour |
Steven Bowditch |
541 |
37.1 |
-5.3 |
| Majority |
376 |
25.8 |
+10.5 |
| Turnout |
1,458 |
35.7 |
+11.0 |
|
Liberal Democrat gain from Labour |
Swing |
|
|
| Currock[5] |
| Party |
Candidate |
Votes |
% |
±% |
|
Labour |
Colin Glover |
865 |
57.5 |
-15.1 |
|
Conservative |
James Bainbridge |
400 |
26.6 |
-0.8 |
|
Liberal Democrat |
Eileen Aldersey |
240 |
15.9 |
+15.9 |
| Majority |
465 |
30.9 |
-14.2 |
| Turnout |
1,505 |
34.6 |
+11.5 |
|
Labour hold |
Swing |
|
|
| Dalston[5] |
| Party |
Candidate |
Votes |
% |
±% |
|
Liberal Democrat |
Trevor Allison |
1,048 |
43.6 |
+5.5 |
|
Conservative |
Ann McKerrell |
1,047 |
43.5 |
-2.0 |
|
Labour |
Ann Warwick |
310 |
12.9 |
-3.5 |
| Majority |
1 |
0.0 |
|
| Turnout |
2,405 |
54.1 |
+13.7 |
|
Liberal Democrat gain from Conservative |
Swing |
|
|
| Harraby[5] |
| Party |
Candidate |
Votes |
% |
±% |
|
Labour |
Carole Rutherford |
792 |
47.6 |
-19.7 |
|
Conservative |
Michele Gwillim |
590 |
35.5 |
+10.9 |
|
Liberal Democrat |
Olwyn Luckley |
282 |
16.9 |
+8.8 |
| Majority |
202 |
12.1 |
-30.6 |
| Turnout |
1,664 |
37.6 |
+9.3 |
|
Labour hold |
Swing |
|
|
| Hayton[5] |
| Party |
Candidate |
Votes |
% |
±% |
|
Independent |
William Graham |
778 |
83.5 |
|
|
Conservative |
Teresa Cartner |
154 |
16.5 |
|
| Majority |
624 |
67.0 |
|
| Turnout |
932 |
57.4 |
|
|
Independent hold |
Swing |
|
|
| Morton[5] |
| Party |
Candidate |
Votes |
% |
±% |
|
Liberal Democrat |
Hannah Farmer |
1,245 |
55.6 |
+5.3 |
|
Labour |
John Bell |
995 |
44.4 |
-5.3 |
| Majority |
250 |
11.2 |
+10.6 |
| Turnout |
2,240 |
47.0 |
+7.3 |
|
Liberal Democrat hold |
Swing |
|
|
| Upperby[5] |
| Party |
Candidate |
Votes |
% |
±% |
|
Labour |
Caroline Watson |
706 |
45.6 |
-18.2 |
|
Conservative |
Nicola Clarke |
397 |
25.6 |
+3.1 |
|
Liberal Democrat |
James Osler |
262 |
16.9 |
+3.1 |
|
Independent |
Denis Devlin |
184 |
11.9 |
+11.9 |
| Majority |
309 |
19.9 |
-21.4 |
| Turnout |
1,549 |
38.6 |
+8.4 |
|
Labour hold |
Swing |
|
|
By-elections between 2004 and 2006
A by-election was held on 24 November 2005 in Castle ward after the death of the Liberal Democrat group leader John Guest.[7] Olwyn Luckley held the seat for the Liberal Democrats, who continued to hold the balance of power on the council.[7]
| Castle by-election 24 November 2005[7] |
| Party |
Candidate |
Votes |
% |
±% |
|
Liberal Democrat |
Olwyn Luckley |
538 |
59.3 |
-3.6 |
|
Labour |
Jessica Riddle |
370 |
40.7 |
+3.6 |
| Majority |
168 |
18.6 |
-7.2 |
| Turnout |
908 |
22.0 |
-13.7 |
|
Liberal Democrat hold |
Swing |
|
|
References
