Carbon dioxide in Earth's atmosphere
|
2011 carbon dioxide mole fraction in the troposphere | |

Carbon dioxide (CO2) is an important long-lived trace gas in Earth's atmosphere currently constituting about 0.04% (400 parts per million) of the atmosphere. Due to human activities, the present concentration of CO2 in Earth's atmosphere is the highest in the past 800,000 years,[1] and likely the highest in the past 20 million years.[2] Despite its relatively small concentration, CO2 is a potent greenhouse gas and plays a vital role in regulating Earth's surface temperature through radiative forcing and the greenhouse effect.[3]
Carbon dioxide is essential to life on Earth and is an integral part of the carbon cycle, a biogeochemical cycle in which carbon is exchanged between the Earth's oceans, soil, rocks and biosphere. Plants and other photoautotrophs extract carbon from the atmosphere in the form of carbon dioxide by the process of photosynthesis and use it as an energy source and and a source of carbon compounds for the construction of their body parts. Therefore, the present biosphere of Earth could not exist without atmospheric CO2. Carbon dioxide is well mixed in the Earth's atmosphere and reconstructions show that concentrations of CO2 in the atmosphere have varied, ranging from as high as 7,000 parts per million during the Cambrian period about 500 million years ago in ancient-Earth biospheres to as low as 180 parts per million during the Quaternary glaciation of the last two million years.
The recent phenomenon of global warming has been attributed primarily to increasing industrial CO2 emissions into Earth's atmosphere. The global annual mean concentration of CO2 in the atmosphere has increased markedly since the Industrial Revolution, from 280 ppm to 400 ppm as of 2015.[4] The increase has been caused by anthropogenic sources, particularly the burning of fossil fuels and deforestation.[5] The daily average at Mauna Loa first exceeded 400 ppm on 10 May 2013.[6] It is currently rising at a rate of approximately 2 ppm/year and accelerating.[7][8] An estimated 30–40% of the CO2 released by humans into the atmosphere dissolves into oceans, rivers and lakes.[9][10] which contributes to ocean acidification.
Current concentration

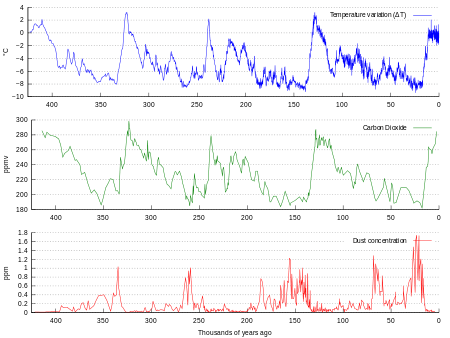
Over the past 400,000 years, CO2 concentrations have varied regularly from about 180 parts per million during the deep glaciations of the Holocene and Pleistocene to 280 parts per million during the interglacial periods. Following the start of the Industrial Revolution, atmospheric CO2 concentration has increased to 400 parts per million and continues to increase. This has caused the phenomenon of global warming which is mostly attributed to human CO2 emissions.[11]

The global average concentration of CO2 in Earth's atmosphere is currently about 0.0400%,[12] or 400 parts per million by volume (ppm).[7][13] There is an annual fluctuation of about 3–9 ppm which is negatively correlated with the Northern Hemisphere's growing season. The Northern Hemisphere dominates the annual cycle of CO2 concentration because it has much greater land area and plant biomass than the Southern Hemisphere. Concentrations reach a peak in May as the Northern Hemisphere spring greenup begins and decline to a minimum in October when the quantity of biomass undergoing photosynthesis is greatest.[14]
Because global warming is attributed primarily to increasing atmospheric CO2 concentrations, scientists closely monitor atmospheric CO2 concentrations and their impact on the present-day biosphere. At the scientific recording station in Mauna Loa, the concentration reached 400 ppm for the first time in May 2013,[6][15] although this level had already been reached in the Arctic in June 2012.[16] Sir Brian Hoskins of the Royal Society said that the 400 ppm milestone should "jolt governments into action."[17] The National Geographic noted that the concentration of carbon dioxide in the atmosphere is this high "for the first time in 55 years of measurement—and probably more than 3 million years of Earth history,"[18] and according to the global monitoring director at the National Oceanic and Atmospheric Administration's Earth System Research Lab, "it's just a reminder to everybody that we haven't fixed this, and we're still in trouble." The current concentration may be the highest in 20 million years.[2]
Past concentration

Carbon dioxide concentrations have varied widely over the Earth's 4.7 billion year history. Carbon dioxide is believed to have existed during Earth's first atmosphere which dates back to shortly after Earth's formation. Earth's second atmosphere emerged after the lighter gases, hydrogen and helium, escaped to space or like oxygen were bound up in molecules and is thought to have consisted largely of nitrogen, carbon dioxide and inert gases produced by outgassing from volcanism, supplemented by gases produced during the late heavy bombardment of Earth by huge asteroids. Cyanobacteria converted some of the carbon dioxide in the atmosphere to oxygen which eventually led to the oxygen catastrophe that ended Earth's second atmosphere and brought about the Earth's third atmosphere (the modern atmosphere) 2.4 billion years before the present. Carbon dioxide concentrations dropped from 7,000 parts per million during the Cambrian period about 500 million years ago to as low as 180 parts per million during the Quaternary glaciation of the last two million years.
Drivers of ancient-Earth carbon dioxide concentration
On long timescales, atmospheric CO2 concentration is determined by the balance among geochemical processes including organic carbon burial in sediments, silicate rock weathering, and volcanism. The net effect of slight imbalances in the carbon cycle over tens to hundreds of millions of years has been to reduce atmospheric CO2. On a timescale of billions of years, such downward trend appears bound to continue indefinitely as occasional massive historical releases of buried carbon due to volcanism will become less frequent (as earth mantle cooling and progressive exhaustion of internal radioactive heat proceeds further). The rates of these processes are extremely slow; hence they are of no relevance to the atmospheric CO2 concentration over the next hundreds, thousands, or millions of years.
In billion-year timescales, it is predicted that plant, and therefore animal, life on land will die off altogether, since by that time most of the remaining carbon in the atmosphere will be sequestered underground, and natural releases of CO2 by radioactivity-driven tectonic activity will have continued to slow down.[23] The loss of plant life would also result in the eventual loss of oxygen. Some microbes are capable of photosynthesis at concentrations of CO2 of a few parts per million and so the last life forms would probably disappear finally due to the rising temperatures and loss of the atmosphere when the sun becomes a red giant some four-billion years from now.[24]
Measuring ancient-Earth carbon dioxide concentration
Various proxy measurements have been used to attempt to determine atmospheric carbon dioxide concentrations millions of years in the past. These include boron and carbon isotope ratios in certain types of marine sediments, and the number of stomata observed on fossil plant leaves. While these measurements give much less precise estimates of carbon dioxide concentration than ice cores, there is evidence for very high CO2 volume concentrations between 200 and 150 million years ago of over 3,000 ppm, and between 600 and 400 million years ago of over 6,000 ppm.[2] In more recent times, atmospheric CO2 concentration continued to fall after about 60 million years ago. About 34 million years ago, the time of the Eocene–Oligocene extinction event and when the Antarctic ice sheet started to take its current form, CO2 is found to have been about 760 ppm,[25] and there is geochemical evidence that concentrations were less than 300 ppm by about 20 million years ago. Carbon dioxide decrease, with a tipping point of 600 ppm, was the primary agent forcing Antarctic glaciation.[26] Low CO2 concentrations may have been the stimulus that favored the evolution of C4 plants, which increased greatly in abundance between 7 and 5 million years ago.[27]
The most direct method for measuring atmospheric carbon dioxide concentrations for periods before direct sampling is to measure bubbles of air (fluid or gas inclusions) trapped in the Antarctic or Greenland ice sheets. The most widely accepted of such studies come from a variety of Antarctic cores and indicate that atmospheric CO2 concentrations were about 260–280 ppmv immediately before industrial emissions began and did not vary much from this level during the preceding 10,000 years. In 1832, Antarctic ice core levels were 284 ppmv.[28]
The longest ice core record comes from East Antarctica, where ice has been sampled to an age of 800,000 years.[1] During this time, the atmospheric carbon dioxide concentration has varied between 180–210 ppm during ice ages, increasing to 280–300 ppm during warmer interglacials.[29][30] The beginning of human agriculture during the current Holocene epoch may have been strongly connected to the atmospheric CO2 increase after the last ice age ended, a fertilization effect raising plant biomass growth and reducing stomatal conductance requirements for CO2 intake, consequently reducing transpiration water losses and increasing water usage efficiency.[31]
Ancient-Earth climate reconstruction is a vibrant field with numerous studies and reconstructions that sometimes reinforce one another and sometimes disagree with each other. Academically, one study disputed the claim of stable CO2 concentrations during the present interglacial of the last 10,000 years. Based on an analysis of fossil leaves, Wagner et al.[32] argued that CO2 levels during the last 7,000–10,000 year period were significantly higher (~300 ppm) and contained substantial variations that may be correlated to climate variations. Others have disputed such claims, suggesting they are more likely to reflect calibration problems than actual changes in CO2.[33] Relevant to this dispute is the observation that Greenland ice cores often report higher and more variable CO2 values than similar measurements in Antarctica. However, the groups responsible for such measurements (e.g. H. J Smith et al.[34]) believe the variations in Greenland cores result from in situ decomposition of calcium carbonate dust found in the ice. When dust concentrations in Greenland cores are low, as they nearly always are in Antarctic cores, the researchers report good agreement between measurements of Antarctic and Greenland CO2 concentrations.
Atmospheric carbon dioxide and the greenhouse effect

Earth’s natural greenhouse effect makes life as we know it possible and carbon dioxide plays a significant role in providing for the relatively warm temperature that the planet enjoys. The greenhouse effect is a process by which thermal radiation from a planetary surface warmed by sunlight is absorbed by atmospheric greenhouse gases, raising their temperature. The warmed gases re-radiate thermal radiation in all directions, the fraction directed back towards the surface thereby warming the surface and the lower atmosphere above the temperature they would have in the absence of the greenhouse gas.[35][36]
Carbon dioxide is believed to have played an important effect in regulating Earth's temperature throughout its 4.7 billion year history. Early in the Earth's life, scientists have found evidence of liquid water indicating a warm world even though the Sun's output is believed to have only been 70% of what it is today. It has been suggested by scientists that higher carbon dioxide concentrations in the early Earth atmosphere might help explain this faint young sun paradox. When Earth first formed, Earth's atmosphere may have contained more greenhouse gases and CO2 concentrations may have been higher, with estimated partial pressure as large as 1,000 kPa (10 bar), because there was no bacterial photosynthesis to reduce the gas to carbon compounds and oxygen. Methane, a very active greenhouse gas which reacts with oxygen to produce CO2 and water vapor, may have been more prevalent as well, with a mixing ratio of 10−4 (100 parts per million by volume).[37][38]
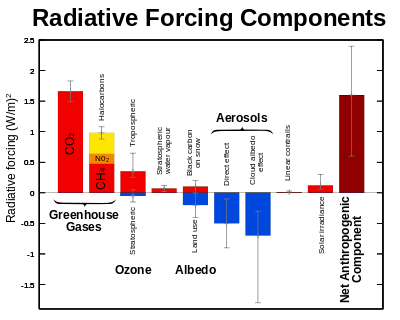
Today's contribution to the greenhouse effect on Earth by the four major gases are:[39][40]
- water vapor, 36–70%
- carbon dioxide, 9–26%
- methane, 4–9%
- ozone, 3–7%
The mechanism that produces this difference between the actual surface temperature and the effective temperature is due to the atmosphere and is known as the greenhouse effect.[41] Without the greenhouse effect, the Earth's temperature would be about −18 °C (-0.4 °F) .[42][43] The surface temperature would be 33 °C (57.6 °F) below Earth's actual surface temperature of approximately 14 °C (57.2 °F).[44]
Atmospheric carbon dioxide and the carbon cycle
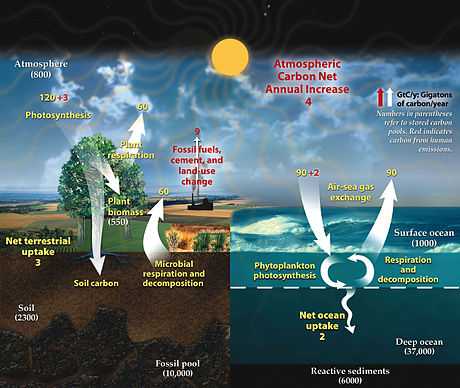
Atmospheric carbon dioxide plays an integral role in the Earth's carbon cycle whereby carbon dioxide is removed from the atmosphere by some natural processes and added back to the atmosphere by other natural processes. There are two broad carbon cycles on earth: the fast carbon cycle and the slow carbon cycle. The fast carbon cycle refers to movements of carbon between the environment and living things in the biosphere whereas the slow carbon cycle involves the movement of carbon between the atmosphere, oceans, soil, rocks and volcanism. Both carbon cycles are intrinsically interconnected and atmospheric gaseous carbon dioxide facilitates the carbon cycle.
Natural sources of atmospheric carbon dioxide include volcanic outgassing, the combustion of organic matter, wildfires and the respiration processes of living aerobic organisms. Man-made sources of carbon dioxide include the burning of fossil fuels for heating, power generation and transport, as well as some industrial processes such as cement making. It is also produced by various microorganisms from fermentation and cellular respiration. Plants, algae and cyanobacteria convert carbon dioxide to carbohydrates by a process called photosynthesis. They gain the energy needed for this reaction from absorption of sunlight by chlorophyll and other pigments. Oxygen, produced as a by-product of photosynthesis, is released into the atmosphere and subsequently used for respiration by heterotrophic organisms and other plants, forming a cycle.
Most sources of CO2 emissions are natural, and are balanced to various degrees by natural CO2 sinks. For example, the natural decay of organic material in forests and grasslands and the action of forest fires results in the release of about 439 gigatonnes of carbon dioxide every year, while new growth entirely counteracts this effect, absorbing 450 gigatonnes per year.[45] Although the initial carbon dioxide in the atmosphere of the young Earth was produced by volcanic activity, modern volcanic activity releases only 130 to 230 megatonnes of carbon dioxide each year.[46] These natural sources are nearly balanced by natural sinks, physical and biological processes which remove carbon dioxide from the atmosphere. For example, some is directly removed from the atmosphere by land plants for photosynthesis and it is soluble in water forming carbonic acid. There is a large natural flux of CO2 into and out of the biosphere and oceans.[47] In the pre-industrial era these fluxes were largely in balance. Currently about 57% of human-emitted CO2 is removed by the biosphere and oceans.[48][49] From pre-industrial era to 2010, the terrestrial biosphere represented a net source of atmospheric CO2 prior to 1940, switching subsequently to a net sink.[49] The ratio of the increase in atmospheric CO2 to emitted CO2 is known as the airborne fraction (Keeling et al., 1995); this varies for short-term averages and is typically about 45% over longer (5 year) periods.[49] Estimated carbon in global terrestrial vegetation increased from approximately 740 billion tons in 1910 to 780 billion tons in 1990.[50]
Atmospheric carbon dioxide and photosynthesis

Carbon dioxide in the Earth's atmosphere is essential to life and to the present planetary biosphere. Over the course of Earth's geologic history CO2 concentrations have played a role in biological evolution. The first photosynthetic organisms probably evolved early in the evolutionary history of life and most likely used reducing agents such as hydrogen or hydrogen sulfide as sources of electrons, rather than water.[51] Cyanobacteria appeared later, and the excess oxygen they produced contributed to the oxygen catastrophe,[52] which rendered the evolution of complex life possible. In recent geologic times, low CO2 concentrations below 600 parts per million might have been the stimulus that favored the evolution of C4 plants which increased greatly in abundance between 7 and 5 million years ago over plants that use the less efficient C3 metabolic pathway.[27] At current atmospheric pressures photosynthesis shuts down when atmospheric CO2 concentrations fall below 150 ppm and 200 ppm although some microbes can extract carbon from the air at much lower concentrations.[53][54] Today, the average rate of energy capture by photosynthesis globally is approximately 130 terawatts,[55][56][57] which is about six times larger than the current power consumption of human civilization.[58] Photosynthetic organisms also convert around 100–115 thousand million metric tonnes of carbon into biomass per year.[59][60]
Photosynthetic organisms are photoautotrophs, which means that they are able to synthesize food directly from CO2 and water using energy from light. However, not all organisms that use light as a source of energy carry out photosynthesis, since photoheterotrophs use organic compounds, rather than CO2, as a source of carbon.[61] In plants, algae and cyanobacteria, photosynthesis releases oxygen. This is called oxygenic photosynthesis. Although there are some differences between oxygenic photosynthesis in plants, algae, and cyanobacteria, the overall process is quite similar in these organisms. However, there are some types of bacteria that carry out anoxygenic photosynthesis, which consumes CO2 but does not release oxygen.
Carbon dioxide is converted into sugars in a process called carbon fixation. Carbon fixation is an endothermic redox reaction, so photosynthesis needs to supply both a source of energy to drive this process, and the electrons needed to convert CO2 into a carbohydrate. This addition of the electrons is a reduction reaction. In general outline and in effect, photosynthesis is the opposite of cellular respiration, in which glucose and other compounds are oxidized to produce CO2 and water, and to release exothermic chemical energy to drive the organism's metabolism. However, the two processes take place through a different sequence of chemical reactions and in different cellular compartments.
Most organisms that utilize photosynthesis to produce oxygen use visible light to do so, although at least three use shortwave infrared or, more specifically, far-red radiation.[62]
Atmospheric carbon dioxide and the oceanic carbon cycle

The Earth's oceans contain a large amount of CO2 in the form of bicarbonate and carbonate ions — much more than the amount in the atmosphere. The bicarbonate is produced in reactions between rock, water, and carbon dioxide. One example is the dissolution of calcium carbonate:
- CaCO
3 + CO2 + H
2O ⇌ Ca2+
+ 2 HCO−
3
Reactions like this tend to buffer changes in atmospheric CO2. Since the right side of the reaction produces an acidic compound, adding CO2 on the left side decreases the pH of sea water, a process which has been termed ocean acidification (pH of the ocean becomes more acidic although the pH value remains in the alkaline range). Reactions between CO2 and non-carbonate rocks also add bicarbonate to the seas. This can later undergo the reverse of the above reaction to form carbonate rocks, releasing half of the bicarbonate as CO2. Over hundreds of millions of years, this has produced huge quantities of carbonate rocks.
Ultimately, most of the CO2 emitted by human activities will dissolve in the ocean;[63] however, the rate at which the ocean will take it up in the future is less certain. Even if equilibrium is reached, including dissolution of carbonate minerals, the increased concentration of bicarbonate and decreased or unchanged concentration of carbonate ion will give rise to a higher concentration of un-ionized carbonic acid and dissolved CO2. This, along with higher temperatures, would mean a higher equilibrium concentration of CO2 in the air.
Atmospheric carbon dioxide and global warming
The recent phenomenon of global warming has been attributed primarily to increasing atmospheric carbon dioxide concentrations in Earth's atmosphere. While CO2 absorption and release is always happening as a result of natural processes, the recent rise in CO2 levels in the atmosphere is known to be mainly due to human activity.[66] Researchers know this both by calculating the amount released based on various national statistics, and by examining the ratio of various carbon isotopes in the atmosphere,[66] as the burning of long-buried fossil fuels releases CO2 containing carbon of different isotopic ratios to those of living plants, enabling them to distinguish between natural and human-caused contributions to CO2 concentration.
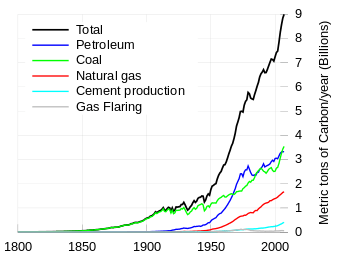
Burning fossil fuels such as coal and petroleum is the leading cause of increased anthropogenic CO2; deforestation is the second major cause. In 2010, 9.14 gigatonnes of carbon (33.5 gigatonnes of CO2) were released from fossil fuels and cement production worldwide, compared to 6.15 gigatonnes in 1990.[67] In addition, land use change contributed 0.87 gigatonnes in 2010, compared to 1.45 gigatonnes in 1990.[67] In 1997, human-caused Indonesian peat fires were estimated to have released between 13% and 40% of the average carbon emissions caused by the burning of fossil fuels around the world in a single year.[68][69][70] In the period 1751 to 1900, about 12 gigatonnes of carbon were released as carbon dioxide to the atmosphere from burning of fossil fuels, whereas from 1901 to 2008 the figure was about 334 gigatonnes.[71]
This addition, about 3% of annual natural emissions, as of 1997, is sufficient to exceed the balancing effect of sinks.[72] As a result, carbon dioxide has gradually accumulated in the atmosphere, and as of 2013, its concentration is almost 43% above pre-industrial levels.[6][15] Various techniques have been proposed for removing excess carbon dioxide from the atmosphere in carbon dioxide sinks.
Carbon dioxide has unique long-term effects on climate change that are largely "irreversible" for one thousand years after emissions stop (zero further emissions) even though carbon dioxide tends toward equilibrium with the ocean on a scale of 100 years. The greenhouse gases methane and nitrous oxide do not persist over time in the same way as carbon dioxide. Even if human carbon dioxide emissions were to completely cease, atmospheric temperatures are not expected to decrease significantly in the short term.[73][74][75][76]
-
Global fossil carbon emissions 1800–2007.
-
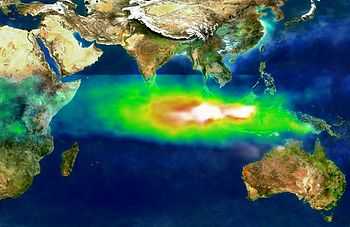
False-color image of smoke and ozone pollution from Indonesian fires, 1997.
-

Biosphere CO2 flux in the northern hemisphere summer (NOAA Carbon Tracker).
-

Biosphere CO2 flux in the northern hemisphere winter (NOAA Carbon Tracker).
See also
- global warming
- climate change
- Holocene climatic optimum
- Paleoclimatology
- carbon cycle
- photosynthesis
- Atmospheric carbon cycle
Notes
References
- ↑ 1.0 1.1 Amos, Jonathan (2006-09-04). "Deep ice tells long climate story". BBC News. Retrieved 2010-04-28.
- ↑ 2.0 2.1 2.2 Climate Change 2001: The Scientific Basis
- ↑ Petty, G.W. (2004). A First Course in Atmospheric Radiation. Sundog Publishing. pp. 229–251. CO2 absorbs and emits infrared radiation at wavelengths of 4.26 µm (asymmetric stretching vibrational mode) and 14.99 µm (bending vibrational mode).
- ↑ NOAA/ESRL. "Annual Mean Carbon Dioxide Data". NOAA/ESRL.
- ↑ Etheridge, D. M.; L. P. Steele, R. L. Langenfelds, R. J. Francey, J.-M. Barnola, V. I. Morgan (1996). "Natural and anthropogenic changes in atmospheric CO2 over the last 1000 years from air in Antarctic ice and firn". Journal of Geophysical Research 101 (D2): 4115–4128. Bibcode:1996JGR...101.4115E. doi:10.1029/95JD03410. ISSN 0148-0227.
- ↑ 6.0 6.1 6.2 "Carbon dioxide passes symbolic mark". BBC. 10 May 2013. Retrieved 10 May 2013.
- ↑ 7.0 7.1 Tans, Pieter. "Trends in Carbon Dioxide". NOAA/ESRL. Retrieved 2009-12-11.
- ↑ Carbon Budget 2009 Highlights, globalcarbonproject.org, retrieved 2012-11-02
- ↑ Millero, Frank J. (1995). "Thermodynamics of the carbon dioxide system in the oceans". Geochimica et Cosmochimica Acta 59 (4): 661–677. Bibcode:1995GeCoA..59..661M. doi:10.1016/0016-7037(94)00354-O.
- ↑ Feely, R. A.; et al. (July 2004). "Impact of Anthropogenic CO2 on the CaCO3 System in the Oceans". Science 305 (5682): 362–366. Bibcode:2004Sci...305..362F. doi:10.1126/science.1097329. PMID 15256664.
- ↑ IPCC AR5 WG1 (2013), Stocker, T.F. et al., eds., Climate Change 2013: The Physical Science Basis. Working Group 1 (WG1) Contribution to the Intergovernmental Panel on Climate Change (IPCC) 5th Assessment Report (AR5), Cambridge University Press Climate Change 2013 Working Group 1 website.
- ↑ Earth System Research Laboratory Pablo es lindo Global Monitoring Division>"Trends in Atmospheric Carbon Dioxide".
- ↑ "Current atmospheric CO2 concentration at http://co2unting.com".
- ↑ "Frequently Asked Questions". Carbon Dioxide Information Analysis Center (CDIAC).
- ↑ 15.0 15.1 "Up-to-date weekly average CO2 at Mauna Loa". NOAA. Retrieved 2013-05-11.
- ↑ "Greenhouse gas levels pass symbolic 400ppm CO2 milestone". The Guardian. 1 June 2012. Retrieved 11 May 2013.
- ↑ "Scientists call for action to tackle CO2 levels". BBC News. 2013-05-11. Retrieved 2013-05-12.
- ↑ Kunzig, Robert (2013-05-09). "Climate Milestone: Earth’s CO2 Level Passes 400 ppm". National Geographic. Retrieved 2013-05-12.
- ↑ Royer, Dana L. (2006). "CO2-forced climate thresholds during the Phanerozoic" (PDF). Geochimica et Cosmochimica Acta 70 (23): 5665–75. Bibcode:2006GeCoA..70.5665R. doi:10.1016/j.gca.2005.11.031.
- ↑ Guinan; Ribas (2002). "Our Changing Sun: The Role of Solar Nuclear Evolution and Magnetic Activity on Earth's Atmosphere and Climate". In Montesinos, Benjamin; Gimenez, Alvaro; Guinan, Edward F. The Evolving Sun and its Influence on Planetary Environments. ASP Conference Proceedings 269. San Francisco: Astronomical Society of the Pacific. p. 85. ISBN 1-58381-109-5.
- ↑ Beerling, David (2008). The Emerald Planet: How Plants Changed Earth's History. Oxford University Press. ISBN 9780199548149.
- ↑ Foellmi, K.B. (2012). "Early Cretaceous life, climate and anoxia". Cretaceous Research 33: 230–257. doi:10.1016/j.cretres.2011.12.005.
- ↑ Ward, Peter Douglas; Brownlee, Donald (2003). The life and death of planet Earth. Macmillan. pp. 117–128. ISBN 0-8050-7512-7.
- ↑ Caldeira, Ken; Kasting, James F. (December 1992). "The life span of the biosphere revisited". Nature 360 (6406): 721–3. Bibcode:1992Natur.360..721C. doi:10.1038/360721a0. PMID 11536510.
- ↑ "New CO2 data helps unlock the secrets of Antarctic formation". Physorg.com. 13 September 2009.
- ↑ "Drop in carbon dioxide levels led to polar ice sheet, study finds". Sciencedaily.com. 2 December 2011. doi:10.1126/science.1203909. Retrieved 14 May 2013.
- ↑ 27.0 27.1 Osborne, C. P.; Beerling, D. J. (2006). "Nature's green revolution: the remarkable evolutionary rise of C4 plants". Philosophical Transactions of the Royal Society B: Biological Sciences 361 (1465): 173–194. doi:10.1098/rstb.2005.1737. PMC 1626541. PMID 16553316.
- ↑ "Historical CO2 record derived from a spline fit (20 year cutoff) of the Law Dome DE08 and DE08-2 ice cores". Retrieved 2007-06-12.
- ↑ Hileman B (November 2005). "Ice Core Record Extended: Analyses of trapped air show current CO2 at highest level in 650,000 years". Chemical & Engineering News 83 (48): 7. ISSN 0009-2347.
- ↑ Vostok Ice Core Data, ncdc.noaa.gov
- ↑ Richerson PJ, Boyd R, Bettinger RL (July 2001). "Was Agriculture Impossible During The Pleistocene But Mandatory During The Holocene?" (PDF). American Antiquity 66 (3): 387–411. doi:10.2307/2694241. JSTOR 2694241.
- ↑ Wagner, Friederike; Bent Aaby and Henk Visscher (2002). "Rapid atmospheric O
2 changes associated with the 8,200-years-B.P. cooling event". Proc. Natl. Acad. Sci. U.S.A. 99 (19): 12011–4. Bibcode:2002PNAS...9912011W. doi:10.1073/pnas.182420699. PMC 129389. PMID 12202744. - ↑ Indermühle, Andreas; Bernhard Stauffer; Thomas F. Stocker (1999). "Early Holocene Atmospheric CO2 Concentrations". Science 286 (5446): 1815. doi:10.1126/science.286.5446.1815a.
- ↑ Smith, H.J.; M Wahlen and D. Mastroianni (1997). "The CO2 concentration of air trapped in GISP2 ice from the Last Glacial Maximum-Holocene transition". Geophysical Research Letters 24 (1): 1–4. Bibcode:1997GeoRL..24....1S. doi:10.1029/96GL03700.
- ↑ "Annex II Glossary". Intergovernmental Panel on Climate Change. Retrieved 15 October 2010.
- ↑ A concise description of the greenhouse effect is given in the Intergovernmental Panel on Climate Change Fourth Assessment Report, "What is the Greenhouse Effect?" FAQ 1.3 - AR4 WGI Chapter 1: Historical Overview of Climate Change Science, IIPCC Fourth Assessment Report, Chapter 1, page 115: "To balance the absorbed incoming [solar] energy, the Earth must, on average, radiate the same amount of energy back to space. Because the Earth is much colder than the Sun, it radiates at much longer wavelengths, primarily in the infrared part of the spectrum (see Figure 1). Much of this thermal radiation emitted by the land and ocean is absorbed by the atmosphere, including clouds, and reradiated back to Earth. This is called the greenhouse effect."
Stephen H. Schneider, in Geosphere-biosphere Interactions and Climate, Lennart O. Bengtsson and Claus U. Hammer, eds., Cambridge University Press, 2001, ISBN 0-521-78238-4, pp. 90-91.
E. Claussen, V. A. Cochran, and D. P. Davis, Climate Change: Science, Strategies, & Solutions, University of Michigan, 2001. p. 373.
A. Allaby and M. Allaby, A Dictionary of Earth Sciences, Oxford University Press, 1999, ISBN 0-19-280079-5, p. 244. - ↑ Walker, James C. G. (June 1985). "Carbon dioxide on the early earth" (PDF). Origins of Life and Evolution of the Biosphere 16 (2): 117–127. Bibcode:1985OLEB...16..117W. doi:10.1007/BF01809466. Retrieved 2010-01-30.
- ↑ Pavlov, Alexander A.; Kasting, James F.; Brown, Lisa L.; Rages, Kathy A.; Freedman, Richard (May 2000). "Greenhouse warming by CH4 in the atmosphere of early Earth". Journal of Geophysical Research 105 (E5): 11981–11990. Bibcode:2000JGR...10511981P. doi:10.1029/1999JE001134.
- ↑ "Water vapour: feedback or forcing?". RealClimate. 6 April 2005. Retrieved 2006-05-01.
- ↑ Kiehl, J.T.; Kevin E. Trenberth (1997). "Earth's annual global mean energy budget" (PDF). Bulletin of the American Meteorological Society 78 (2): 197–208. Bibcode:1997BAMS...78..197K. doi:10.1175/1520-0477(1997)078<0197:EAGMEB>2.0.CO;2. Archived from the original (PDF) on 30 March 2006. Retrieved 1 May 2006.
- ↑ Vaclav Smil (2003). The Earth's Biosphere: Evolution, Dynamics, and Change. MIT Press. p. 107. ISBN 978-0-262-69298-4.
- ↑ "Solar Radiation and the Earth's Energy Balance". Eesc.columbia.edu. Retrieved 2010-10-15.
- ↑ Intergovernmental Panel on Climate Change Fourth Assessment Report. Chapter 1: Historical overview of climate change science page 97
- ↑ The elusive "absolute surface air temperature," see GISS discussion
- ↑ "IPCC Fourth Assessment Report: Climate Change 2007 (AR4)". Intergovernmental Panel on Climate Change. Retrieved 2013-05-12.
- ↑ Gerlach, T.M. (4 June 1991). "Present-day CO2 emissions from volcanoes". Eos, Transactions, American Geophysical Union (American Geophysical Union) 72 (23): 249, 254–5. Bibcode:1991EOSTr..72..249.. doi:10.1029/90EO10192.
- ↑ Cappelluti, G.; Bösch, H.; Monks, P.S. (2009). Use of remote sensing techniques for the detection and monitoring of GHG emissions from the Scottish land use sector. Scottish Government. ISBN 978-0-7559-7738-3.
- ↑ Canadell JG, Le Quéré C, Raupach MR et al. (November 2007). "Contributions to accelerating atmospheric CO2 growth from economic activity, carbon intensity, and efficiency of natural sinks". Proc. Natl. Acad. Sci. U.S.A. 104 (47): 18866–70. Bibcode:2007PNAS..10418866C. doi:10.1073/pnas.0702737104. PMC 2141868. PMID 17962418.
- ↑ 49.0 49.1 49.2 Junling Huang and Michael B. McElroy (2012). "The Contemporary and Historical Budget of Atmospheric CO2" (PDF). Canadian Journal of Physics. 90(8): 707–716.
- ↑ Post WM, King AW, Wullschleger SD, Hoffman FM; King; Wullschleger (June 1997). "Historical Variations in Terrestrial Biospheric Carbon Storage". DOE Research Summary (CDIAC, U.S. Department of Energy) 34: 99. Bibcode:1997GBioC..11...99P. doi:10.1029/96GB03942.
- ↑ Olson JM (May 2006). "Photosynthesis in the Archean era". Photosyn. Res. 88 (2): 109–17. doi:10.1007/s11120-006-9040-5. PMID 16453059.
- ↑ Buick R (August 2008). "When did oxygenic photosynthesis evolve?". Philos. Trans. R. Soc. Lond., B, Biol. Sci. 363 (1504): 2731–43. doi:10.1098/rstb.2008.0041. PMC 2606769. PMID 18468984.
- ↑ "Gaia as seen through the atmosphere". Retrieved 20014-03-22. Check date values in:
|accessdate=(help) - ↑ "Atmospheric pressure as a natural climate regulator for a terrestrial planet with a biosphere" (PDF). Retrieved 20014-03-22. Check date values in:
|accessdate=(help) - ↑ Nealson KH, Conrad PG (December 1999). "Life: past, present and future". Philos. Trans. R. Soc. Lond., B, Biol. Sci. 354 (1392): 1923–39. doi:10.1098/rstb.1999.0532. PMC 1692713. PMID 10670014.
- ↑ Whitmarsh J, Govindjee (1999). "The photosynthetic process". In Singhal GS, Renger G, Sopory SK, Irrgang KD, Govindjee. Concepts in photobiology: photosynthesis and photomorphogenesis. Boston: Kluwer Academic Publishers. pp. 11–51. ISBN 0-7923-5519-9.
100 x 1015 grams of carbon/year fixed by photosynthetic organisms which is equivalent to 4 x 10¹⁸ kJ/yr = 4 x 10²¹J/yr of free energy stored as reduced carbon; (4 x 10¹⁸ kJ/yr) / (31,556,900 sec/yr) = 1.27 x 10¹⁴ J/yr; (1.27 x 10¹⁴ J/yr) / (1012 J/sec / TW) = 127 TW.
- ↑ Steger U, Achterberg W, Blok K, Bode H, Frenz W, Gather C, Hanekamp G, Imboden D, Jahnke M, Kost M, Kurz R, Nutzinger HG, Ziesemer T (2005). Sustainable development and innovation in the energy sector. Berlin: Springer. p. 32. ISBN 3-540-23103-X.
The average global rate of photosynthesis is 130 TW (1 TW = 1 terawatt = 1012 watt).
- ↑ "World Consumption of Primary Energy by Energy Type and Selected Country Groups, 1980–2004" (XLS). Energy Information Administration. 31 July 2006. Retrieved 2007-01-20.
- ↑ Field CB, Behrenfeld MJ, Randerson JT, Falkowski P (July 1998). "Primary production of the biosphere: integrating terrestrial and oceanic components". Science 281 (5374): 237–40. Bibcode:1998Sci...281..237F. doi:10.1126/science.281.5374.237. PMID 9657713.
- ↑ "Photosynthesis". McGraw-Hill Encyclopedia of Science & Technology 13. New York: McGraw-Hill. 2007. ISBN 0-07-144143-3.
- ↑ Bryant DA, Frigaard NU (November 2006). "Prokaryotic photosynthesis and phototrophy illuminated". Trends Microbiol. 14 (11): 488–96. doi:10.1016/j.tim.2006.09.001. PMID 16997562.
- ↑ "Scientists discover unique microbe in California's largest lake". Retrieved 2009-07-20.
- ↑ Archer, D. (2005). "Fate of fossil fuel CO2 in geologic time". J. Geophys. Res. 110. Bibcode:2005JGRC..11009S05A. doi:10.1029/2004JC002625.
- ↑ 64.0 64.1 IPCC, Summary for Policymakers, Human and Natural Drivers of Climate Change, Figure SPM.2, in IPCC AR4 WG1 2007.
- ↑ US Environmental Protection Agency (2009). "3.2.2 Solar Irradiance". Volume 3: Attribution of Observed Climate Change. Endangerment and Cause or Contribute Findings for Greenhouse Gases under Section 202(a) of the Clean Air Act. EPA's Response to Public Comments. US Environmental Protection Agency. Archived from the original on 16 June 2011. Retrieved 2011-06-23.
- ↑ 66.0 66.1 e.g. Gosh, Prosenjit; Brand, Willi A. (2003). "Stable isotope ratio mass spectrometry in global climate change research" (PDF). International Journal of Mass Spectrometry 228: 1–33. doi:10.1016/S1387-3806(03)00289-6.
Global change issues have become significant due to the sustained rise in atmospheric trace gas concentrations (CO2, N
2O, CH
4) over recent years, attributable to the increased per capita energy consumption of a growing global population. - ↑ 67.0 67.1 G.P. Peters et al. Global carbon budget 2010 (summary), Tyndall Centre for Climate Change Research
- ↑ Page, S.; Siegert, F.; Rieley, J.; Boehm, H.; Jaya, A.; Limin, S. (2002). "The amount of carbon released from peat and forest fires in Indonesia during 1997.". Nature 420 (6911): 61–65. doi:10.1038/nature01131. PMID 12422213.
- ↑ Lazaroff, Cat (2002-11-08). "Indonesian Wildfires Accelerated Global Warming". Environment New Service. Retrieved 2011-11-07.
- ↑ Pearce, Fred (6 November 2004). "Massive peat burn is speeding climate change". New Scientist.
- ↑ Calculated from file global.1751_2008.csv in from the Carbon Dioxide Information Analysis Center.
- ↑ US Global Change Research Information Office, "Common Questions about Climate Change"
- ↑ Solomon S, Plattner GK, Knutti R, Friedlingstein P (February 2009). "Irreversible climate change due to carbon dioxide emissions". Proc. Natl. Acad. Sci. U.S.A. 106 (6): 1704–9. Bibcode:2009PNAS..106.1704S. doi:10.1073/pnas.0812721106. PMC 2632717. PMID 19179281.
- ↑ "2010 in the top three warmest years, 2001–2010 warmest 10-year period". WMO statement on the global climate in 2010. World Meteorological Organization. 2010. Retrieved 2011-11-07.
- ↑ Cohen, Judah (2010-12-25). "Bundle Up, It's Global Warming". The New York Times.
- ↑ Carrington, Damian (2011-07-04). "Sulphur from Chinese power stations 'masking' climate change". The Guardian (London).
External links
- NASA Computer Model Provides a New Portrait of Carbon Dioxide | NASA (17 November 2012)