Canadian federal election results in Newfoundland and Labrador
| Electoral history | |||||||||||||||
|---|---|---|---|---|---|---|---|---|---|---|---|---|---|---|---|
| 2011 |
| ||||||||||||||
| 2008 |
| ||||||||||||||
| 2006 |
| ||||||||||||||
| 2004 |
| ||||||||||||||
| 2000 |
| ||||||||||||||
| 1997 |
| ||||||||||||||
| 1993 |
| ||||||||||||||
| 1988 |
| ||||||||||||||
| 1984 |
| ||||||||||||||
| 1980 |
| ||||||||||||||
| 1979 |
| ||||||||||||||
| 1974 |
| ||||||||||||||
| 1974 |
| ||||||||||||||
| 1972 |
| ||||||||||||||
| 1968 |
| ||||||||||||||
Canadian federal elections have provided the following results in Newfoundland and Labrador.
Regional profile
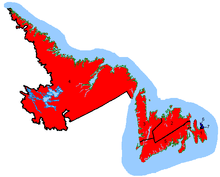
Newfoundland and Labrador has been a Liberal heartland since it joined Canada in 1949, with only the city of St. John's electing Progressive Conservatives on a relatively consistent basis, and that support has transferred over to the current Conservatives. Even in the 1984 Mulroney landslide, more rural and remote seats went Liberal than PC. The Conservatives picked up one seat in the 2006 election, but the Liberals still hold a majority of the seats. Party preference here has a lot to do with religion, where Catholics tend to vote Conservative and Protestants Liberal (contrary to the rest of the country). In 2008, the Anything But Conservative movement took hold here and the Conservatives lost all their seats to the Liberals and NDP. In the 2011 election, Newfoundland and Labrador was the only province to have the Liberals win in terms of popular vote. They however did lose 2 seats, 1 to the Tories and one to the NDP. The final count is Liberals: 4, NDP: 2, Conservative: 1
2011 - 41st General Election
| Electoral District | Candidates | Incumbent | ||||||||||
|---|---|---|---|---|---|---|---|---|---|---|---|---|
| Conservative | Liberal | NDP | Green | Other | ||||||||
| Avalon | Fabian Manning
14,839 |
Scott Andrews
16,021 |
Matthew Martin Fuchs
5,172 |
Matt Crowder
217 |
Randy Wayne Dawe (Ind.)
277 |
Scott Andrews | ||||||
| Bonavista—Gander— Grand Falls—Windsor |
Aaron Hynes
8,511 |
Scott Simms
17,895 |
Clyde Bridger
4,277 |
Robyn Kenny
276 |
Scott Simms | |||||||
| Humber—St. Barbe— Baie Verte |
Trevor Taylor
7,519 |
Gerry Byrne
17,119 |
Shelley Senior
4,751 |
Robin Blair Gosse
253 |
Wayne R. Bennett (Ind.)
332 |
Gerry Byrne | ||||||
| Labrador | Peter Penashue
4,234 |
Todd Russell
4,003 |
Jacob Larkin
2,099 |
George C.R. Barrett
136 |
Todd Russell | |||||||
| Random—Burin— St. George's |
John Ottenheimer
8,322 |
Judy Foote
12,914 |
Stella Magalios
4,466 |
Tanya Gutmanis
306 |
Judy Foote | |||||||
| St. John's East | Jerry Byrne
9,199 |
John Allan
3,019 |
Jack Harris
31,392 |
Robert Miller
467 |
Jack Harris | |||||||
| St. John's South— Mount Pearl |
Loyola Sullivan
8,863 |
Siobhán Coady
11,131 |
Ryan Cleary
18,573 |
Rick Austin
291 |
Siobhán Coady | |||||||
2008 - 40th General Election
| Electoral District | Candidates | Incumbent | ||||||||||
|---|---|---|---|---|---|---|---|---|---|---|---|---|
| Conservative | Liberal | NDP | Green | Other | ||||||||
| Avalon | Fabian Manning
11,542 |
Scott Andrews
14,866 |
Randy Dawe
5,708 |
David Aylward
713 |
Fabian Manning | |||||||
| Bonavista— Gander— Grand Falls— Windsor |
Andrew House
4,354 |
Scott Simms
20,089 |
Jason Holley
3,577 |
Robert O'Connor
568 |
Scott Simms | |||||||
| Humber— St. Barbe— Baie Verte |
Lorne Robinson
2,806 |
Gerry Byrne
17,943 |
Mark Kennedy
4,703 |
Wayne Ronald Bennett (NLFP)
967 |
Gerry Byrne | |||||||
| Labrador | Lacey Lewis
615 |
Todd Russell
5,426 |
Phyllis Artiss
1,378 |
Nyssa McLeod
302 |
Todd Russell | |||||||
| Random— Burin— St. George's |
Herb Davis
4,791 |
Judy Foote
12,557 |
Terry White
5,553 |
Kaitlin Wainwright
462 |
Bill Matthews† | |||||||
| St. John's East | Craig Westcott
3,872 |
Walter Noel
5,273 |
Jack Harris
31,369 |
Howard Storey
586 |
Shannon Tobin (PC) 584 Les Coultas (NLFP) 349 |
Norman Doyle† | ||||||
| St. John's South— Mount Pearl |
Merv Wiseman
4,324 |
Siobhán Coady
14,930 |
Ryan Cleary
13,883 |
Ted Warren
643 |
Greg Byrne (NLFP) 485 Terry Butler (IND) 179 |
Loyola Hearn† | ||||||
2006 - 39th General Election
The Liberals won four seats and the Conservatives three. The open Avalon seat changed hands from the Liberals to the Tories. The seat had been held by Natural Resources Minister John Efford, who had retired. Otherwise, there was little change from the previous election.
| Electoral District | Candidates | Incumbent | ||||||||||
|---|---|---|---|---|---|---|---|---|---|---|---|---|
| Liberal | Conservative | NDP | Green | Other | ||||||||
| Avalon | Bill Morrow
14,318 |
Fabian Manning
19,132 |
Eugene Conway
3 365 |
Shannon Hillier
297 0.8% |
John Efford† | |||||||
| Bonavista—Gander— Grand Falls—Windsor |
Scott Simms
19,866 |
Aaron Hynes
15,376 |
Sandra Cooze
2,668 |
Judy Davis
265 0.7% |
Scott Simms | |||||||
| Humber—St. Barbe—Baie Verte | Gerry Byrne
17,208 |
Cyril Pelley
10,137 |
Holly Pike
4,847 |
Martin Hanzalek
339 1.0% |
Gerry Byrne | |||||||
| Labrador | Todd Russell
5,768 |
Joseph Goudie
4,528 |
Jake Larkin
1,037 |
Gail Zwicker
82 0.7% |
Todd Russell | |||||||
| Random—Burin—St. George's | Bill Matthews
13,652 |
Cynthia Downey
12,232 |
Amanda Will
3,702 |
Mark A. Brennan
426 1.4% |
Bill Matthews | |||||||
| St. John's East | Paul Antle
14,345 |
Norman Doyle
19,110 |
Michael Kehoe
7,190 |
Stephen Eli Harris
402 1.0% |
Norman Doyle | |||||||
| St. John's South—Mount Pearl | Siobhan Coady
12,295 |
Loyola Hearn
16,644 |
Peg Norman
8,073 |
Barry Crozier
235 0.6% |
Loyola Hearn | |||||||
- ^ Russell won seat in byelection held May 24, 2005. Previously held by Liberal Lawrence O'Brien (died December 16, 2004)
2004 - 38th General Election
One of the biggest questions of the 2004 election was whether the new Conservative Party of Canada could match the old federal PC Party's level of support in Atlantic Canada. With Newfoundland and Labrador's provincial PC government unpopular over mandating an end to the previous year's public service strike, any province-wide success for 2004 was seen as unlikely. The Conservatives lost one of their three seats (previously gained in a byelection) and held their rump in St. John's. Des McGrath was seen as the NDP's best chance of electing a candidate in the province in several decades, but he still fell nearly 4000 votes short of winning Random—Burin—St. George's.
| Electoral District | Candidates | Incumbent | ||||||||||
|---|---|---|---|---|---|---|---|---|---|---|---|---|
| Liberal | Conservative | NDP | Green | Other | ||||||||
| Avalon | John Efford 18,335 |
Rick Dalton 9,211 |
Michael Kehoe 3,450 |
Don Ferguson 430 |
John Efford | |||||||
| Bonavista—Exploits | Scott Simms 15,970 |
Rex Barnes 13,786 |
Samuel McLean 2,667 |
Ed Sailor White 367 |
John Lannon (Ind.) 344 |
Rex Barnes | ||||||
| Humber—St. Barbe—Baie Verte | Gerry Byrne 17,820 |
Wynanne Downer 6,538 |
Holly Pike 3,743 |
Steve Durant 384 |
Gerry Byrne | |||||||
| Labrador | Lawrence O'Brien 5,524 |
Merrill Strachan 1,400 |
Shawn Crann 856 |
Lori-Ann Martino 178 |
Ern Condon (Ind.) 919 |
Lawrence O'Brien | ||||||
| Random—Burin—St. George's | Bill Matthews 12,383 |
Larry Peckford 4,820 |
Desmond McGrath 8,797 |
Justin Dollimont 474 |
Bill Matthews | |||||||
| St. John's North | Walter Noel 13,343 |
Norman Doyle 15,073 |
Janine Piller 7,198 |
Scott Vokey 791 |
Norman Doyle | |||||||
| St. John's South | Siobhan Coady 11,879 |
Loyola Hearn 13,330 |
Peg Norman 7,989 |
Steve Willcott 493 |
Loyola Hearn | |||||||
- ^ Efford won seat in 2002 byelection; originally held by Liberal Brian Tobin
- ^ Barnes won seat in 2002 byelection; originally held by Liberal George Baker
 Key map |
|
 Conservative Party of Canada |
 Green Party of Canada |
 Liberal Party of Canada |
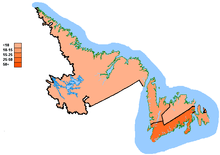 New Democratic Party |
2000 - 37th General Election
| Electoral District | Candidates | Incumbent | ||||||||||
|---|---|---|---|---|---|---|---|---|---|---|---|---|
| Liberal | Canadian Alliance | NDP | PC | Other | ||||||||
| Bonavista—Trinity—Conception | Brian Tobin 22,096 |
Randy Wayne Dawe 1,051 |
Fraser March 6,473 |
Jim Morgan 11,009 |
Fred Mifflin† | |||||||
| Burin—St. George's | Bill Matthews 14,603 |
Peter Fenwick 1,511 |
David Sullivan 924 |
Fred Pottle 5,798 |
Sam Synard (Ind.) 7,891 |
Bill Matthews | ||||||
| Gander—Grand Falls | George Baker 15,874 |
Orville Penney 1,912 |
Bill Broderick 2,876 |
Roger Pike 8,191 |
George Baker | |||||||
| Humber—St. Barbe—Baie Verte | Gerry Byrne 15,405 |
Murdock Cole 1,702 |
Trevor Taylor 8,297 |
Peter McBreairty 6,340 |
Gerry Byrne | |||||||
| Labrador | Lawrence O'Brien 7,153 |
Eugene Burt 677 |
Amanda Will 1,284 |
Hayward Broomfield 1,254 |
Lawrence O'Brien | |||||||
| St. John's East | Peter Miller 13,835 |
Garry Hartle 1,144 |
Carol Cantwell 5,395 |
Norman Doyle 23,606 |
Judy Day (Ind.) 254 Michael Rayment (NLP) 122 |
Norman Doyle | ||||||
| St. John's West | Chuck Furey 14,137 |
Eldon Drost 840 |
Dave Curtis 4,744 |
Loyola Hearn 22,959 |
Michael Rendell (NLP) 141 |
Loyola Hearn | ||||||
- ^ Matthews defected from PC Party in August 1999
| ||||||||||||||||||||||