Canadian federal election, 1867
| | |||||||||||||||||||||||||||||||||||||||||||
| |||||||||||||||||||||||||||||||||||||||||||
| |||||||||||||||||||||||||||||||||||||||||||
|
| |||||||||||||||||||||||||||||||||||||||||||
| |||||||||||||||||||||||||||||||||||||||||||


The Canadian federal election of 1867, held from August 7 to September 20, was the first election for the new nation of Canada. It was held to elect members to the Canadian House of Commons, representing electoral districts in the provinces of Nova Scotia, New Brunswick, Ontario and Quebec in the 1st Parliament of Canada. The provinces of Manitoba (1870) and British Columbia (1871) were created during the term of the 1st Parliament of Canada and were not part of the Canadian federal election of 1867.
Sir John A. Macdonald, as leader of the Conservative Party of Canada (concurrently known as the Liberal-Conservative Party until 1873), became the first Prime Minister of Canada as the Conservatives won a majority of the seats in the election. Macdonald had led a coalition government in the former Province of Canada during the last pre-Confederation election, and the Liberal-Conservative Party that came out of that coalition now won a majority of the seats (and votes) in the new provinces of Ontario and Quebec.
The Liberal Party of Canada won the second largest number of seats overall, including a majority of the seats (and votes) in the province of New Brunswick. The Liberals did not have a party leader in the election. George Brown, who was leader of the Liberal Party of Ontario, was considered the "elder statesman" of the national party. Brown ran concurrently for seats in the Legislative Assembly of Ontario and the Canadian House of Commons, and may well have been Prime Minister in the unlikely event that the Liberals prevailed over the Conservatives in the national election. Brown failed to win a seat in either body, and the national Liberals remained officially leaderless until 1873.
The Anti-Confederation Party, led by Joseph Howe, won the third largest number of seats overall, based solely on a majority of seats (and votes) in the province of Nova Scotia. Their main desire was the reversal of the decision to join Confederation, which had become highly unpopular in that province. The goals of the Anti-Confederation Members of Parliament (MPs) were openly supported by five of the Liberal MPs of New Brunswick. The Anti-Confederation MPs sat with the Liberal caucus. When the government in Britain refused to allow Nova Scotia to secede, a majority of the Anti-Confederation MPs (11 of 18) moved to the Conservatives.
Voter turn-out: 73.1%
For a list of the MPs elected in the 1867 election, and in by-elections prior to 1872, see 1st Canadian parliament.
Election results
National
| ↓ | ||||
| |
|
| ||
| Party | Party leader | # of candidates |
Elected | Popular vote | |||||
|---|---|---|---|---|---|---|---|---|---|
| # | % | ||||||||
| Conservative | Sir John A. Macdonald | 81 | 71 | 63,752 | 23.45% | ||||
| Liberal-Conservative1 | 32 | 29 | 29,730 | 11.08% | |||||
| Liberal | none (unofficially, George Brown) | 65 | 62 | 60,818 | 22.67% | ||||
| Anti-Confederation2 | Joseph Howe | 20 | 18 | 21,239 | 7.92% | ||||
| Independents | 1 | - | 1,756 | 0.65% | |||||
| Liberal-Independent | 1 | - | 1,048 | 0.39% | |||||
| Unknown | 141 | - | 90,044 | 33.84% | |||||
| Total | 341 | 180 | 268,386 | 100% | |||||
| Source: History of Federal Ridings since 1867 | |||||||||
Notes:
1 Though identifying themselves as Liberal-Conservatives, these MPs and those identifying as Conservatives were both led by Sir John A. Macdonald (himself a Liberal-Conservative) and sat together in the House of Commons. 2 Anti-Confederates sat with the Liberal Party in the House of Commons.
Acclamations
The following MPs were acclaimed:
- Ontario: 3 Conservative, 3 Liberal-Conservatives, 9 Liberals
- Quebec: 14 Conservatives, 5 Liberal-Conservatives, 4 Liberals
- New Brunswick: 1 Conservative, 3 Liberals
- Nova Scotia: 4 Anti-Confederates
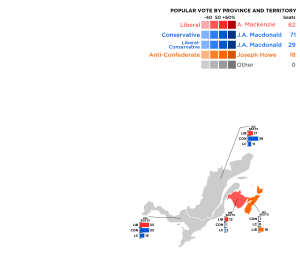
Results by province
| Party name | Ontario | Quebec | NB | NS | Total | ||
|---|---|---|---|---|---|---|---|
| Conservative | Seats | 33 | 36 | 1 | 1 | 71 | |
| Popular vote | 26.2% | 28.5% | 13.8% | 23.2% | |||
| Liberal-Conservative | Seats | 16 | 11 | 2 | - | 29 | |
| Vote | 12.5% | 12.3% | 11.1% | 3.5% | 11.1% | ||
| Liberal | Seats | 33 | 17 | 12 | 62 | ||
| Vote | 23.7% | 25.2% | 49.5% | 22.7% | |||
| Anti-Confederation | Seats | 18 | 18 | ||||
| Vote | 58.2% | 7.9% | |||||
| Unknown | Seats | - | - | - | - | - | |
| Vote | 35.6% | 34.1% | 39.3% | 24.4% | 34.0% | ||
| Independent | Seats | - | - | ||||
| Vote | 1.3% | 0.7% | |||||
| Independent Liberal | Seats | - | - | ||||
| Vote | 0.7% | 0.4% | |||||
| Total seats | 82 | 64 | 15 | 19 | 180 | ||