Camborne (UK Parliament constituency)
| Camborne | |
|---|---|
|
Former County constituency for the House of Commons | |
| 1885–1950 | |
| Number of members | One |
| Replaced by | Falmouth and Camborne |
| Created from | West Cornwall |
Camborne was a county constituency in Cornwall which returned one Member of Parliament to the House of Commons of the Parliament of the United Kingdom. It was created for the 1885 general election, and abolished for the 1950 general election, when it was largely replaced by the new Falmouth and Camborne.
Between 1885 and 1918 its official name was The North West or Camborne Division of Cornwall, and it was sometimes referred to simply as North West Cornwall.
Boundaries

Members of Parliament
| Election | Member | Party | |
|---|---|---|---|
| 1885 | Charles Augustus Vansittart Conybeare | Independent Liberal (Radical) | |
| 1886 | Liberal | ||
| 1895 | Arthur Strauss | Liberal Unionist Party | |
| 1900 | William Sproston Caine | Liberal | |
| 1903 by-election | Sir Wilfrid Lawson | Liberal | |
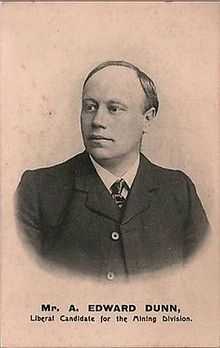
| 1906 | Albert Edward Dunn | Liberal | |
| Dec. 1910 | Sir Francis Dyke Acland, Bt. | Liberal | |
| 1922 | Algernon Henry Moreing | National Liberal | |
| 1923 | Leifchild Stratten Jones | Liberal | |
| 1924 | Algernon Henry Moreing | Constitutionalist | |
| 1929 | Leifchild Stratten Jones | Liberal | |
| 1931 | Sir Peter Garnett Agnew | Conservative | |
| 1950 | constituency abolished | ||
Elections
Elections in the 1880s
| General Election 1885 [1]
Electorate 7,139 | |||||
|---|---|---|---|---|---|
| Party | Candidate | Votes | % | ±% | |
| Independent Liberal | Charles Augustus Vansittart Conybeare | 2,926 | 53.2 | n/a | |
| Liberal | A P Vivian | 2,577 | 46.8 | n/a | |
| Majority | 349 | 6.4 | n/a | ||
| Turnout | 77.1 | n/a | |||
| Independent Liberal win (new seat) | |||||
| General Election 1886 [2]
Electorate 7,139 | |||||
|---|---|---|---|---|---|
| Party | Candidate | Votes | % | ±% | |
| Liberal | Charles Augustus Vansittart Conybeare | 3,156 | 61.6 | n/a | |
| Liberal Unionist | J D Gay | 1,969 | 38.4 | n/a | |
| Majority | 1,187 | 23.2 | n/a | ||
| Turnout | 71.8 | ||||
| Liberal hold | Swing | n/a | |||
Elections in the 1890s
| General Election 1892 [3]
Electorate 7,611 | |||||
|---|---|---|---|---|---|
| Party | Candidate | Votes | % | ±% | |
| Liberal | Charles Augustus Vansittart Conybeare | 3,073 | 53.8 | -7.8 | |
| Liberal Unionist | Arthur Strauss | 2,635 | 46.2 | +7.8 | |
| Majority | 438 | 7.6 | -15.6 | ||
| Turnout | 75.0 | ||||
| Liberal hold | Swing | -7.8 | |||
| General Election 1895 [4]
Electorate 7,800 | |||||
|---|---|---|---|---|---|
| Party | Candidate | Votes | % | ±% | |
| Liberal Unionist | Arthur Strauss | 3,166 | 53.9 | +7.7 | |
| Liberal | Charles Augustus Vansittart Conybeare | 2,704 | 46.1 | -7.7 | |
| Majority | 462 | 15.4 | |||
| Turnout | 75.3 | +0.3 | |||
| Liberal Unionist gain from Liberal | Swing | +7.7 | |||
Elections in the 1900s
| General Election 1900 [5]
Electorate 8,023 | |||||
|---|---|---|---|---|---|
| Party | Candidate | Votes | % | ±% | |
| Liberal | William Sproston Caine | 3,101 | 50.9 | ||
| Liberal Unionist | Arthur Strauss | 2,993 | 49.1 | ||
| Majority | 108 | 1.8 | |||
| Turnout | |||||
| Liberal gain from Liberal Unionist | Swing | ||||
| Camborne by-election, 1903 [6]
Electorate 8,659 | |||||
|---|---|---|---|---|---|
| Party | Candidate | Votes | % | ±% | |
| Liberal | Sir Wilfrid Lawson | 3,558 | 55.4 | +4.5 | |
| Liberal Unionist | Arthur Strauss | 2,869 | 44.6 | -4.5 | |
| Majority | 689 | 10.8 | +9.0 | ||
| Turnout | 74.2 | ||||
| Liberal hold | Swing | +4.5 | |||
| General Election 1906 [7]
Electorate 9,210 | |||||
|---|---|---|---|---|---|
| Party | Candidate | Votes | % | ±% | |
| Liberal | Albert Edward Dunn | 4,614 | 65.0 | ||
| Conservative | Sir Thomas Hewitt | 2,384 | 33.5 | ||
| Social Democratic Federation | John Joseph Jones | 109 | 1.5 | ||
| Majority | 2,230 | 31.5 | |||
| Turnout | 77.2 | ||||
| Liberal hold | Swing | ||||
Elections in the 1910s
| General Election January 1910 [8]
Electorate 9,375 | |||||
|---|---|---|---|---|---|
| Party | Candidate | Votes | % | ±% | |
| Liberal | Albert Edward Dunn | 5,027 | 66.0 | +1.0 | |
| Liberal Unionist | Norman G Chamberlain | 2,587 | 34.0 | +0.5 | |
| Majority | 32.0 | +1.0 | |||
| Turnout | 81.2 | +4.0 | |||
| Liberal hold | Swing | +0.5 | |||
| General Election December 1910 [9]
Electorate 9,375 | |||||
|---|---|---|---|---|---|
| Party | Candidate | Votes | % | ±% | |
| Liberal | Francis Dyke Acland | 4,419 | 65.5 | -0.5 | |
| Liberal Unionist | Dr George Coates | 2,326 | 34.5 | +0.5 | |
| Majority | 2,093 | 31.0 | -1.0 | ||
| Turnout | 71.9 | ||||
| Liberal hold | Swing | -0.5 | |||
General Election 1914/15: Another General Election was required to take place before the end of 1915. The political parties had been making preparations for an election to take place and by the July 1914, the following candidates had been selected;
- Liberal: Rt Hon. Francis Dyke Acland
- Unionist:
General Election 1914/15: Another General Election was required to take place before the end of 1915. The political parties had been making preparations for an election to take place from 1914 and by the end of this year, the following candidates had been selected;
- Liberal: Francis Acland
| General Election 1918[10]
Electorate 32,575 | |||||
|---|---|---|---|---|---|
| Party | Candidate | Votes | % | ±% | |
| Liberal | Rt Hon. Francis Dyke Acland | 7,078 | 52.0 | ||
| Labour | George Nicholls | 6,546 | 48.0 | n/a | |
| Majority | 532 | 4.0 | |||
| Turnout | 41.8 | ||||
| Liberal hold | Swing | ||||
- No Coupon was issued
Elections in the 1920s
| General Election 1922[11]
Electorate 34,097 | |||||
|---|---|---|---|---|---|
| Party | Candidate | Votes | % | ±% | |
| National Liberal | Algernon Henry Moreing | 8,191 | 39.7 | ||
| Liberal | Rt Hon. Leifchild Stratten Jones | 7,923 | 38.4 | ||
| Labour | T Proctor | 4,512 | 21.9 | ||
| Majority | 268 | 1.3 | |||
| Turnout | 60.5 | ||||
| National Liberal gain from Liberal | Swing | ||||
| General Election 1923[12]
Electorate 34,303 | |||||
|---|---|---|---|---|---|
| Party | Candidate | Votes | % | ±% | |
| Independent Liberal | Rt Hon. Leifchild Stratten Jones | 11,794 | 59.3 | ||
| Liberal | Algernon Henry Moreing | 8,096 | 40.7 | ||
| Majority | |||||
| Turnout | 58.0 | ||||
| Independent Liberal gain from Liberal | Swing | ||||
- The local Liberal Association was unable to agree to a candidate, but Moreing was recognised as the official candidate by Liberal Party HQ. Upon election, Jones took the Liberal whip.
| General Election 1924[13]
Electorate 34,399 | |||||
|---|---|---|---|---|---|
| Party | Candidate | Votes | % | ±% | |
| Constitutionalist | Algernon Henry Moreing | 9,530 | 42.9 | ||
| Liberal | Rt Hon. Leifchild Stratten Jones | 7,220 | 32.5 | ||
| Labour | Francis Arnold Polgrean Rowe | 5,477 | 24.6 | ||
| Majority | 2,310 | 10.4 | |||
| Turnout | 64.6 | ||||
| Constitutionalist gain from Liberal | Swing | ||||
- Moreing later took the Unionist whip.
| General Election 1929[14]
Electorate 44,026 | |||||
|---|---|---|---|---|---|
| Party | Candidate | Votes | % | ±% | |
| Liberal | Rt Hon. Leifchild Stratten Jones | 11,176 | 35.8 | ||
| Unionist | Algernon Henry Moreing | 10,145 | 32.6 | ||
| Labour | H J Sharman | 7,870 | 25.3 | ||
| Independent | J C Roberts | 1,976 | 6.3 | ||
| Majority | 1,031 | 3.2 | |||
| Turnout | 70.8 | ||||
| Liberal gain from Unionist | Swing | ||||
Elections in the 1930s
| General Election 1931[15]
Electorate 44,926 | |||||
|---|---|---|---|---|---|
| Party | Candidate | Votes | % | ±% | |
| Conservative | Peter Garnett Agnew | 14,644 | 43.4 | ||
| Liberal | Rt Hon. Leifchild Stratten Jones | 10,840 | 32.1 | ||
| Ind. Labour Party | Kate Florence Spurrell | 8,280 | 24.5 | ||
| Majority | 3,824 | 11.3 | |||
| Turnout | 33,784 | 75.8 | |||
| Conservative gain from Liberal | Swing | ||||
| General Election 1935[16]
Electorate 44,542 | |||||
|---|---|---|---|---|---|
| Party | Candidate | Votes | % | ±% | |
| Conservative | Peter Garnett Agnew | 14,826 | 48.3 | +4.9 | |
| Liberal | Sir Walter Peacock | 7,921 | 25.8 | -6.3 | |
| Labour | Harold R G Greaves | 7,375 | 24.0 | n/a | |
| Ind. Labour Party | Kate Florence Spurrell | 592 | 1.9 | -22.6 | |
| Majority | 6,905 | 22.5 | -11.2 | ||
| Turnout | 66.9 | ||||
| Conservative hold | Swing | ||||
Elections in the 1940s
General Election 1939/40: Another General Election was required to take place before the end of 1940. The political parties had been making preparations for an election to take place from 1939 and by the end of this year, the following candidates had been selected;
- Conservative: Peter Agnew
- Liberal:
- Labour: J J H Moses
| General Election 1945[17]
Electorate 51,407 | |||||
|---|---|---|---|---|---|
| Party | Candidate | Votes | % | ±% | |
| Conservative | Com. Peter Garnett Agnew | 12,257 | 37.1 | -11.2 | |
| Labour | Frank Harold Hayman | 11,673 | 35.3 | +11.3 | |
| Liberal | Dr Thomas Rowland Hill | 9,141 | 27.6 | +1.8 | |
| Majority | 584 | 1.8 | |||
| Turnout | 64.3 | ||||
| Conservative hold | Swing | ||||
See also
- Camborne and Redruth (UK Parliament constituency)
- Falmouth and Camborne (UK Parliament constituency)
References
- ↑ British parliamentary election results, 1885-1918 (Craig)
- ↑ British parliamentary election results, 1885-1918 (Craig)
- ↑ British parliamentary election results, 1885-1918 (Craig)
- ↑ British parliamentary election results, 1885-1918 (Craig)
- ↑ British parliamentary election results, 1885-1918 (Craig)
- ↑ British parliamentary election results, 1885-1918 (Craig)
- ↑ British parliamentary election results, 1885-1918 (Craig)
- ↑ British parliamentary election results, 1885-1918 (Craig)
- ↑ British parliamentary election results, 1885-1918 (Craig)
- ↑ British Parliamentary Election Results 1918-1949 by FWS Craig
- ↑ British Parliamentary Election Results 1918-1949 by FWS Craig
- ↑ British Parliamentary Election Results 1918-1949 by FWS Craig
- ↑ British Parliamentary Election Results 1918-1949 by FWS Craig
- ↑ British Parliamentary Election Results 1918-1949 by FWS Craig
- ↑ British Parliamentary Election Results 1918-1949 by FWS Craig
- ↑ British Parliamentary Election Results 1918-1949 by FWS Craig
- ↑ British Parliamentary Election Results 1918-1949 by FWS Craig
Craig, F. W. S. (1983). British parliamentary election results 1918–1949 (3 ed.). Chichester: Parliamentary Research Services. ISBN 0-900178-06-X.
| ||||||||||||||||||||||||||||||