Camberwell North (UK Parliament constituency)
| Camberwell North | |
|---|---|
|
Former Borough constituency for the House of Commons | |
| County | County of London |
| 1885–1950 | |
| Number of members | One |
| Replaced by | Peckham |
| Created from | Lambeth |
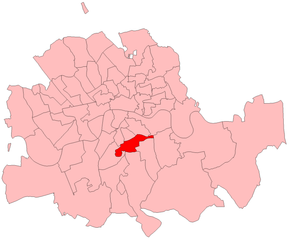
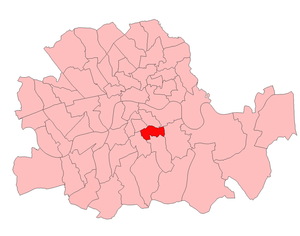
Camberwell North was a borough constituency located in the Metropolitan Borough of Camberwell, in South London. It returned one Member of Parliament (MP) to the House of Commons of the Parliament of the United Kingdom.


The constituency was created for the 1885 general election, and abolished for the 1950 general election.
Boundaries
1918-1950: The Metropolitan Borough of Camberwell wards of Coburg, Marlborough, North Peckham and St George's.
Members of Parliament
Election results
Elections in the 1880s
| General Election 1885: Camberwell North | |||||
|---|---|---|---|---|---|
| Party | Candidate | Votes | % | ±% | |
| Liberal | Richard Strong | 3,137 | 51.3 | ||
| Conservative | Wilfrid Scawen Blunt | 2,975 | 48.7 | ||
| Majority | 162 | ||||
| Turnout | 8,603 | 71.0 | |||
| Liberal win | |||||
| General Election 1886: Camberwell North | |||||
|---|---|---|---|---|---|
| Party | Candidate | Votes | % | ±% | |
| Conservative | John Richards Kelly | 2,717 | 51.1 | 2.4 | |
| Liberal | Edward Hodson Bayley | 2,352 | 44.3 | -7.0 | |
| Ind. Liberal Unionist | William Pirie Duff | 246 | 4.6 | ||
| Majority | 365 | 6.8 | |||
| Turnout | 8,603 | 61.8 | |||
| Conservative gain from Liberal | Swing | ||||
Election in the 1890s
| General Election 1892: Camberwell North | |||||
|---|---|---|---|---|---|
| Party | Candidate | Votes | % | ±% | |
| Liberal | Edward Hodson Bayley | 4,295 | 55.5 | 11.2 | |
| Conservative | John Richards Kelly | 3,450 | 44.5 | -6.6 | |
| Majority | 845 | 11.0 | |||
| Turnout | 11,133 | 69.6 | |||
| Liberal gain from Conservative | Swing | ||||

| General Election 1895: Camberwell North | |||||
|---|---|---|---|---|---|
| Party | Candidate | Votes | % | ±% | |
| Conservative | Philip Hugh Dalbiac | 4,009 | 54.5 | ||
| Liberal | Edward Hodson Bayley | 3,316 | 45.1 | ||
| Independent Liberal | Nelson P. Palmer | 32 | 0.4 | ||
| Majority | 693 | 9.4 | |||
| Conservative gain from Liberal | Swing | ||||
Elections in the 1900s

| General Election 1900: Camberwell North | |||||
|---|---|---|---|---|---|
| Party | Candidate | Votes | % | ±% | |
| Liberal | Thomas James Macnamara | 4,820 | 55.8 | +10.7 | |
| Conservative | Joseph Robert Diggle | 3,825 | 44.2 | -10.3 | |
| Majority | 1,335 | 15.4 | |||
| Liberal gain from Conservative | Swing | ||||
| General Election 1906: Camberwell North | |||||
|---|---|---|---|---|---|
| Party | Candidate | Votes | % | ±% | |
| Liberal | Thomas James Macnamara | 6,314 | 64.4 | +8.6 | |
| Conservative | Charles H Hoare | 3,497 | 35.6 | -8.6 | |
| Majority | 2,817 | 28.7 | +13.3 | ||
| Liberal hold | Swing | ||||
Election in the 1910s
| General Election January 1910: Camberwell North[1] | |||||
|---|---|---|---|---|---|
| Party | Candidate | Votes | % | ±% | |
| Liberal | Thomas James Macnamara | 5,593 | 55.4 | -9.0 | |
| Conservative | Sydney Hoffnung Goldsmid | 4,511 | 44.6 | +9.0 | |
| Majority | 1,082 | 10.8 | -18.0 | ||
| Turnout | 84.8 | ||||
| Liberal hold | Swing | -9.0 | |||

| General Election December 1910: Camberwell North[2] | |||||
|---|---|---|---|---|---|
| Party | Candidate | Votes | % | ±% | |
| Liberal | Thomas James Macnamara | 5,038 | 55.4 | +0.0 | |
| Conservative | Sydney Hoffnung Goldsmid | 4,056 | 44.6 | -0.0 | |
| Majority | 982 | 10.8 | 0.0 | ||
| Turnout | 9,094 | 76.3 | -8.5 | ||
| Liberal hold | Swing | +0.0 | |||
General Election 1914/15:
Another General Election was required to take place before the end of 1915. The political parties had been making preparations for an election to take place and by the July 1914, the following candidates had been selected;
- Liberal: Rt Hon. Thomas James Macnamara
- Unionist: Walter Guy Wulf Radford
In 1918 constituency boundaries were changed and a new seat of Camberwell North West was created. Macnamara chose to contest the new seat.
| General Election 1918: Camberwell North | |||||
|---|---|---|---|---|---|
| Party | Candidate | Votes | % | ±% | |
| Unionist | 6,010 | 58.0 | |||
| Liberal | George Hearn | 2,177 | 21.0 | ||
| Labour | Charles George Ammon | 2,175 | 21.0 | ||
| Majority | 3,833 | 37.0 | |||
| Turnout | 26,416 | 39.2 | |||
| Unionist gain from Liberal | Swing | ||||
- endorsed by the Coalition Government
Elections in the 1920s
| Camberwell North by-election, 1922 | |||||
|---|---|---|---|---|---|
| Party | Candidate | Votes | % | ±% | |
| Labour | Charles George Ammon | 7,854 | 53.9 | ||
| Unionist | Richard James Meller | 6,719 | 46.1 | ||
| Majority | 1,135 | 7.8 | |||
| Turnout | 28,709 | 50.8 | |||
| Labour gain from Unionist | Swing | ||||
| General Election 1922: Camberwell North | |||||
|---|---|---|---|---|---|
| Party | Candidate | Votes | % | ±% | |
| Labour | Charles George Ammon | 8,320 | 50.8 | -13.4 | |
| Unionist | Dame Helen Charlotte Isabella Gwynne-Vaughan | 8,066 | 49.2 | +13.4 | |
| Majority | 254 | 1.6 | -6.2 | ||
| Turnout | 16,386 | 56.7 | +5.9 | ||
| Labour hold | Swing | -13.4 | |||
| General Election 1923: Camberwell North | |||||
|---|---|---|---|---|---|
| Party | Candidate | Votes | % | ±% | |
| Labour | Charles George Ammon | 10,620 | 64.2 | +13.4 | |
| Unionist | Dame Helen Charlotte Isabella Gwynne-Vaughan | 5,934 | 35.8 | -13.4 | |
| Majority | 4,686 | 28.3 | +26.7 | ||
| Turnout | 16,554 | 56.9 | +0.2 | ||
| Labour hold | Swing | +13.4 | |||
| General Election 1924: Camberwell North | |||||
|---|---|---|---|---|---|
| Party | Candidate | Votes | % | ±% | |
| Labour | Charles George Ammon | 11,300 | 54.9 | -9.3 | |
| Unionist | Dame Helen Charlotte Isabella Gwynne-Vaughan | 7,564 | 36.7 | +0.9 | |
| Liberal | Victor Diederichs Duval | 1,729 | 8.4 | +8.4 | |
| Majority | 3,736 | 18.1 | |||
| Turnout | 20,593 | 69.7 | |||
| Labour hold | Swing | -5.4 | |||
| General Election 1929: Camberwell North | |||||
|---|---|---|---|---|---|
| Party | Candidate | Votes | % | ±% | |
| Labour | Charles George Ammon | 13,051 | 57.9 | +3.0 | |
| Unionist | Leo St. Clare Grondona | 5,228 | 23.2 | -13.5 | |
| Liberal | Hugh John Edwards | 4,244 | 18.8 | +10.4 | |
| Majority | 7,823 | 34.7 | +16.6 | ||
| Turnout | 225,23 | 63.0 | -6.7 | ||
| Labour hold | Swing | ||||
Election in the 1930s
| General Election 1931: Camberwell North | |||||
|---|---|---|---|---|---|
| Party | Candidate | Votes | % | ±% | |
| Conservative | Arthur Leonard Bateman | 10,634 | 51.9 | ||
| Labour | Charles George Ammon | 9,869 | 48.1 | ||
| Majority | 765 | 3.7 | |||
| Turnout | 20,503 | 58.3 | |||
| Conservative gain from Labour | Swing | ||||
| General Election 1935: Camberwell North | |||||
|---|---|---|---|---|---|
| Party | Candidate | Votes | % | ±% | |
| Labour | Charles George Ammon | 11,701 | 64.7 | +16.6 | |
| Conservative | Thomas Ballantyne Martin | 5,924 | 32.8 | -9.1 | |
| Independent | Thomas Frederick Rhodes Disher | 451 | 2.5 | N/A | |
| Majority | 5,777 | 32.0 | |||
| Turnout | 18,076 | 55.6 | -2.7 | ||
| Labour gain from Conservative | Swing | ||||
General Election 1939/40
Another General Election was required to take place before the end of 1940. The political parties had been making preparations for an election to take place and by the Autumn of 1939, the following candidates had been selected;
- Labour: Charles George Ammon[3]
- Conservative: Edward Rudolph Mayer
Election in the 1940s
| Camberwell North by-election, 1944 | |||||
|---|---|---|---|---|---|
| Party | Candidate | Votes | % | ±% | |
| Labour | Cecil Aubrey Gwynne Manning | 2,655 | 79.8 | ||
| Independent | Thomas Frederick Rhodes Disher | 674 | 20.2 | ||
| Majority | 1,981 | 59.6 | |||
| Turnout | 29,661 | 11.2 | |||
| Labour hold | Swing | N/A | |||
| General Election 1945: Camberwell North | |||||
|---|---|---|---|---|---|
| Party | Candidate | Votes | % | ±% | |
| Labour | Cecil Aubrey Gwynne Manning | 7,186 | 76.6 | ||
| Conservative | Edward Rudolph Mayer | 1,394 | 14.9 | ||
| Independent National | Thomas Frederick Rhodes Disher | 794 | 8.5 | ||
| Majority | 5,792 | 61.7 | |||
| Turnout | 15,506 | 60.5 | |||
| Labour hold | Swing | ||||
References
- Leigh Rayment's Historical List of MPs – Constituencies beginning with "C" (part 1)
- British Parliamentary Election Results 1885-1918, compiled and edited by F.W.S. Craig (Macmillan Press 1974)
- Debrett’s Illustrated Heraldic and Biographical House of Commons and the Judicial Bench 1886
- Debrett’s House of Commons and the Judicial Bench 1901
- Debrett’s House of Commons and the Judicial Bench 1918