Broxbourne (UK Parliament constituency)
| Broxbourne | |
|---|---|
|
Borough constituency for the House of Commons | |
|
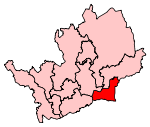
Boundary of Broxbourne in Hertfordshire. | |
|
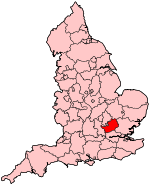
Location of Hertfordshire within England. | |
| County | Hertfordshire |
| Population | 98,790 (2011 census)[1] |
| Electorate | 71,872 (December 2010)[2] |
| Major settlements | Broxbourne |
| Current constituency | |
| Created | 1983 |
| Member of parliament | Charles Walker (Conservative) |
| Number of members | One |
| Overlaps | |
| European Parliament constituency | East of England |
Broxbourne is a constituency represented in the House of Commons of the UK Parliament since 2005 by Charles Walker of the Conservative Party.[n 1]
Boundaries
Broxbourne constituency was created in 1983 from the former seat of East Hertfordshire. It includes the whole of the borough of Broxbourne together with the ward of Northaw in Welwyn Hatfield, directly north of the borough.
Latest boundary review
Following the national review and recommendations of the Boundary Commission no change was made to the seat of Broxbourne, which continues to link the Welywn Hatfield electoral ward of Northaw with the borough of Broxbourne.
Constituency profile
Broxbourne is, on the winning candidate's share of the vote, the safest seat for any Conservative in Hertfordshire and one of the safest in the country.
Just beyond the outer limits of Greater London,[3] the seat consists almost exclusively of low unemployment census output areas,[4] with walks, golf courses and leisure facilities and a relatively high proportion compared to Greater London of the retired and high-income self-employed,[5] Broxbourne's economy is also supported by good links to the City of London by train.[6]
Members of Parliament
| Election | Member[7][8] | Party | |
|---|---|---|---|
| 1983 | Dame Marion Roe | Conservative | |
| 2005 | Charles Walker | Conservative | |
Elections
Elections in the 2010s
| General Election 2015: Broxbourne | |||||
|---|---|---|---|---|---|
| Party | Candidate | Votes | % | ±% | |
| Conservative | Charles Walker [9] | ||||
| Green | Russell Secker[10] | ||||
| UKIP | David Platt [11] | ||||
| Labour | Edward Robinson [12] | ||||
| Liberal Democrat | Anthony Rowlands | ||||
| General Election 2010: Broxbourne[13][14] | |||||
|---|---|---|---|---|---|
| Party | Candidate | Votes | % | ±% | |
| Conservative | Charles Walker | 26,844 | 58.8 | +4.9 | |
| Labour | Michael Watson | 8,040 | 17.6 | −7.9 | |
| Liberal Democrat | Allan Witherick | 6,107 | 13.4 | +1.1 | |
| BNP | Steve McCole | 2,159 | 4.7 | 0.0 | |
| UKIP | Martin Harvey | 1,890 | 4.1 | +0.5 | |
| English Democrats | Debbie Lemay | 618 | 1.4 | +1.4 | |
| Majority | 18,804 | 41.2 | |||
| Turnout | 45,658 | 64.0 | +4.7 | ||
| Conservative hold | Swing | +4.7 | |||
Elections in the 2000s
| General Election 2005: Broxbourne | |||||
|---|---|---|---|---|---|
| Party | Candidate | Votes | % | ±% | |
| Conservative | Charles Walker | 21,878 | 53.8 | −0.3 | |
| Labour | Jamie Bolden | 10,369 | 25.5 | −4.9 | |
| Liberal Democrat | Andrew Porrer | 4,973 | 12.2 | +1.2 | |
| BNP | Andrew Emerson | 1,929 | 4.7 | +2.5 | |
| UKIP | Martin Harvey | 1,479 | 3.6 | +1.3 | |
| Majority | 11,509 | 28.3 | |||
| Turnout | 40,628 | 59.7 | +4.0 | ||
| Conservative hold | Swing | +2.3 | |||
| General Election 2001: Broxbourne | |||||
|---|---|---|---|---|---|
| Party | Candidate | Votes | % | ±% | |
| Conservative | Marion Roe | 20,487 | 54.1 | +5.3 | |
| Labour | David Prendergast | 11,494 | 30.4 | −4.3 | |
| Liberal Democrat | Julia Davies | 4,158 | 11.0 | −0.3 | |
| UKIP | Martin Harvey | 858 | 2.3 | N/A | |
| BNP | John Cope | 848 | 2.2 | +0.9 | |
| Majority | 8,993 | 23.7 | |||
| Turnout | 37,845 | 55.7 | −14.6 | ||
| Conservative hold | Swing | ||||
Elections in the 1990s
| General Election 1997: Broxbourne | |||||
|---|---|---|---|---|---|
| Party | Candidate | Votes | % | ±% | |
| Conservative | Marion Roe | 22,952 | 48.8 | ||
| Labour | Benjamin J. Coleman | 16,299 | 34.7 | ||
| Liberal Democrat | Mrs. Julia M. Davies | 5,310 | 11.3 | ||
| Referendum Party | David S. Millward | 1,633 | 3.5 | N/A | |
| BNP | David J. Bruce | 610 | 1.3 | N/A | |
| Independent | Brent A. Cheetham | 172 | 0.4 | N/A | |
| Majority | 6,653 | 14.2 | |||
| Turnout | 46,976 | 70.3 | |||
| Conservative hold | Swing | ||||
| General Election 1992: Broxbourne[15] | |||||
|---|---|---|---|---|---|
| Party | Candidate | Votes | % | ±% | |
| Conservative | Marion Roe | 36,094 | 62.6 | −0.6 | |
| Labour | Martin Hudson | 12,124 | 21.0 | +4.1 | |
| Liberal Democrat | Mrs. Julia M. Davies | 9,244 | 16.0 | −3.9 | |
| Natural Law | George Woolhouse | 198 | 0.3 | +0.3 | |
| Majority | 23,970 | 41.6 | −1.7 | ||
| Turnout | 57,660 | 79.9 | +4.7 | ||
| Conservative hold | Swing | −2.4 | |||
Elections in the 1980s
| General Election 1987: Broxbourne | |||||
|---|---|---|---|---|---|
| Party | Candidate | Votes | % | ±% | |
| Conservative | Marion Roe | 33,567 | 63.2 | ||
| Liberal | Mrs. E. Yates | 10,572 | 19.9 | ||
| Labour | P.W. Parry | 8,984 | 16.9 | ||
| Majority | 22,995 | 43.3 | |||
| Turnout | 53,123 | 75.2 | |||
| Conservative hold | Swing | ||||
| General Election 1983: Broxbourne | |||||
|---|---|---|---|---|---|
| Party | Candidate | Votes | % | ±% | |
| Conservative | Marion Roe | 29,328 | 58.8 | N/A | |
| Liberal | B.B. Pollock | 11,862 | 23.8 | N/A | |
| Labour | Martin J. Stears | 8,159 | 16.4 | N/A | |
| BNP | J.R. Smith | 502 | 1.0 | N/A | |
| Majority | 17,466 | 35.0 | N/A | ||
| Turnout | 49,851 | 74.0 | N/A | ||
| Conservative win (new seat) | |||||
See also
- List of Parliamentary constituencies in Hertfordshire
Notes and references
- Notes
- ↑ As with all constituencies, the constituency elects one Member of Parliament (MP) by the first past the post system of election at least every five years.
- References
- ↑ "Broxbourne: Usual Resident Population, 2011". Neighbourhood Statistics. Office for National Statistics. Retrieved 4 February 2015.
- ↑ "Electorate Figures - Boundary Commission for England". 2011 Electorate Figures. Boundary Commission for England. 4 March 2011. Retrieved 13 March 2011.
- ↑ Guardian 2010 mini-profile
- ↑ Open Street Map
- ↑ 2001 Census
- ↑ Association of Train Operating Companies, Official Timetable
- ↑ "Broxbourne 1983-". Hansard 1803-2005. UK Parliament. Retrieved 2 February 2015.
- ↑ Leigh Rayment's Historical List of MPs – Constituencies beginning with "B" (part 6)
- ↑ https://www.conservatives.com/OurTeam/Prospective_Parliamentary_Candidates/Walker_Charles.aspx
- ↑ http://electionresults.blogspot.co.uk/2013/04/broxbourne-2015.html
- ↑ http://electionresults.blogspot.co.uk/2013/04/broxbourne-2015.html
- ↑ http://electionresults.blogspot.co.uk/2013/04/broxbourne-2015.html
- ↑ Broxbourne UKPolling
- ↑ "BBC NEWS – Election 2010 – Broxbourne". BBC News.
- ↑ "UK General Election results April 1992". Richard Kimber's Political Science Resources. Politics Resources. 9 April 1992. Retrieved 2010-12-06.
External Links
- nomis Constituency Profile for Broxbourne — presenting data from the ONS annual population survey and other official statistics.