Bristol West (UK Parliament constituency)
| Bristol West | |
|---|---|
|
Borough constituency for the House of Commons | |
|
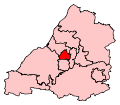
Boundary of Bristol West in Avon. | |
|
Location of Avon within England. | |
| County | City of Bristol |
| Electorate | 82,503 (December 2010)[1] |
| Current constituency | |
| Created | 1885 |
| Member of parliament | Stephen Williams (Liberal Democrat) |
| Number of members | One |
| Overlaps | |
| European Parliament constituency | South West England |

Bristol West is a borough constituency represented in the House of Commons of the Parliament of the United Kingdom. It covers the central and western parts of Bristol.
Boundaries
Following the review into parliamentary representation in Bristol by the Boundary Commission for England, Bristol West was subject to significant boundary changes at the 2010 general election.[2] The constituency is now formed from the following electoral wards: Ashley, Bishopston, Cabot, Clifton, Clifton East, Cotham, Easton, Lawrence Hill, Redland. Easton and Lawrence Hill were transferred from Bristol East, while the wards of Henleaze, Stoke Bishop and Westbury-on-Trym were lost to Bristol North West.
During the review, a proposal to rename the constituency as "Bristol Central" was rejected.[2]
During the boundary review in 2012, the Conservatives insisted that all constituencies should comprise roughly similar populations. As a larger than average constituency, Bristol West is therefore likely to lose the ward of Easton to the constituency of Bristol East.
History
Traditionally this was the safest Conservative seat in Bristol, covering its most middle-class areas. It was held by the party continuously for a century and was represented by a series of Conservative cabinet ministers including Michael Hicks-Beach, Oliver Stanley, Walter Monckton and William Waldegrave. The seat was held by the Conservatives for 112 years before Labour's Valerie Davey won it at the 1997 general election; Labour had been third in 1992.
At the 2005 election the seat was Liberal Democrat target number 18, and Conservative target number 50; it had been frequently described in the media as a "three-way marginal", and all parties fought hard for the constituency. The seat was taken by Liberal Democrat Stephen Williams with a large majority, thought to have been aided by the large student electorate, hostile to Labour's top-up fees policy. This Liberal Democrat success was similar to those in other seats with a large student population, such as Cambridge, Manchester Withington, Leeds North West and Cardiff Central. In the 2010 election, Stephen Williams held the seat with an increased majority.[3]
Members of Parliament

Elections
Elections in the 2010s
| General Election 2015: Bristol West | |||||
|---|---|---|---|---|---|
| Party | Candidate | Votes | % | ±% | |
| Liberal Democrat | Stephen Williams [5] | ||||
| Labour | Thangam Debbonaire [5] | ||||
| UKIP | Paul Turner[5] | ||||
| Green | Darren Hall [5] | ||||
| Conservative | Claire Hiscott [5] | ||||
| Left Unity | Stewart Weston [5] | ||||
| Independent | Dawn Parry [6] | ||||
In 2015, Class War Party announced Jan McDonald as its candidate,[7] but he failed to stand.
| General Election 2010: Bristol West[3][8] | |||||
|---|---|---|---|---|---|
| Party | Candidate | Votes | % | ±% | |
| Liberal Democrat | Stephen Williams | 26,593 | 48.0 | +8.9 | |
| Labour | Paul Smith | 15,227 | 27.5 | −9.0 | |
| Conservative | Nick Yarker | 10,169 | 18.4 | +2.0 | |
| Green | Ricky Knight | 2,090 | 3.8 | −1.8 | |
| UKIP | Christopher Lees | 655 | 1.2 | −0.1 | |
| Independent | Danny Kushlick | 343 | 0.6 | ||
| English Democrats | Jon Baker | 270 | 0.5 | ||
| Majority | 11,366 | 20.5 | +11.6 | ||
| Turnout | 55,347 | 66.9 | +3.3 | ||
| Liberal Democrat hold | Swing | ||||
Elections in the 2000s
| General Election 2005: Bristol West | |||||
|---|---|---|---|---|---|
| Party | Candidate | Votes | % | ±% | |
| Liberal Democrat | Stephen Williams | 21,987 | 38.3 | +9.4 | |
| Labour | Valerie Davey | 16,859 | 29.4 | −7.4 | |
| Conservative | David Martin | 15,429 | 26.9 | −1.9 | |
| Green | Justin M. Quinnell | 2,163 | 3.8 | +0.3 | |
| UKIP | Simon D. Muir | 439 | 0.8 | −0.1 | |
| Socialist Labour | Bernard J. Kennedy | 329 | 0.6 | −0.5 | |
| Save Bristol North Baths Party | Douglas J. Reid | 190 | 0.3 | +0.3 | |
| Majority | 5,128 | 8.9 | |||
| Turnout | 57,396 | 70.5 | +4.9 | ||
| Liberal Democrat gain from Labour | Swing | +8.4 | |||
| General Election 2001: Bristol West | |||||
|---|---|---|---|---|---|
| Party | Candidate | Votes | % | ±% | |
| Labour | Valerie Davey | 20,505 | 36.8 | +1.6 | |
| Liberal Democrat | Stephen Williams | 16,079 | 28.9 | +0.9 | |
| Conservative | Pamela Chesters | 16,040 | 28.8 | −4.0 | |
| Green | John F.L. Devaney | 1,961 | 3.5 | +2.2 | |
| Socialist Labour | Bernard J. Kennedy | 590 | 1.1 | +0.7 | |
| UKIP | Simon D. Muir | 490 | 0.9 | N/A | |
| Majority | 4,426 | 7.9 | |||
| Turnout | 55,665 | 65.6 | −7.8 | ||
| Labour hold | Swing | ||||
Elections in the 1990s
| General Election 1997: Bristol West[9] | |||||
|---|---|---|---|---|---|
| Party | Candidate | Votes | % | ±% | |
| Labour | Valerie Davey | 22,068 | 35.2 | +10.5 | |
| Conservative | William Waldegrave | 20,575 | 32.8 | −9.4 | |
| Liberal Democrat | Charles R. Boney | 17,551 | 28.0 | −2.7 | |
| Referendum Party | Lady R.E. Margot Beauchamp | 1,304 | 2.1 | N/A | |
| Green | Justin M. Quinnell | 852 | 1.4 | +0.4 | |
| Socialist Labour | Roy C.M.T. Nurse | 244 | 0.4 | N/A | |
| Natural Law | Jai J. Brierley | 47 | 0.1 | −0.1 | |
| Majority | 1,493 | 2.4 | |||
| Turnout | 61,789 | 73.8 | |||
| Labour gain from Conservative | Swing | ||||
| General Election 1992: Bristol West | |||||
|---|---|---|---|---|---|
| Party | Candidate | Votes | % | ±% | |
| Conservative | William Waldegrave | 22,169 | 42.2 | −3.3 | |
| Liberal Democrat | Charles R. Boney | 16,098 | 30.7 | −0.6 | |
| Labour | Headley Bashforth | 12,992 | 24.7 | +3.8 | |
| Green | Alastair Sawday | 906 | 1.7 | −0.3 | |
| Natural Law | David J. Cross | 104 | 0.2 | N/A | |
| Revolutionary Communist | Ben Brent | 92 | 0.2 | N/A | |
| Struck off Doctors Alliance | Phil J. Hammond | 87 | 0.2 | N/A | |
| Anti-Federalist League | Tim P.E. Hedges | 42 | 0.1 | N/A | |
| Majority | 6,071 | 11.5 | −2.7 | ||
| Turnout | 52,490 | 74.0 | −1.0 | ||
| Conservative hold | Swing | −1.4 | |||
Elections in the 1980s
| General Election 1987: Bristol West | |||||
|---|---|---|---|---|---|
| Party | Candidate | Votes | % | ±% | |
| Conservative | William Waldegrave | 24,695 | 45.5 | −3.6 | |
| Liberal | George Robin Paget Ferguson | 16,992 | 31.3 | +1.9 | |
| Labour | Mrs. Mary Caroline Georghiou | 11,337 | 20.9 | +1.4 | |
| Green | Mrs. Gundula Audrey Dorey | 1,096 | 2.0 | N/A | |
| Communist | Miss Veronica Ralph | 134 | 0.3 | N/A | |
| Majority | 7,703 | 14.2 | −5.5 | ||
| Turnout | 54,254 | 75.0 | +4.3 | ||
| Conservative hold | Swing | ||||
| General Election 1983: Bristol West | |||||
|---|---|---|---|---|---|
| Party | Candidate | Votes | % | ±% | |
| Conservative | William Waldegrave | 25,400 | 49.1 | ||
| Liberal | George Robin Paget Ferguson | 15,222 | 29.4 | ||
| Labour | Mrs. P.R. Tatlow | 10,094 | 19.5 | ||
| Ecology | J.F.K. Scott | 872 | 1.7 | ||
| Independent | S. Boyle | 142 | 0.3 | ||
| Majority | 10,178 | 19.7 | |||
| Turnout | 51,730 | 70.7 | |||
| Conservative hold | Swing | ||||
Elections in the 1970s
| General Election 1979: Bristol West | |||||
|---|---|---|---|---|---|
| Party | Candidate | Votes | % | ±% | |
| Conservative | William Waldegrave | 22,257 | 52.6 | ||
| Labour | V. Bath | 9,691 | 22.9 | ||
| Liberal | B. Silver | 8,881 | 21.0 | ||
| Ecology | J.K. Ingham | 1,154 | 2.7 | ||
| National Front | M. Jones | 246 | 0.6 | ||
| Independent | R.R. Redmore | 93 | 0.2 | ||
| Majority | 12,566 | 29.7 | |||
| Turnout | 71.6 | ||||
| Conservative hold | Swing | ||||
| General Election October 1974: Bristol West | |||||
|---|---|---|---|---|---|
| Party | Candidate | Votes | % | ±% | |
| Conservative | Robert G. Cooke | 18,555 | 46.9 | ||
| Liberal | R.G.R. Stacey | 11,598 | 29.3 | ||
| Labour | J. Malos | 9,372 | 23.7 | ||
| Majority | 6,957 | 17.6 | |||
| Turnout | 65.4 | ||||
| Conservative hold | Swing | ||||
| General Election February 1974: Bristol West | |||||
|---|---|---|---|---|---|
| Party | Candidate | Votes | % | ±% | |
| Conservative | Robert G. Cooke | 21,141 | 48.3 | ||
| Liberal | R.G.R. Stacey | 13,076 | 29.9 | ||
| Labour | J. Malos | 9,526 | 21.8 | ||
| Majority | 8,065 | 18.4 | |||
| Turnout | 72.7 | ||||
| Conservative hold | Swing | ||||
| General Election 1970: Bristol West | |||||
|---|---|---|---|---|---|
| Party | Candidate | Votes | % | ±% | |
| Conservative | Robert G. Cooke | 20,110 | 60.2 | ||
| Labour | D.J. Blackman | 8,175 | 24.5 | ||
| Liberal | R.G.R. Stacey | 5,108 | 15.3 | ||
| Majority | 11,935 | 35.7 | |||
| Turnout | 66.3 | ||||
| Conservative hold | Swing | ||||
Elections in the 1960s
| General Election 1966: Bristol West | |||||
|---|---|---|---|---|---|
| Party | Candidate | Votes | % | ±% | |
| Conservative | Robert G. Cooke | 19,783 | 56.7 | ||
| Labour | L.W. Bosisto | 8,265 | 23.7 | ||
| Liberal | R.G.R. Stacey | 6,850 | 19.6 | ||
| Majority | 11,518 | 33.0 | |||
| Turnout | 72.2 | ||||
| Conservative hold | Swing | ||||
| General Election 1964: Bristol West | |||||
|---|---|---|---|---|---|
| Party | Candidate | Votes | % | ±% | |
| Conservative | Robert G. Cooke | 21,230 | 58.0 | ||
| Liberal | K.B. Wedmore | 7,366 | 20.1 | ||
| Labour | D. McLaren | 7,306 | 20.0 | ||
| Taxpayers' Coalition Party | P.M. Kingston | 709 | 1.9 | ||
| Majority | 13,864 | 37.9 | |||
| Turnout | 73.2 | ||||
| Conservative hold | Swing | ||||
Elections in the 1950s
| General Election 1959: Bristol West | |||||
|---|---|---|---|---|---|
| Party | Candidate | Votes | % | ±% | |
| Conservative | Robert G. Cooke | 27,768 | 67.3 | ||
| Labour | Michael Cocks | 7,651 | 18.6 | ||
| Liberal | Colin Allen Hart-Leverton | 5,835 | 14.1 | ||
| Majority | 20,117 | 48.7 | |||
| Turnout | 73.6 | ||||
| Conservative hold | Swing | ||||
| Bristol West by-election 7 March 1957 | |||||
|---|---|---|---|---|---|
| Party | Candidate | Votes | % | ±% | |
| Conservative | Robert G. Cooke | 24,585 | 70.2 | ||
| Labour | William Rodgers | 10,423 | 29.8 | ||
| Majority | 14,162 | 40.4 | |||
| Turnout | 61.1 | ||||
| Conservative hold | Swing | ||||
| General Election 1955: Bristol West | |||||
|---|---|---|---|---|---|
| Party | Candidate | Votes | % | ±% | |
| Conservative | Sir Walter T. Monckton | 32,767 | 75.3 | ||
| Labour | Walter Hamlet Johnson | 10,766 | 24.7 | ||
| Majority | 22,001 | 50.6 | |||
| Turnout | 74.6 | ||||
| Conservative hold | Swing | ||||
| General Election 1951: Bristol West | |||||
|---|---|---|---|---|---|
| Party | Candidate | Votes | % | ±% | |
| Conservative | Sir Walter T. Monckton | 25,858 | 63.6 | ||
| Labour | H. Lawrance | 11,716 | 28.8 | ||
| Liberal | David Goldblatt | 3,115 | 7.7 | ||
| Majority | 14,142 | 34.8 | |||
| Turnout | 80.6 | ||||
| Conservative hold | Swing | ||||
| Bristol West by-election 15 February 1951 | |||||
|---|---|---|---|---|---|
| Party | Candidate | Votes | % | ±% | |
| Conservative | Sir Walter T. Monckton | 22,216 | 81.4 | ||
| Labour | H. Lawrance | 5,072 | 18.6 | ||
| Majority | 17,144 | 62.8 | |||
| Turnout | 53.6 | ||||
| Conservative hold | Swing | ||||
| General Election 1950: Bristol West | |||||
|---|---|---|---|---|---|
| Party | Candidate | Votes | % | ±% | |
| Conservative | Oliver F.G. Stanley | 24,920 | 58.9 | ||
| Labour | E.S. Bishop | 12,677 | 30.0 | ||
| Liberal | Miss Hilda Nuttall | 4,688 | 11.1 | ||
| Majority | 12,243 | 28.9 | |||
| Turnout | 82.4 | ||||
| Conservative hold | Swing | ||||
Elections in the 1940s
| General Election 1945: Bristol West | |||||
|---|---|---|---|---|---|
| Party | Candidate | Votes | % | ±% | |
| Conservative | Oliver F.G. Stanley | 32,149 | 48.6 | ||
| Labour | William Edward Balmer | 25,163 | 38.0 | ||
| Liberal | Desmond Allhusen | 8,849 | 13.4 | ||
| Majority | 6,986 | 10.6 | |||
| Turnout | 74.7 | ||||
| Conservative hold | Swing | ||||
Elections in the 1930s
| General Election 1935: Bristol West | |||||
|---|---|---|---|---|---|
| Party | Candidate | Votes | % | ±% | |
| Conservative | Cyril Thomas Culverwell | 36,820 | 71.0 | ||
| Labour | Percy Williams | 15,058 | 29.0 | ||
| Majority | 21,762 | 42.0 | |||
| Turnout | 70.8 | ||||
| Conservative hold | Swing | ||||
| General Election 1931: Bristol West | |||||
|---|---|---|---|---|---|
| Party | Candidate | Votes | % | ±% | |
| Conservative | Cyril Thomas Culverwell | 43,264 | 83.0 | ||
| Labour | F.E. White | 8,875 | 17.0 | ||
| Majority | 34,389 | 66.0 | |||
| Turnout | 79.3 | ||||
| Conservative hold | Swing | ||||
Elections in the 1920s
| General Election 1929: Bristol West | |||||
|---|---|---|---|---|---|
| Party | Candidate | Votes | % | ±% | |
| Conservative | Cyril Thomas Culverwell | 25,416 | 53.7 | ||
| Labour | Lady Clare Annesley | 11,961 | 25.3 | ||
| Liberal | W. Nichols Marcy | 9,909 | 21.0 | ||
| Majority | 13,455 | 28.4 | |||
| Turnout | 77.7 | ||||
| Conservative hold | Swing | ||||
| Bristol West by-election February 1928 | |||||
|---|---|---|---|---|---|
| Party | Candidate | Votes | % | ±% | |
| Conservative | Cyril Thomas Culverwell | 16,970 | 57.2 | ||
| Labour | Lady Clare Annesley | 7,702 | 26.0 | ||
| Liberal | W. Nichols Marcy | 4,996 | 16.8 | ||
| Majority | 9,268 | 31.2 | |||
| Conservative hold | Swing | ||||
| General Election 1924: Bristol West | |||||
|---|---|---|---|---|---|
| Party | Candidate | Votes | % | ±% | |
| Conservative | Col. George A. Gibbs | 23,574 | 79.0 | ||
| Labour | M. Giles | 6,276 | 21.0 | ||
| Majority | 17,298 | 58.0 | |||
| Conservative hold | Swing | ||||
| General Election 1923: Bristol West | |||||
|---|---|---|---|---|---|
| Party | Candidate | Votes | % | ±% | |
| Conservative | Col. George A. Gibbs | Unopposed | - | - | |
| Majority | - | - | |||
| Conservative hold | Swing | ||||
| General Election 1922: Bristol West | |||||
|---|---|---|---|---|---|
| Party | Candidate | Votes | % | ±% | |
| Conservative | Col. George A. Gibbs | 18,124 | 62.0 | ||
| Liberal | Frank Walter Raffety | 11,100 | 38.0 | ||
| Majority | 7,024 | 24.0 | |||
| Conservative hold | Swing | ||||
Elections in the 1910s
| General Election 1918: Bristol West | |||||
|---|---|---|---|---|---|
| Party | Candidate | Votes | % | ±% | |
| Coalition Conservative | Col. George A. Gibbs | Unopposed | - | ||
| Majority | - | - | |||
| Coalition Conservative hold | Swing | ||||
See also
Notes and references
- ↑ "Electorate Figures - Boundary Commission for England". 2011 Electorate Figures. Boundary Commission for England. 4 March 2011. Retrieved 13 March 2011.
- ↑ 2.0 2.1 "Fifth Periodical Report" (PDF) 1. Boundary Commission for England. 26 February 2007. Retrieved 23 October 2010.
- ↑ 3.0 3.1 "Election 2010: Bristol West". BBC News (BBC). 7 May 2010. Retrieved 7 May 2010.
- ↑ Leigh Rayment's Historical List of MPs – Constituencies beginning with "B" (part 6)
- ↑ 5.0 5.1 5.2 5.3 5.4 5.5 "UK ELECTION RESULTS". electionresults.blogspot.co.uk.
- ↑ "UK Polling Report". ukpollingreport.co.uk.
- ↑ http://www.classwarparty.org.uk/the-candidates/
- ↑ McNamara, Stephen (20 April 2010). "Statement of Persons Nominated and Notice of Poll" (PDF). Acting Returning Officer, Bristol City Council. Retrieved 20 April 2010.
- ↑ "Politics Resources". Election 1992. Politics Resources. 9 April 1992. Retrieved 2010-12-06.