Brazilian general election, 2002
Brazilian general election, 2002

|
|
|
|
|
.svg.png)
|
| Presidential election results map after the second round of voting: Red denotes states won by Lula, and Blue denotes those won by Serra. |
|
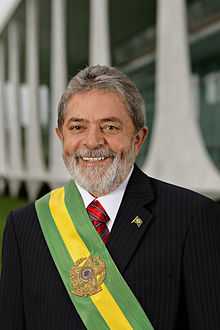
General elections were held in Brazil on 6 October 2002, with a second round on 27 October. After three failed attempts, Workers' Party leader Luiz Inácio Lula da Silva succeeded in a presidential election. Nevertheless, he did not manage to obtain the majority of valid votes in the first round; this led the presidential election to a second round, which Lula won with 52.7 million votes (61.3% of the total), becoming at the time the second most voted-for president in the world, after Ronald Reagan in the 1984 American presidential election.
Background
During the second term of the Fernando Henrique Cardoso administration, a serious economic crisis began in Brazil as an impact of the 1997 Asian financial crisis. Commencing shortly after the 1998 elections, when Cardoso was re-elected, as a currency crisis, it resulted in a decrease in growth and employment rates and a rise in public debt. In an environment of distrust and uncertainty for investment, many investors feared the measures that were going to be taken if a left-wing candidate won the election. As a matter of fact, when Lula would rise in the polls, the so-called "Brazil risk" index, which measures the confidence of investors in the country, would also rise. The media called this the "Lula risk", indicating that if Lula was to win the election, the economy would fail. Lula was then forced to sign a text that became known as Carta aos Brasileiros (Letter to the Brazilian people), promising that if he won the election, he would not change the economic policy of Brazil. Many in the left-wing saw this as a shift to the center from Lula and his Workers' Party, which openly defended a transition to socialist economy in the 1989 presidential election.
Results
President
Summary of the 6 October and 27 October 2002 Brazil presidential election results
| Candidates |
Votes |
% 1st round |
Votes |
% 2nd round |
| Luis Inácio Lula da Silva (PT, PL, PC do B, PMN, PCB, PV) |
39,436,099 |
46.4 |
52,772,475 |
61.3 |
| José Serra (PSDB, PMDB, PP, PFL) |
19,694,843 |
23.2 |
33,356,860 |
38.7 |
| Anthony Garotinho (PSB, PGT, PTC) |
15,176,204 |
17.9 |
- |
- |
| Ciro Gomes (PPS, PDT, PTB) |
10,166,324 |
12.0 |
- |
- |
| José Maria de Almeida (PSTU) |
402,236 |
0.5 |
- |
- |
| Rui Costa Pimenta (PCO) |
38,619 |
0.0 |
- |
- |
| Total (turnout 82.3 and 79.5 %) |
84,914,015 |
100 |
86,129,335 |
100 |
| Notes: party of the candidate, supporting parties, unofficial supporting parties |
| Source: Banco de Dados Eleitorais do Brasil |
Congress
Summary of the 6 October 2002 National Congress of Brazil election results
| Parties |
Chamber of Deputies |
Federal Senate |
| Votes |
% |
Seats |
% |
Total seats |
elected in 2002 |
| Workers' Party (Partido dos Trabalhadores) |
16,093,987 |
18.4 |
91 |
. |
14 |
10 |
| Brazilian Social Democracy Party (Partido da Social-Democracia Brasileira) |
12,534,774 |
14.3 |
71 |
. |
11 |
8 |
| Liberal Front Party (Partido da Frente Liberal) |
11,706,231 |
13.4 |
84 |
. |
19 |
14 |
| Brazilian Democratic Movement Party (Partido do Movimento Democrático Brasileiro) |
11,692,011 |
13.4 |
74 |
. |
19 |
9 |
| Progressive Party (Partido Progresista) |
6,840,041 |
7.8 |
49 |
. |
1 |
- |
| Brazilian Socialist Party (Partido Socialista Brasileiro) |
4,616,860 |
5.3 |
22 |
. |
4 |
3 |
| Democratic Labour Party (Partido Democrático Trabalhista) |
4,482,528 |
5.1 |
21 |
. |
5 |
4 |
| Brazilian Labour Party (Partido Trabalhista Brasileiro) |
4,052,107 |
4.6 |
26 |
. |
3 |
2 |
| Liberal Party (Partido Liberal) |
3,780,259 |
4.3 |
26 |
. |
3 |
2 |
| Socialist People's Party (Partido Popular Socialista) |
2,682,339 |
3.1 |
15 |
. |
1 |
1 |
| Communist Party of Brazil (Partido Comunista do Brasil) |
1,967,833 |
2.2 |
12 |
. |
- |
- |
| Party of the Reconstruction of the National Order (Partido da Reedificação da Ordem Nacional) |
1,804,655 |
2.1 |
6 |
. |
- |
- |
| Green Party (Partido Verde) |
1,182,364 |
1.4 |
5 |
. |
- |
- |
| Christian Social Party (Partido Social Cristão) |
504,611 |
0.6 |
1 |
. |
- |
- |
| Social Labour Party (Partido Social Trabalhista) |
504,044 |
0.6 |
3 |
. |
- |
- |
| Social Democratic Party (Partido Social Democrático) |
452,386 |
0.5 |
4 |
. |
1 |
1 |
| Social Liberal Party (Partido Social Liberal) |
408,512 |
0.5 |
1 |
. |
- |
- |
| Brazilian Labour Renewal Party (Partido Renovador Trabalhista Brasileiro) |
304,092 |
0.3 |
- |
. |
- |
- |
| Humanist Party of Solidarity (Partido Humanista de Solidaridade) |
294,920 |
0.3 |
- |
. |
- |
- |
| Party of National Mobilization (Partido da Mobilização Nacional) |
282,875 |
0.3 |
1 |
. |
- |
- |
| Progressive Republican Party (Partido Republicano Progresista) |
251,970 |
0.2 |
- |
. |
- |
- |
| General Party of the Workers (Partido Geral dos Trabalhadores) |
194,686 |
0.2 |
- |
. |
- |
- |
| Social Democratic Christian Party (Partido Social-Democrata Cristão) |
192,545 |
0.2 |
1 |
. |
- |
- |
| Labour Party of Brazil (Partido Trabalhista do Brasil ) |
168,639 |
0.2 |
- |
. |
- |
- |
| United Socialist Workers' Party (Partido Socialista dos Trabalhadores) |
159,251 |
0.2 |
- |
. |
- |
- |
| Party of the Nation's Retirees (Partido dos Aposentados da Naçao) |
126,663 |
0.1 |
- |
. |
- |
- |
| National Labour Party (Partido Trabalhista Nacional) |
118,471 |
0.1 |
- |
. |
- |
- |
| Christian Labour Party (Partido Trabalhista Cristão) |
74,955 |
0.1 |
- |
. |
- |
- |
| Brazilian Communist Party (Partido Comunista Brasileiro) |
45,963 |
0.1 |
- |
. |
- |
- |
| Party of the Working Class's Cause (Partido da Causa Operária) |
29,351 |
0.1 |
- |
. |
- |
- |
| Total (turnout 82.3 %) |
87,549,923 |
100 |
513 |
|
81 |
54 |
| Source: Banco de Dados Eleitorais do Brasil |
References


.svg.png)