Bolton Council election, 1991
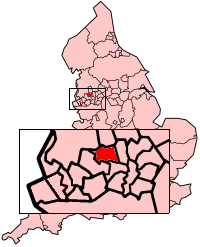
The Metropolitan Borough of Bolton shown within England
The 1991 Bolton Council election took place on 6 May 1991 to elect members of Bolton Metropolitan Borough Council in Greater Manchester, England. One third of the council was up for election and the Labour party kept overall control of the council.
20 seats were contested in the election: 12 were won by the Labour Party, 6 by the Conservative Party, 1 by the Liberal Democrats, and 1 by an Independent Labour candidate. After the election, the composition of the council was as follows:
- Labour 42
- Conservative 14
- Liberal Democrats 3
- Independent Labour 1
Election result
| Bolton Local Election Result 1991 | ||||||||||
|---|---|---|---|---|---|---|---|---|---|---|
| Party | Seats | Gains | Losses | Net gain/loss | Seats % | Votes % | Votes | +/− | ||
| Labour | 12 | 0 | 1 | -1 | 42.9 | 36,747 | -12.4 | |||
| Conservative | 6 | 0 | 0 | +0 | 34.9 | 29,841 | +9.7 | |||
| Liberal Democrat | 1 | 0 | 0 | +0 | 19.7 | 16,867 | +5.1 | |||
| Others | 1 | 1 | 0 | +1 | 2.5 | 2,140 | -2.4 | |||
Ward results
| Astley Bridge | |||||
|---|---|---|---|---|---|
| Party | Candidate | Votes | % | ±% | |
| Conservative | J Walsh | 3,072 | 55.0 | +9.4 | |
| Labour | M Clare | 1,981 | 35.5 | -11.3 | |
| Liberal Democrat | C Kay | 530 | 9.5 | +1.9 | |
| Majority | 1,092 | 19.6 | |||
| Turnout | 5,583 | 50.3 | -0.7 | ||
| Conservative hold | Swing | Labour to Con 10.3 | |||
| Blackrod | |||||
|---|---|---|---|---|---|
| Party | Candidate | Votes | % | ±% | |
| Labour | K Helsby | 2,129 | 46.8 | -18.4 | |
| Conservative | J Winnward | 1,395 | 30.6 | +7.4 | |
| Liberal Democrat | I Hamilton | 810 | 17.8 | +6.2 | |
| Independent | N Oliphant | 220 | 4.8 | +4.8 | |
| Majority | 734 | 16.1 | -25.9 | ||
| Turnout | 4,554 | 54.0 | -4.2 | ||
| Labour hold | Swing | Labour to Con 12.9 | |||
| Bradshaw | |||||
|---|---|---|---|---|---|
| Party | Candidate | Votes | % | ±% | |
| Conservative | E Crook | 2,598 | 53.1 | +9.6 | |
| Labour | J Byrne | 1,668 | 34.1 | -6.3 | |
| Liberal Democrat | R Steele | 623 | 12.7 | +3.7 | |
| Majority | 930 | 19.0 | +15.8 | ||
| Turnout | 4,889 | 44.0 | +2.3 | ||
| Conservative hold | Swing | Labour to Con 7.9 | |||
| Breightmet | |||||
|---|---|---|---|---|---|
| Party | Candidate | Votes | % | ±% | |
| Labour | D Grime | 2,320 | 55.6 | -12.1 | |
| Conservative | J Edge | 1,385 | 33.2 | +7.9 | |
| Liberal Democrat | S Ball | 468 | 11.2 | +5.2 | |
| Majority | 935 | 22.4 | -20.1 | ||
| Turnout | 4,173 | 38.2 | -5.5 | ||
| Labour hold | Swing | Labour to Con 10.0 | |||
| Bromley Cross | |||||
|---|---|---|---|---|---|
| Party | Candidate | Votes | % | ±% | |
| Conservative | A Wilkinson | 2,637 | 56.9 | +9.4 | |
| Labour | R Stones | 1,275 | 27.5 | -7.8 | |
| Liberal Democrat | C Atty | 722 | 15.6 | +8.4 | |
| Majority | 1,362 | 29.4 | +17.3 | ||
| Turnout | 4,634 | 44.4 | -2.2 | ||
| Conservative hold | Swing | Labour to Con 8.6 | |||
| Burnden | |||||
|---|---|---|---|---|---|
| Party | Candidate | Votes | % | ±% | |
| Labour | P Birch | 2,277 | 62.7 | +1.2 | |
| Conservative | J Cosgrave | 890 | 24.5 | +0.9 | |
| Liberal Democrat | P Howarth | 464 | 12.8 | +2.7 | |
| Majority | 1,387 | 38.2 | +0.3 | ||
| Turnout | 3,631 | 38.9 | -6.1 | ||
| Labour hold | Swing | ||||
| Central | |||||
|---|---|---|---|---|---|
| Party | Candidate | Votes | % | ±% | |
| Labour | J Sherrington | 2,286 | 67.4 | -8.4 | |
| Conservative | L Shepherd | 620 | 18.3 | +8.6 | |
| Liberal Democrat | S Howarth | 488 | 14.4 | +8.1 | |
| Majority | 1,666 | 49.1 | -17.1 | ||
| Turnout | 3,394 | 42.7 | -9.8 | ||
| Labour hold | Swing | Labour to Con 8.5 | |||
| Daubhill | |||||
|---|---|---|---|---|---|
| Party | Candidate | Votes | % | ±% | |
| Labour | M Donaghy | 2,316 | 64.0 | -9.5 | |
| Conservative | L Waterson | 871 | 24.1 | +5.4 | |
| Liberal Democrat | L Baron | 432 | 11.9 | +4.0 | |
| Majority | 1,445 | 39.9 | -14.9 | ||
| Turnout | 3,619 | 41.0 | -7.3 | ||
| Labour hold | Swing | Labour to Con 7.4 | |||
| Deane-cum-Heaton | |||||
|---|---|---|---|---|---|
| Party | Candidate | Votes | % | ±% | |
| Conservative | J Hanscomb | 3,431 | 55.5 | +5.3 | |
| Labour | J Gillatt | 1,962 | 31.7 | -5.8 | |
| Liberal Democrat | L Easterman | 715 | 11.6 | +3.6 | |
| Independent | J Strickland | 75 | 1.2 | +1.2 | |
| Majority | 1,469 | 23.7 | +13.0 | ||
| Turnout | 6,183 | 46.8 | -1.2 | ||
| Conservative hold | Swing | Labour to Con 5.5 | |||
| Derby | |||||
|---|---|---|---|---|---|
| Party | Candidate | Votes | % | ±% | |
| Labour | K Peters | 2,889 | 80.0 | +0.9 | |
| Conservative | F Tebbutt | 436 | 12.1 | +4.8 | |
| Liberal Democrat | C McPherson | 284 | 7.9 | +4.4 | |
| Majority | 2,453 | 68.0 | -1.0 | ||
| Turnout | 3,609 | 38.9 | -11.2 | ||
| Labour hold | Swing | ||||
| Farnworth | |||||
|---|---|---|---|---|---|
| Party | Candidate | Votes | % | ±% | |
| Independent Labour | W Hardman | 1,644 | 50.7 | +26.0 | |
| Labour | A Devlin | 927 | 28.6 | -28.6 | |
| Conservative | C Adams | 480 | 14.8 | +2.4 | |
| Liberal Democrat | L Sanderson | 191 | 5.9 | +2.6 | |
| Majority | 717 | 22.1 | |||
| Turnout | 3,242 | 34.8 | -14.2 | ||
| Independent Labour gain from Labour | Swing | Labour to Ind Labour 27.3 | |||
| Halliwell | |||||
|---|---|---|---|---|---|
| Party | Candidate | Votes | % | ±% | |
| Labour | C Morris | 2,491 | 59.9 | -5.7 | |
| Conservative | R Pryce | 848 | 20.4 | +6.9 | |
| Liberal Democrat | J Radlett | 817 | 19.7 | +6.2 | |
| Majority | 1,643 | 39.5 | -12.6 | ||
| Turnout | 4,156 | 43.6 | -7.0 | ||
| Labour hold | Swing | Labour to Con 6.3 | |||
| Harper Green | |||||
|---|---|---|---|---|---|
| Party | Candidate | Votes | % | ±% | |
| Labour | C Dennis | 2,350 | 64.5 | -9.9 | |
| Conservative | P Cummins | 698 | 19.2 | +3.4 | |
| Liberal Democrat | P Barnett | 593 | 16.3 | +6.5 | |
| Majority | 1,652 | 45.4 | -13.3 | ||
| Turnout | 3,641 | 35.2 | -6.8 | ||
| Labour hold | Swing | Labour to LD 8.2 | |||
| Horwich | |||||
|---|---|---|---|---|---|
| Party | Candidate | Votes | % | ±% | |
| Labour | B McCracken | 2,384 | 38.7 | -6.9 | |
| Liberal Democrat | B Ronson | 2,192 | 35.6 | +2.7 | |
| Conservative | M Perks | 1,589 | 25.8 | +7.3 | |
| Majority | 192 | 3.1 | -9.5 | ||
| Turnout | 6,165 | 54.0 | -1.6 | ||
| Labour hold | Swing | Labour to Con 7.1 | |||
| Hulton Park | |||||
|---|---|---|---|---|---|
| Party | Candidate | Votes | % | ±% | |
| Conservative | G Smith | 2,647 | 50.8 | +11.4 | |
| Labour | T Hyams | 1,583 | 30.4 | -15.5 | |
| Liberal Democrat | D Wilkinson | 977 | 18.8 | +4.1 | |
| Majority | 1,064 | 20.4 | |||
| Turnout | 5,207 | 44.6 | -1.1 | ||
| Conservative hold | Swing | Labour to Con 13.4 | |||
| Kearsley | |||||
|---|---|---|---|---|---|
| Party | Candidate | Votes | % | ±% | |
| Labour | P Spencer | 2,132 | 51.3 | -10.1 | |
| Liberal Democrat | J Rothwell | 1,450 | 34.9 | +4.2 | |
| Conservative | P Briscoe | 570 | 13.7 | +3.7 | |
| Majority | 682 | 16.4 | |||
| Turnout | 4,152 | 41.9 | -5.7 | ||
| Labour hold | Swing | Labour to LD 7.1 | |||
| Little Lever | |||||
|---|---|---|---|---|---|
| Party | Candidate | Votes | % | ±% | |
| Conservative | D Dziubas | 2,166 | 47.9 | +13.3 | |
| Labour | R Evans | 1,849 | 40.9 | -17.9 | |
| Liberal Democrat | W Crook | 504 | 11.2 | +4.6 | |
| Majority | 317 | 7.0 | |||
| Turnout | 4,519 | 48.0 | -7.4 | ||
| Conservative hold | Swing | Labour to Con 15.6 | |||
| Smithills | |||||
|---|---|---|---|---|---|
| Party | Candidate | Votes | % | ±% | |
| Liberal | J Higson | 2,686 | 55.7 | +14.9 | |
| Conservative | G Gibson | 1,296 | 26.9 | +4.3 | |
| Labour | A Page | 637 | 13.2 | -10.9 | |
| Independent | S Graeme | 201 | 4.2 | -2.1 | |
| Majority | 1,390 | 28.8 | -13.6 | ||
| Turnout | 4,820 | 55.2 | -3.4 | ||
| Liberal Democrat hold | Swing | Labour to LD 12.9 | |||
| Tonge | |||||
|---|---|---|---|---|---|
| Party | Candidate | Votes | % | ±% | |
| Labour | P Perry | 1,906 | 46.8 | -11.3 | |
| Conservative | P Hamer | 1,180 | 29.0 | +4.4 | |
| Liberal Democrat | B Dunning | 987 | 24.2 | +6.9 | |
| Majority | 726 | 17.8 | -15.7 | ||
| Turnout | 4,073 | 46.0 | -6.4 | ||
| Labour hold | Swing | Labour to LD 9.1 | |||
| Westhoughton | |||||
|---|---|---|---|---|---|
| Party | Candidate | Votes | % | ±% | |
| Labour | P Finch | 1,366 | 39.9 | -11.1 | |
| Conservative | G Twist | 1,032 | 30.1 | +16.5 | |
| Liberal Democrat | P Mather | 1,027 | 30.0 | -5.5 | |
| Majority | 334 | 9.7 | -5.8 | ||
| Turnout | 3,425 | 44.0 | -2.3 | ||
| Labour hold | Swing | Labour to Con 13.8 | |||
References
| ||||||||||||||
| ||||||||||||||||||||||||||||||||||||||||||||||