Body mass index
The body mass index (BMI), or Quetelet index, is a value derived from the mass (weight) and height of an individual. The BMI is defined as the body mass divided by the square of the body height, and is universally expressed in units of kg/m2, resulting from weight in kilograms and height in metres. If pounds and inches are used, a conversion factor of 703 (kg/m2)/(lb/in2) must be applied. When the term BMI is used informally, the units are usually omitted.

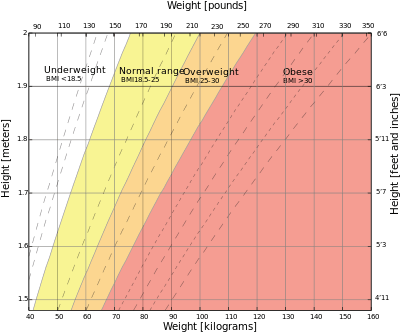
The BMI may also be determined using a table[note 1] or chart which displays BMI as a function of mass and height using contour lines or colors for different BMI categories, and may use two different units of measurement.[note 2]
The BMI is an attempt to quantify the amount of tissue mass (muscle, fat, and bone) in an individual, and then categorize that person as underweight, normal weight, overweight, or obese based on that value. However, there is some debate about where on the BMI scale the dividing lines between categories should be placed.[2] Commonly accepted BMI ranges are underweight: under 18.5, normal weight: 18.5 to 25, overweight: 25 to 30, obese: over 30.
There are criticisms of using the BMI to define obesity in individuals. One is that the BMI was designed for population studies, not individuals. Another is that body fat percentage (BFP) is a more reliable indicator of obesity than BMI: very muscular, lean (low body fat) individuals can be classified as obese using BMI, but are classified as having a normal weight using BFP. An even simpler alternative to the BMI is to define obese individuals as those with a ratio of waist circumference to height of greater than 50%, indicating excess intra-abdomimal fat.
Usage
The index was devised by Adolphe Quetelet from 1830 to 1850 during which time he developed what he called "social physics".[3] The modern term "body mass index" (BMI) for the ratio of weight to squared height owes its popularity to a paper published in the July 1972 edition of the Journal of Chronic Diseases by Ancel Keys. This found the BMI to be the best proxy for body fat percentage among ratios of weight and height.[4][5] The interest in an index that measures body fat came with increasing obesity in prosperous Western societies. BMI was explicitly cited by Keys as appropriate for population studies and inappropriate for individual evaluation. Nevertheless, due to its simplicity, it has come to be widely used for preliminary diagnosis.[6] Additional metrics, such as waist circumference, can be more useful.[7]
BMI ranges from underweight to obese and is commonly employed among children and adults to predict health outcomes. The BMI trait is influenced by both genetic and non-genetic factors, and it provides a paradigm to understand and estimate the risk factors for health problems.[8]
BMI provides a simple numeric measure of a person's thickness or thinness, allowing health professionals to discuss weight problems more objectively with their patients. BMI was designed to be used as a simple means of classifying average sedentary (physically inactive) populations, with an average body composition.[9] For these individuals, the current value recommendations are as follow: a BMI from 18.5 up to 25 may indicate optimal weight, a BMI lower than 18.5 suggests the person is underweight, a number from 25 up to 30 may indicate the person is overweight, and a number from 30 upwards suggests the person is obese.[6][7] Many (e.g. gymnists, basketball and soccer players) but not all (e.g. football linemen) athletes have a high muscle to fat ratio and may have a BMI that is misleading high relative to their body fat percentage.[7]
Scalability
BMI is proportional to mass and inversely proportional to the square of the height. So, if all body dimensions double, and mass scales naturally with the cube of the height, then BMI doubles instead of remaining the same. This results in taller people having a reported BMI that is uncharacteristically high, compared to their actual body fat levels. In comparison, the Ponderal index is based on the natural scaling of mass with the third power of the height. However, many taller people are not just "scaled up" short people but tend to have narrower frames in proportion to their height. Nick Korevaar (a mathematics lecturer from the University of Utah) suggests that instead of squaring the body height (as the BMI does) or cubing the body height (as the Ponderal index does), it would be more appropriate to use an exponent of between 2.3 and 2.7[10] (as originally noted by Quetelet). (For a theoretical basis for such values see MacKay.[11])
BMI Prime
BMI Prime, a simple modification of the BMI system, is the ratio of actual BMI to upper limit BMI (currently defined at BMI 25). As defined, BMI Prime is also the ratio of body weight to upper body-weight limit, calculated at BMI 25. Since it is the ratio of two separate BMI values, BMI Prime is a dimensionless number without associated units. Individuals with BMI Prime less than 0.74 are underweight; those with between 0.74 and 1.00 have optimal weight; and those at 1.00 or greater are overweight. BMI Prime is useful clinically because individuals can tell, at a glance, by what percentage they deviate from their upper weight limits. For instance, a person with BMI 34 has a BMI Prime of 34/25 = 1.36, and is 36% over his or her upper mass limit. In South East Asian and South Chinese populations (see international variation section below), BMI Prime should be calculated using an upper limit BMI of 23 in the denominator instead of 25. Nonetheless, BMI Prime allows easy comparison between populations whose upper-limit BMI values differ.[12]
Categories
A frequent use of the BMI is to assess how much an individual's body weight departs from what is normal or desirable for a person of his or her height. The weight excess or deficiency may, in part, be accounted for by body fat (adipose tissue) although other factors such as muscularity also affect BMI significantly (see discussion below and overweight). The WHO regards a BMI of less than 18.5 as underweight and may indicate malnutrition, an eating disorder, or other health problems, while a BMI greater than 25 is considered overweight and above 30 is considered obese.[1] These ranges of BMI values are valid only as statistical categories
| Category | BMI range – kg/m2 | BMI Prime |
|---|---|---|
| Very severely underweight | less than 15 | less than 0.60 |
| Severely underweight | from 15.0 to 16.0 | from 0.60 to 0.64 |
| Underweight | from 16.0 to 18.5 | from 0.64 to 0.74 |
| Normal (healthy weight) | from 18.5 to 25 | from 0.74 to 1.0 |
| Overweight | from 25 to 30 | from 1.0 to 1.2 |
| Obese Class I (Moderately obese) | from 30 to 35 | from 1.2 to 1.4 |
| Obese Class II (Severely obese) | from 35 to 40 | from 1.4 to 1.6 |
| Obese Class III (Very severely obese) | over 40 | over 1.6 |
BMI in Children (aged 2 to 20)
 BMI for age percentiles for boys 2 to 20 years of age. |
BMI is used differently for children. It is calculated in the same way as for adults, but then compared to typical values for other children of the same age. Instead of comparison against fixed thresholds for underweight and overweight, the BMI is compared against the percentile for children of the same gender and age.[13]
A BMI that is less than the 5th percentile is considered underweight and above the 95th percentile is considered obese. Children with a BMI between the 85th and 95th percentile are considered to be overweight.
Recent studies in Britain have indicated that females between the ages 12 and 16 have a higher BMI than males of the same age by 1.0 kg/m2 on average.[14]
International variations
These recommended distinctions along the linear scale may vary from time to time and country to country, making global, longitudinal surveys problematic.
Hong Kong
The Hospital Authority of Hong Kong recommends the use of the following BMI ranges:[15]
| Category | BMI range—kg/m2 |
|---|---|
| Underweight | < 18.5 |
| Normal Range | 18.5–22.9 |
| Overweight—At Risk | 23.0–24.9 |
| Overweight—Moderately Obese | 25.0–29.9 |
| Overweight—Severely Obese | ≥ 30.0 |
Japan
Japan Society for the Study of Obesity (2000):[16]
| Category | BMI range – kg/m2 |
|---|---|
| Low | 18.5 and below |
| Normal | from 18.5 to 25.0 (Standard weight is 22) |
| Obese (Level 1) | from 25.0 to 30.0 |
| Obese (Level 2) | from 30.0 to 35.0 |
| Obese (Level 3) | from 35.0 to 40.0 |
| Obese (Level 4) | 40.0 and above |
Singapore
In Singapore, the BMI cut-off figures were revised in 2005, motivated by studies showing that many Asian populations, including Singaporeans, have higher proportion of body fat and increased risk for cardiovascular diseases and diabetes mellitus, compared with Caucasians at the same BMI. The BMI cut-offs are presented with an emphasis on health risk rather than weight.[18]
| BMI range – kg/m2 | Health Risk |
|---|---|
| 18.4 and below | Risk of developing problems such as nutritional deficiency and osteoporosis |
| 18.5 to 22.9 | Low Risk (healthy range) |
| 23.0 to 27.4 | Moderate risk of developing heart disease, high blood pressure, stroke, diabetes |
| 27.5 and above | High risk of developing heart disease, high blood pressure, stroke, diabetes |
United States
In 1998, the U.S. National Institutes of Health and the Centers for Disease Control and Prevention brought U.S. definitions in line with World Health Organization guidelines, lowering the normal/overweight cut-off from BMI 27.8 to BMI 25. This had the effect of redefining approximately 29 million Americans, previously healthy to overweight.[19] This can partially explain the increase in the overweight diagnosis in the past 20 years, and the increase in sales of the weight loss products during the same time. WHO also recommends lowering the normal/overweight threshold for South East Asian body types to around BMI 23, and expects further revisions to emerge from clinical studies of different body types.
The U.S. National Health and Nutrition Examination Survey of 1994 indicated that 59% of American men and 49% of women had BMIs over 25. Morbid obesity—a BMI of 40 or more—was found in 2% of the men and 4% of the women. The newest survey in 2007 indicates a continuation of the increase in BMI: 63% of Americans are overweight or obese, with 26% now in the obese category (a BMI of 30 or more). There are differing opinions on the threshold for being underweight in females; doctors quote anything from 18.5 to 20 as being the lowest index, the most frequently stated being 19. A BMI nearing 15 is usually used as an indicator for starvation and the health risks involved, with a BMI less than 17.5 being an informal criterion for the diagnosis of anorexia nervosa.
| Body Mass Index values for males and females aged 20 and over, and selected percentiles by age: United States, 2007–2010. Source: "Anthropometric Reference Data for Children and Adults: United States" from CDC DHHS[20] | ||||||||||
|---|---|---|---|---|---|---|---|---|---|---|
| Age | Percentile | |||||||||
| 5th | 10th | 15th | 25th | 50th | 75th | 85th | 90th | 95th | ||
| Men BMI – kg/m2 | ||||||||||
| 20 years and over | 20.7 | 22.2 | 23.2 | 24.7 | 27.8 | 31.5 | 33.9 | 35.8 | 39.2 | |
| 20–29 years | 19.4 | 20.7 | 21.4 | 22.9 | 25.6 | 29.9 | 32.3 | 33.8 | 36.5 | |
| 30–39 years | 21.0 | 22.4 | 23.3 | 24.9 | 28.1 | 32.0 | 34.1 | 36.2 | 40.5 | |
| 40–49 years | 21.2 | 22.9 | 24.0 | 25.4 | 28.2 | 31.7 | 34.4 | 36.1 | 39.6 | |
| 50–59 years | 21.5 | 22.9 | 23.9 | 25.5 | 28.2 | 32.0 | 34.5 | 37.1 | 39.9 | |
| 60–69 years | 21.3 | 22.7 | 23.8 | 25.3 | 28.8 | 32.5 | 34.7 | 37.0 | 40.0 | |
| 70–79 years | 21.4 | 22.9 | 23.8 | 25.6 | 28.3 | 31.3 | 33.5 | 35.4 | 37.8 | |
| 80 years and over | 20.7 | 21.8 | 22.8 | 24.4 | 27.0 | 29.6 | 31.3 | 32.7 | 34.5 | |
| Age | Women BMI – kg/m2 | |||||||||
| 20 years and over | 19.5 | 20.7 | 21.7 | 23.3 | 27.3 | 32.5 | 36.1 | 38.2 | 42.0 | |
| 20–29 years | 18.8 | 19.9 | 20.6 | 21.7 | 25.3 | 31.5 | 36.0 | 38.0 | 43.9 | |
| 30–39 years | 19.4 | 20.6 | 21.6 | 23.4 | 27.2 | 32.8 | 36.0 | 38.1 | 41.6 | |
| 40–49 years | 19.3 | 20.6 | 21.7 | 23.3 | 27.3 | 32.4 | 36.2 | 38.1 | 43.0 | |
| 50–59 years | 19.7 | 21.3 | 22.1 | 24.0 | 28.3 | 33.5 | 36.4 | 39.3 | 41.8 | |
| 60–69 years | 20.7 | 21.6 | 23.0 | 24.8 | 28.8 | 33.5 | 36.6 | 38.5 | 41.1 | |
| 70–79 years | 20.1 | 21.6 | 22.7 | 24.7 | 28.6 | 33.4 | 36.3 | 38.7 | 42.1 | |
| 80 years and over | 19.3 | 20.7 | 22.0 | 23.1 | 26.3 | 29.7 | 31.6 | 32.5 | 35.2 | |
Consequences of elevated level in adults
The BMI ranges are based on the relationship between body weight and disease and death.[21] Overweight and obese individuals are at an increased risk for the following diseases:[22]
- Hypertension
- Dyslipidemia
- Type 2 diabetes
- Coronary heart disease
- Stroke
- Gallbladder disease
- Osteoarthritis
- Sleep apnea
- At least 10 cancers, including endometrial, breast, and colon cancer.[23]
- Epidural Lipomatosis [24]
However recent research has shown that those classified as overweight, having a BMI between 25 and 29.9, show lower overall mortality than all other categories.[25]
Applications
Public health
The BMI is generally used as a means of correlation between groups related by general mass and can serve as a vague means of estimating adiposity. The duality of the BMI is that, while it is easy to use as a general calculation, it is limited as to how accurate and pertinent the data obtained from it can be. Generally, the index is suitable for recognizing trends within sedentary or overweight individuals because there is a smaller margin of error.[26] The BMI has been used by the WHO as the standard for recording obesity statistics since the early 1980s.
This general correlation is particularly useful for consensus data regarding obesity or various other conditions because it can be used to build a semi-accurate representation from which a solution can be stipulated, or the RDA for a group can be calculated. Similarly, this is becoming more and more pertinent to the growth of children, due to the fact that the majority of children are sedentary.[27]
Clinical practice
BMI categories are generally regarded as a satisfactory tool for measuring whether sedentary individuals are underweight, overweight or obese with various exceptions, such as: athletes, children, the elderly, and the infirm. Also, the growth of a child is documented against a BMI-measured growth chart. Obesity trends can then be calculated from the difference between the child's BMI and the BMI on the chart. In the United States, BMI is also used as a measure of underweight, owing to advocacy on behalf of those with eating disorders, such as anorexia nervosa and bulimia nervosa.
Legislation
In France, Israel, Italy and Spain, legislation has been introduced banning usage of fashion show models having a BMI below 18.[28] In Israel, a BMI below 18.5 is banned.[29] This is done in order to fight anorexia among models and people interested in fashion.
Limitations

The medical establishment[31] and statistical community[32] have both highlighted the limitations of BMI. Mathematician Keith Devlin and the restaurant industry association Center for Consumer Freedom argue that the error in the BMI is significant and so pervasive that it is not generally useful in evaluation of health.[33][34] University of Chicago political science professor Eric Oliver says BMI is a convenient but inaccurate measure of weight, forced onto the populace, and should be revised.[35]
Ignores scaling law
Because the BMI depends upon weight and the square of height, it ignores the basic scaling law which states that mass increases to the 3rd power of linear dimensions. Hence, larger individuals, even if they had exactly the same body shape and relative composition, always have a larger BMI.[36]
Ignores variation in physical characteristics
BMI also does not account for body frame size; a person may have a small frame and be carrying more fat than optimal, but their BMI reflects that they are normal. Conversely, a large framed individual may be quite healthy with a fairly low body fat percentage, but be classified as overweight by BMI. Accurate frame size calculators use several measurements (wrist circumference, elbow width, neck circumference and others) to determine what category an individual falls into for a given height. The standard is to use frame size in conjunction with ideal height/weight charts and add roughly 10% for a large frame or subtract roughly 10% for a smaller frame. For example, a chart may say the ideal weight for a man 5 ft 10 in (178 cm) is 165 pounds (75 kg). But if that man has a slender build (small frame), he may be overweight at 165 pounds (75 kg) and should reduce by 10%, to roughly 150 pounds (68 kg). In the reverse, the man with a larger frame and more solid build can be quite healthy at 180 pounds (82 kg). If one teeters on the edge of small/medium or medium/large, a dose of common sense should be used in calculating their ideal weight. However, falling into your ideal weight range for height and build is still not as accurate in determining health risk factors as waist/height ratio and actual body fat percentage.
It also does not differentiate between short-limbed long-torsoed individuals who generally have more lean weight than average and short-torsoed, long-limbed people from hotter climates who generally have less lean weight than average. BMI was only meant to be used on groups of people and is off as a measure of fitness in at least 8% of individuals. Response: Does the Romero-Corral citation provide a WP:RS answer? --
The BMI also fails to take into account loss of height through aging. In this situation, BMI will increase without any corresponding increase in weight.
Denominator is arbitrary
The exponent of 2 in the denominator of the formula for BMI is arbitrary. It is meant to reduce variability in the BMI associated only with a difference in size, rather than with differences in weight relative to one's ideal weight. If taller people were simply scaled-up versions of shorter people, the appropriate exponent would be 3, as weight would increase with the cube of height. However, on average, taller people have a slimmer build relative to their height than do shorter people, and the exponent which matches the variation best is less than 3. An analysis based on data gathered in the US suggested an exponent of 2.6 would yield the best fit for children aged 2 to 19 years old.[10] For US adults, exponent estimates range from 1.92 to 1.96 for males and from 1.45 to 1.95 for females.[37][38] The exponent 2 is used by convention and for simplicity.
Does not differentiate between muscle mass and fat mass
Assumptions about the distribution between muscle mass and fat mass are inexact. BMI generally overestimates adiposity on those with more lean body mass (e.g., athletes) and underestimates excess adiposity on those with less lean body mass. A study in June 2008 by Romero-Corral et al. examined 13,601 subjects from the United States' third National Health and Nutrition Examination Survey (NHANES III) and found that BMI-defined obesity (BMI > 30) was present in 21% of men and 31% of women. Using body fat percentages (BF%), however, BF%-defined obesity was found in 50% of men and 62% of women. While BMI-defined obesity showed high specificity (95% for men and 99% for women), BMI showed poor sensitivity (36% for men and 49% for women). Despite this undercounting of obesity by BMI, BMI values in the intermediate BMI range of 20–30 were found to be associated with a wide range of body fat percentages. For men with a BMI of 25, about 20% have a body fat percentage below 20% and about 10% have body fat percentage above 30%.[30]
BMI is particularly inaccurate for people who are very fit or athletic, as their high muscle mass can classify them in the overweight category by BMI, even though their body fat percentages frequently fall in the 10–15% category, which is below that of a more sedentary person of average build who has a normal BMI number. Body composition for athletes is often better calculated using measures of body fat, as determined by such techniques as skinfold measurements or underwater weighing and the limitations of manual measurement have also led to new, alternative methods to measure obesity, such as the body volume index. However, recent studies of American football linemen who undergo intensive weight training to increase their muscle mass show that they frequently suffer many of the same problems as people ordinarily considered obese, notably sleep apnea.[39][40]
Variation in definitions of categories
It is not clear where on the BMI scale the threshold for overweight and obese should be set. Because of this the standards have varied over the past few decades. Between 1980 and 2000 the U.S. Dietary Guidelines have defined overweight at a variety of levels ranging from a BMI of 24.9 to 27.1. In 1985 the National Institutes of Health (NIH) consensus conference recommended that overweight BMI be set at a BMI of 27.8 for men and 27.3 for women. In 1998 a NIH report concluded that a BMI over 25 is overweight and a BMI over 30 is obese.[41] In the 1990s the World Health Organization (WHO) decided that a BMI of 25 to 30 should be considered overweight and a BMI over 30 is obese, the standards the NIH set. This became the definitive guide for determining if someone is overweight.
The current WHO and NIH ranges of normal weights are proved to be associated with decreased risks of some diseases such as diabetes type II; however using the same range of BMI for men and women is considered arbitrary, and makes the definition of underweight quite unsuitable for men.[42]
Variation in relationship to health
A study published by Journal of the American Medical Association (JAMA) in 2005 showed that overweight people had a similar relative risk of mortality to normal weight people as defined by BMI, while underweight and obese people had a higher death rate.[43]
High BMI is associated with type 2 diabetes only in persons with high serum gamma-glutamyl transpeptidase.[44]
In an analysis of 40 studies involving 250,000 people, patients with coronary artery disease with normal BMIs were at higher risk of death from cardiovascular disease than people whose BMIs put them in the overweight range (BMI 25–29.9).[45]
In the overweight, or intermediate, range of BMI (25–29.9), the study found that BMI failed to discriminate between bodyfat percentage and lean mass. The study concluded that "the accuracy of BMI in diagnosing obesity is limited, particularly for individuals in the intermediate BMI ranges, in men and in the elderly. These results may help to explain the unexpected better survival in overweight/mild obese patients."[30]
A 2010 study that followed 11,000 subjects for up to eight years concluded that BMI is not a good measure for the risk of heart attack, stroke or death. A better measure was found to be the waist-to-height ratio.[46] A 2011 study that followed 60,000 participants for up to 13 years found that waist–hip ratio was a better predictor of ischaemic heart disease mortality.[47]
Alternatives
As a possible alternative to BMI, the concepts fat-free mass index (FFMI) and fat mass index (FMI) were introduced in the early 1990s,[48] and Body Shape Index in 2012.
Global statistics
Researchers at the London School of Hygiene & Tropical Medicine calculated the average BMI for 177 countries using UN data on population, WHO estimates of global weight, and mean height from national health examination surveys.[49]
| Country | Average BMI[note 3] | Relative size of average BMI | Male BMI | Relative size of male BMI | Female BMI | Relative size of female BMI | Ratio of male to female BMI | Relative size of ratio |
|---|---|---|---|---|---|---|---|---|
| Afghanistan | 21.01 | | 21.36 | | 20.65 | | 1.034 | |
| Albania | 24.53 | | 27.60 | | 21.45 | | 1.287 | |
| Algeria | 23.87 | | 24.38 | | 23.36 | | 1.044 | |
| Angola | 22.73 | | 23.24 | | 22.22 | | 1.046 | |
| Argentina | 26.44 | | 27.76 | | 25.11 | | 1.106 | |
| Armenia | 24.26 | | 25.72 | | 22.80 | | 1.128 | |
| Australia | 26.10 | | 27.24 | | 24.95 | | 1.092 | |
| Austria | 25.00 | | 26.97 | | 23.03 | | 1.171 | |
| Azerbaijan | 24.65 | | 26.21 | | 23.08 | | 1.136 | |
| Bahamas | 27.09 | | 27.60 | | 26.57 | | 1.039 | |
| Bahrain | 26.33 | | 27.97 | | 24.69 | | 1.133 | |
| Bangladesh | 20.32 | | 21.00 | | 19.63 | | 1.070 | |
| Barbados | 27.70 | | 26.84 | | 28.55 | | 0.940 | |
| Belarus | 26.72 | | 26.32 | | 27.11 | | 0.971 | |
| Belgium | 24.15 | | 25.93 | | 22.36 | | 1.160 | |
| Belize | 26.09 | | 26.60 | | 25.58 | | 1.040 | |
| Benin | 22.48 | | 22.52 | | 22.43 | | 1.004 | |
| Bhutan | 20.37 | | 20.88 | | 19.85 | | 1.052 | |
| Bolivia | 25.86 | | 26.07 | | 25.65 | | 1.016 | |
| Bosnia and Herzegovina | 23.94 | | 26.18 | | 21.69 | | 1.207 | |
| Botswana | 24.45 | | 24.96 | | 23.94 | | 1.043 | |
| Brazil | 24.79 | | 25.85 | | 23.72 | | 1.090 | |
| Brunei | 22.67 | | 23.18 | | 22.16 | | 1.046 | |
| Bulgaria | 23.77 | | 26.53 | | 21.01 | | 1.263 | |
| Burkina Faso | 21.25 | | 21.86 | | 20.64 | | 1.059 | |
| Burundi | 20.40 | | 20.91 | | 19.89 | | 1.051 | |
| Cambodia | 21.51 | | 22.30 | | 20.72 | | 1.076 | |
| Cameroon | 24.70 | | 26.65 | | 22.75 | | 1.171 | |
| Canada | 25.70 | | 27.04 | | 24.36 | | 1.110 | |
| Cape Verde | 23.44 | | 23.95 | | 22.93 | | 1.044 | |
| Central African Republic | 20.99 | | 20.97 | | 21.01 | | 0.998 | |
| Chad | 21.42 | | 22.04 | | 20.80 | | 1.060 | |
| Chile | 26.05 | | 25.94 | | 26.15 | | 0.992 | |
| China | 22.86 | | 23.78 | | 21.93 | | 1.084 | |
| Colombia | 24.94 | | 26.30 | | 23.58 | | 1.115 | |
| Comoros | 22.99 | | 23.39 | | 22.59 | | 1.035 | |
| Congo | 21.91 | | 22.30 | | 21.52 | | 1.036 | |
| Costa Rica | 24.87 | | 26.06 | | 23.68 | | 1.101 | |
| Côte d'Ivoire | 22.03 | | 21.64 | | 22.42 | | 0.965 | |
| Croatia | 26.61 | | 30.21 | | 23.00 | | 1.313 | |
| Cuba | 25.64 | | 26.78 | | 24.49 | | 1.094 | |
| Cyprus | 26.70 | | 27.21 | | 26.18 | | 1.039 | |
| Czech Republic | 23.78 | | 26.50 | | 21.06 | | 1.258 | |
| Denmark | 24.24 | | 25.75 | | 22.73 | | 1.133 | |
| Djibouti | 22.96 | | 23.47 | | 22.44 | | 1.046 | |
| Dominican Republic | 25.45 | | 25.55 | | 25.34 | | 1.008 | |
| DR Congo | 20.25 | | 20.76 | | 19.74 | | 1.052 | |
| East Timor | 20.72 | | 21.23 | | 20.20 | | 1.051 | |
| Ecuador | 25.58 | | 26.09 | | 25.06 | | 1.041 | |
| Egypt | 26.70 | | 27.14 | | 26.25 | | 1.034 | |
| El Salvador | 25.80 | | 26.31 | | 25.28 | | 1.041 | |
| Equatorial Guinea | 24.75 | | 25.26 | | 24.24 | | 1.042 | |
| Eritrea | 19.85 | | 20.27 | | 19.43 | | 1.043 | |
| Estonia | 23.06 | | 25.21 | | 20.90 | | 1.206 | |
| Ethiopia | 20.46 | | 20.97 | | 19.94 | | 1.052 | |
| Fiji | 24.99 | | 25.25 | | 24.72 | | 1.021 | |
| Finland | 25.06 | | 26.76 | | 23.36 | | 1.146 | |
| France | 23.56 | | 24.90 | | 22.22 | | 1.121 | |
| Gabon | 23.40 | | 23.75 | | 23.05 | | 1.030 | |
| Gambia | 21.73 | | 21.94 | | 21.52 | | 1.020 | |
| Georgia | 25.27 | | 25.78 | | 24.75 | | 1.042 | |
| Germany | 25.32 | | 27.17 | | 23.46 | | 1.158 | |
| Ghana | 23.15 | | 24.64 | | 21.65 | | 1.138 | |
| Greece | 26.13 | | 27.68 | | 24.57 | | 1.127 | |
| Grenada | 26.43 | | 26.94 | | 25.91 | | 1.040 | |
| Guatemala | 25.88 | | 26.42 | | 25.34 | | 1.043 | |
| Guinea | 22.06 | | 22.41 | | 21.71 | | 1.032 | |
| Guinea-Bissau | 21.04 | | 21.55 | | 20.53 | | 1.050 | |
| Guyana | 25.10 | | 25.61 | | 24.59 | | 1.041 | |
| Haiti | 23.12 | | 22.21 | | 24.03 | | 0.924 | |
| Honduras | 25.12 | | 25.63 | | 24.61 | | 1.041 | |
| Hungary | 24.45 | | 26.50 | | 22.39 | | 1.184 | |
| Iceland | 25.93 | | 26.80 | | 25.06 | | 1.069 | |
| India | 21.05 | | 22.50 | | 19.60 | | 1.148 | |
| Indonesia | 21.59 | | 21.91 | | 21.26 | | 1.031 | |
| Iran | 24.28 | | 25.21 | | 23.35 | | 1.080 | |
| Iraq | 24.53 | | 25.04 | | 24.01 | | 1.043 | |
| Ireland | 24.40 | | 26.14 | | 22.65 | | 1.154 | |
| Israel | 25.05 | | 26.72 | | 23.37 | | 1.143 | |
| Italy | 23.49 | | 25.78 | | 21.19 | | 1.217 | |
| Jamaica | 26.21 | | 24.82 | | 27.60 | | 0.899 | |
| Japan | 21.93 | | 23.52 | | 20.34 | | 1.156 | |
| Jordan | 25.09 | | 26.65 | | 23.52 | | 1.133 | |
| Kazakhstan | 22.99 | | 25.02 | | 20.96 | | 1.194 | |
| Kenya | 21.41 | | 21.59 | | 21.23 | | 1.017 | |
| Kuwait | 27.92 | | 28.77 | | 27.07 | | 1.063 | |
| Kyrgyzstan | 22.90 | | 23.99 | | 21.80 | | 1.100 | |
| Laos | 21.99 | | 22.50 | | 21.48 | | 1.047 | |
| Latvia | 23.73 | | 25.38 | | 22.07 | | 1.150 | |
| Lebanon | 24.57 | | 26.60 | | 22.54 | | 1.180 | |
| Lesotho | 24.56 | | 22.96 | | 26.16 | | 0.878 | |
| Liberia | 21.00 | | 21.51 | | 20.49 | | 1.050 | |
| Libya | 26.06 | | 26.57 | | 25.55 | | 1.040 | |
| Lithuania | 24.29 | | 26.44 | | 22.14 | | 1.194 | |
| Luxembourg | 25.06 | | 25.60 | | 24.51 | | 1.044 | |
| Macedonia | 23.81 | | 24.25 | | 23.36 | | 1.038 | |
| Madagascar | 21.60 | | 22.31 | | 20.89 | | 1.068 | |
| Malawi | 21.96 | | 22.02 | | 21.90 | | 1.005 | |
| Malaysia | 22.58 | | 23.06 | | 22.09 | | 1.044 | |
| Maldives | 22.21 | | 23.54 | | 20.88 | | 1.127 | |
| Mali | 22.18 | | 22.11 | | 22.24 | | 0.994 | |
| Malta | 26.04 | | 27.91 | | 24.17 | | 1.155 | |
| Mauritania | 23.74 | | 24.17 | | 23.30 | | 1.037 | |
| Mauritius | 24.46 | | 25.05 | | 23.87 | | 1.049 | |
| Mexico | 26.54 | | 27.70 | | 25.37 | | 1.092 | |
| Micronesia | 32.82 | | 32.80 | | 32.84 | | 0.999 | |
| Moldova | 25.24 | | 25.75 | | 24.73 | | 1.041 | |
| Mongolia | 25.94 | | 24.78 | | 27.10 | | 0.914 | |
| Morocco | 23.76 | | 23.71 | | 23.80 | | 0.996 | |
| Mozambique | 21.27 | | 21.27 | | 21.27 | | 1.000 | |
| Myanmar | 22.40 | | 22.91 | | 21.89 | | 1.047 | |
| Namibia | 22.00 | | 22.01 | | 21.99 | | 1.001 | |
| Nepal | 20.55 | | 20.82 | | 20.27 | | 1.027 | |
| Netherlands | 24.14 | | 25.72 | | 22.56 | | 1.140 | |
| New Zealand | 26.61 | | 27.55 | | 25.67 | | 1.073 | |
| Nicaragua | 25.61 | | 25.83 | | 25.38 | | 1.018 | |
| Niger | 21.49 | | 22.27 | | 20.71 | | 1.075 | |
| Nigeria | 22.88 | | 23.98 | | 21.77 | | 1.102 | |
| North Korea | 20.78 | | 21.29 | | 20.27 | | 1.050 | |
| Norway | 24.69 | | 26.28 | | 23.10 | | 1.138 | |
| Oman | 24.15 | | 25.41 | | 22.89 | | 1.110 | |
| Pakistan | 21.53 | | 21.92 | | 21.14 | | 1.037 | |
| Panama | 26.16 | | 26.67 | | 25.65 | | 1.040 | |
| Papua New Guinea | 23.79 | | 23.16 | | 24.41 | | 0.949 | |
| Paraguay | 25.32 | | 25.83 | | 24.81 | | 1.041 | |
| Peru | 25.23 | | 25.87 | | 24.59 | | 1.052 | |
| Philippines | 22.35 | | 22.73 | | 21.96 | | 1.035 | |
| Poland | 23.21 | | 25.88 | | 20.54 | | 1.260 | |
| Portugal | 24.59 | | 26.49 | | 22.69 | | 1.167 | |
| Qatar | 27.47 | | 27.98 | | 26.96 | | 1.038 | |
| Romania | 22.98 | | 24.62 | | 21.33 | | 1.154 | |
| Russian Federation | 23.25 | | 24.80 | | 21.69 | | 1.143 | |
| Rwanda | 21.67 | | 21.15 | | 22.19 | | 0.953 | |
| Saint Lucia | 25.23 | | 24.59 | | 25.86 | | 0.951 | |
| Samoa | 28.34 | | 28.79 | | 27.88 | | 1.033 | |
| São Tomé and Príncipe | 21.75 | | 22.26 | | 21.24 | | 1.048 | |
| Saudi Arabia | 26.11 | | 27.88 | | 24.33 | | 1.146 | |
| Senegal | 22.68 | | 23.73 | | 21.62 | | 1.098 | |
| Sierra Leone | 23.45 | | 23.87 | | 23.03 | | 1.036 | |
| Singapore | 22.19 | | 22.80 | | 21.58 | | 1.057 | |
| Slovakia | 25.34 | | 25.85 | | 24.83 | | 1.041 | |
| Slovenia | 25.38 | | 25.89 | | 24.87 | | 1.041 | |
| Solomon Islands | 27.44 | | 27.85 | | 26.83 | | 1.038 | |
| Somalia | 20.48 | | 20.99 | | 19.97 | | 1.051 | |
| South Africa | 24.96 | | 24.95 | | 24.97 | | 0.999 | |
| South Korea | 24.06 | | 25.34 | | 22.78 | | 1.112 | |
| Spain | 24.52 | | 26.47 | | 22.57 | | 1.173 | |
| Sri Lanka | 20.51 | | 21.44 | | 19.57 | | 1.096 | |
| St Vincent and the Grenadines | 26.04 | | 26.55 | | 25.53 | | 1.040 | |
| Sudan | 21.97 | | 22.48 | | 21.46 | | 1.048 | |
| Suriname | 25.71 | | 26.22 | | 25.20 | | 1.040 | |
| Swaziland | 23.39 | | 23.90 | | 22.88 | | 1.045 | |
| Sweden | 24.54 | | 26.11 | | 22.97 | | 1.137 | |
| Switzerland | 24.94 | | 25.47 | | 24.40 | | 1.044 | |
| Syria | 25.00 | | 25.51 | | 24.49 | | 1.042 | |
| Tajikistan | 25.21 | | 25.72 | | 24.70 | | 1.041 | |
| Tanzania | 21.83 | | 21.87 | | 21.78 | | 1.004 | |
| Thailand | 22.34 | | 23.36 | | 21.32 | | 1.096 | |
| Togo | 22.22 | | 22.72 | | 21.72 | | 1.046 | |
| Tonga | 32.90 | | 32.03 | | 33.77 | | 0.948 | |
| Trinidad and Tobago | 26.90 | | 26.46 | | 27.33 | | 0.968 | |
| Tunisia | 23.86 | | 24.63 | | 23.08 | | 1.067 | |
| Turkey | 24.92 | | 25.33 | | 24.50 | | 1.034 | |
| Turkmenistan | 23.55 | | 25.13 | | 21.96 | | 1.144 | |
| Uganda | 21.53 | | 21.03 | | 22.02 | | 0.955 | |
| Ukraine | 23.34 | | 24.84 | | 21.84 | | 1.137 | |
| United Arab Emirates | 26.66 | | 27.60 | | 25.71 | | 1.074 | |
| United Kingdom | 26.19 | | 27.62 | | 24.76 | | 1.116 | |
| United States | 27.82 | | 28.64 | | 27.00 | | 1.061 | |
| Uruguay | 25.06 | | 26.88 | | 23.24 | | 1.157 | |
| Uzbekistan | 23.80 | | 24.99 | | 22.60 | | 1.106 | |
| Vanuatu | 25.53 | | 26.46 | | 24.60 | | 1.076 | |
| Venezuela | 26.19 | | 27.52 | | 24.86 | | 1.107 | |
| Vietnam | 19.96 | | 21.18 | | 18.73 | | 1.131 | |
| Yemen | 22.07 | | 22.91 | | 21.22 | | 1.080 | |
| Zambia | 21.02 | | 21.02 | | 21.01 | | 1.000 | |
| Zimbabwe | 22.38 | | 21.70 | | 23.06 | | 0.941 | |
| Country | Average BMI[note 4] | Relative size of average BMI | Male BMI | Relative size of male BMI | Female BMI | Relative size of female BMI | Ratio of male to female BMI | Relative size of ratio |
See also
Notes
- ↑ e.g. the Body Mass Index Table from the National Institutes of Health's NHLBI.
- ↑ For example, in the UK where people often know their weight in stone and height in feet and inches, – see
- ↑ Assuming equal male and female population (generally correct within 5%)
- ↑ Assuming equal male and female population (generally correct within 5%)
References
- ↑ 1.0 1.1 "BMI Classification". Global Database on Body Mass Index. World Health Organization. 2006. Retrieved July 27, 2012.
- ↑ Dr Malcolm Kendrick (April 12, 2015). "Why being 'overweight' means you live longer: The way scientists twist the facts". http://www.independent.co.uk. Retrieved 12 April 2015.
- ↑ Eknoyan, Garabed (2007). "Adolphe Quetelet (1796–1874)—the average man and indices of obesity". Nephrology Dialysis Transplantation 23 (1): 47–51. doi:10.1093/ndt/gfm517. PMID 17890752.
- ↑ Jeremy Singer-Vine (July 20, 2009). "Beyond BMI: Why doctors won't stop using an outdated measure for obesity". Slate.com. Retrieved 15 December 2013.
- ↑ Keys, Ancel; Fidanza, Flaminio; Karvonen, Martti J.; Kimura, Noboru; Taylor, Henry L. (1972). "Indices of relative weight and obesity". Journal of Chronic Diseases 25 (6–7): 329–43. doi:10.1016/0021-9681(72)90027-6. PMID 4650929.
- ↑ 6.0 6.1 "Assessing Your Weight and Health Risk". National Heart, Lung and Blood Institute. Retrieved 19 December 2014.
- ↑ 7.0 7.1 7.2 "Defining obesity". NHS. Retrieved 19 December 2014.
- ↑ Fareed M, Afzal M. (2014) Evidence of inbreeding depression on height, weight, and body mass index: A population-based child cohort study. Am J Hum Biol. 26:784–795. doi:10.1002/ajhb.22599 PMID 25130378
- ↑ "Physical Status: The Use and Interpretation of Anthropometry" (PDF). WHO Technical Report Series (Geneva, Switzerland: World Health Organization) 854: 9. 1995. PMID 8594834.
- ↑ 10.0 10.1 Korevaar, Nick (July 2003). "Notes on Body Mass Index and actual national data" (PDF).
- ↑ MacKay, N.J. (2010). "Scaling of human body mass with height: The body mass index revisited". Journal of Biomechanics 43 (4): 764–6. arXiv:0910.5834. Bibcode:2009arXiv0910.5834M. doi:10.1016/j.jbiomech.2009.10.038. PMID 19909957.
- ↑ Gadzik, James (2006). "'How much should I weigh?' Quetelet's equation, upper weight limits, and BMI prime". Connecticut Medicine 70 (2): 81–8. PMID 16768059.
- ↑ "Body Mass Index: BMI for Children and Teens". Center for Disease Control. Retrieved 2013-12-16.
- ↑ "Health Survey for England: The Health of Children and Young People". Archive2.official-documents.co.uk. Retrieved 16 December 2013.
- ↑ "BMI正常指標" [Normal BMI Index]. Ideal BMI Disease Prevention Project (in Chinese). Hospital Authority Health InfoWorld. Retrieved 2013-11-12.
- ↑ "肥満って、 どんな状態?" [What is obesity, what kind of state?]. Obesity Homepage (in Japanese). Ministry of Health, Labor and Welfare. Retrieved 2013-05-25.
- ↑ Shiwaku, K; Anuurad, E; Enkhmaa, B; Nogi, A; Kitajima, K; Shimono, K et al. (2003). "Overweight Japanese with body mass indexes of 23.0–24.9 have higher risks for obesity-associated disorders: A comparison of Japanese and Mongolians". International Journal of Obesity 28 (1): 152–8. doi:10.1038/sj.ijo.0802486. PMID 14557832.
- ↑ "Revision of Body Mass Index (BMI) Cut-Offs in Singapore".
- ↑ "Who's fat? New definition adopted". CNN. June 17, 1998. Retrieved 2010-04-26.
- ↑ "Anthropometric Reference Data for Children and Adults: United States" (PDF). CDC DHHS. 2012.
- ↑ "Physical status: The use and interpretation of anthropometry" (PDF). WHO Technical Report Series (Geneva, Switzerland: World Health Organization) 854 (854): 1–452. 1995. PMID 8594834.
- ↑ "Executive Summary". Clinical Guidelines on the Identification, Evaluation, and Treatment of Overweight and Obesity in Adults: The Evidence Report. National Heart, Lung, and Blood Institute. September 1998. xi–xxx.
- ↑ Bhaskaran, K; I, Douglas; Forbes, H; dos-Santos-Silva, H; Leon, DA; Smeeth, L (2014). "Body-mass index and risk of 22 specific cancers: a population-based cohort study of 5·24 million UK adults". Lancet 384 (9945): 755–65. doi:10.1016/S0140-6736(14)60892-8. PMID 25129328.
- ↑ https://www.biomedcentral.com/1471-2253/14/70
- ↑ Katherine M. Flegal, PhD; Brian K. Kit, MD; Heather Orpana, PhD; Barry I. Graubard, PhD (2013). "Association of All-Cause Mortality With Overweight and Obesity Using Standard Body Mass Index Categories A Systematic Review and Meta-analysis". The Journal of the American Medical Association (The American Medical Association) 309 (January 2, 2013, Vol 309, No. 1): 71–82. doi:10.1001/jama.2012.113905. PMID 23280227.
- ↑ Jeukendrup, A.; Gleeson, M. (2005). Sports Nutrition. Human Kinetics: An Introduction to Energy Production and Performance. ISBN 978-0-7360-3404-3.
- ↑ Barasi, M. E. (2004). Human Nutrition – a health perspective. ISBN 0-340-81025-4.
- ↑ http://time.com/3770696/france-banned-ultra-thin-models/
- ↑ Israeli Law Bans Skinny, BMI-Challenged Models
- ↑ 30.0 30.1 30.2 Romero-Corral, A; Somers, V K; Sierra-Johnson, J; Thomas, R J; Collazo-Clavell, M L; Korinek, J et al. (2008). "Accuracy of body mass index in diagnosing obesity in the adult general population". International Journal of Obesity 32 (6): 959–66. doi:10.1038/ijo.2008.11. PMC 2877506. PMID 18283284.
- ↑ "Aim for a Healthy Weight: Assess your Risk". National Institutes of Health. July 8, 2007. Retrieved 15 December 2013.
- ↑ Spurious correlation and the fallacy of the ratio standard revisited Kronmal, R A Journal of the Royal Statistical Society Series A (Statistics in Society), Vol. 156, No. 3 (1993), pp. 379-392 DOI: 10.2307/2983064
- ↑ "Do You Believe in Fairies, Unicorns, or the BMI?". Mathematical Association of America. May 1, 2009. Archived from the original on 2009-05-05.
- ↑ "Is obesity such a big, fat threat?". Cox News Service. August 30, 2004. Archived from the original on 2007-08-04. Retrieved 2007-07-08.
- ↑ Sheldon, Linzi (April 26, 2005). "Oliver blames 'obesity mafia' for American weight scare". The Dartmouth. Archived from the original on 2009-08-04.
- ↑ Taylor, R. S. (2010). "Use of Body Mass Index For Monitoring Growth and Obesity". Paediatrics & Child Health 15 (5): 258. PMC 2912631. PMID 21532785.
- ↑ Diverse Populations Collaborative Group (2005). "Weight-height relationships and body mass index: some observations from the Diverse Populations Collaboration". American Journal of Physical Anthropology 128 (1): 220–9. doi:10.1002/ajpa.20107. PMID 15761809.
- ↑ Levitt, DG; Heymsfield, SB; Pierson, RN; Shapses, SA; Kral, JG (2007). "Physiological models of body composition and human obesity". Nutrition & Metabolism (London) 4: 19. doi:10.1186/1743-7075-4-19. PMC 2082278. PMID 17883858.
- ↑ Brown, David (January 23, 2003). "Linemen More Likely To Have Sleep Condition". The Washington Post.
- ↑ Reinberg, Steven (January 29, 2007). "Ex-NFL Linemen prone to Heart Disease". The Washington Post. Retrieved 2010-04-26.
- ↑ "Who's fat? New definition adopted". June 17, 1998. Retrieved 2014-07-15.
- ↑ http://www.halls.md/ideal-weight/medical.htm. Missing or empty
|title=(help) - ↑ Flegal, K. M.; Graubard, BI; Williamson, DF; Gail, MH (2005). "Excess Deaths Associated with Underweight, Overweight, and Obesity". JAMA 293 (15): 1861–7. doi:10.1001/jama.293.15.1861. PMID 15840860.
- ↑ name="pmid21976023">Lim JS, Lee DH, Park JY, Jin SH, Jacobs DR Jr (2007). "A strong interaction between serum gamma-glutamyltransferase and obesity on the risk of prevalent type 2 diabetes: results from the Third National Health and Nutrition Examination Survey". Clinical Chemistry 53 (6): 1092–1098. doi:10.1016/j.jacl.2011.05.004. PMID 17478563.
- ↑ Romero-Corral, A; Montori, V M; Somers, V K; Korinek, J; Thomas, R J; Allison, T G; Mookadam, F; Lopez-Jimenez, F (2006). "Association of bodyweight with total mortality and with cardiovascular events in coronary artery disease: A systematic review of cohort studies". The Lancet 368 (9536): 666–78. doi:10.1016/S0140-6736(06)69251-9. PMID 16920472.
- ↑ Schneider, H J; Friedrich, N; Klotsche, J; Pieper, L; Nauck, M; John, U et al. (2010). "The Predictive Value of Different Measures of Obesity for Incident Cardiovascular Events and Mortality". Journal of Clinical Endocrinology & Metabolism 95 (4): 1777–85. doi:10.1210/jc.2009-1584. PMID 20130075.
- ↑ Mørkedal, Bjørn; Romundstad, Pål R; Vatten, Lars J (2011). "Informativeness of indices of blood pressure, obesity and serum lipids in relation to ischaemic heart disease mortality: the HUNT-II study". European Journal of Epidemiology 26 (6): 457–461. doi:10.1007/s10654-011-9572-7. ISSN 0393-2990. PMC 3115050. PMID 21461943.
- ↑ Vanitallie, TB; Yang, MU; Heymsfield, SB; Funk, RC; Boileau, RA (1990). "Height-normalized indices of the body's fat-free mass and fat mass: Potentially useful indicators of nutritional status". The American Journal of Clinical Nutrition 52 (6): 953–9. PMID 2239792.
- ↑ "Where are you on the global fat scale?". BBC. July 12, 2012. Retrieved 2013-12-16.
Further reading
- Ferrera, Linda A., ed. (2006). Focus on Body Mass Index And Health Research. New York: Nova Science. ISBN 978-1-59454-963-2.
- Samaras, Thomas T., ed. (2007). Human Body Size and the Laws of Scaling: Physiological, Performance, Growth, Longevity and Ecological Ramifications. New York: Nova Science. ISBN 978-1-60021-408-0.
- Sothern, Melinda S.; Gordon, Stewart T.; von Almen, T. Kristian, eds. (2006). Handbook of Pediatric Obesity: Clinical Management (illustrated ed.). CRC Press. ISBN 978-1-4200-1911-7.
External links
| Look up body mass index in Wiktionary, the free dictionary. |
- U.S. National Center for Health Statistics: