Bivariate analysis
Bivariate analysis is one of the simplest forms of quantitative (statistical) analysis.[1] It involves the analysis of two variables (often denoted as X, Y), for the purpose of determining the empirical relationship between them.[1] In order to see if the variables are related to one another, it is common to measure how those two variables simultaneously change together (see also covariance).[2]
Bivariate analysis can be helpful in testing simple hypotheses of association and causality – checking to what extent it becomes easier to know and predict a value for the dependent variable if we know a case's value of the independent variable (see also correlation).[2]
Bivariate analysis can be contrasted with univariate analysis in which only one variable is analysed.[1] Furthermore, the purpose of a univariate analysis is descriptive. Subgroup comparison – the descriptive analysis of two variables – can be sometimes seen as a very simple form of bivariate analysis (or as univariate analysis extended to two variables).[1] The major differentiating point between univariate and bivariate analysis, in addition to the latter's looking at more than one variable, is that the purpose of a bivariate analysis goes beyond simply descriptive: it is the analysis of the relationship between the two variables.[1] Bivariate analysis is a simple (two variable) special case of multivariate analysis (where multiple relations between multiple variables are examined simultaneously).[1]
Types of Bivariate analysis
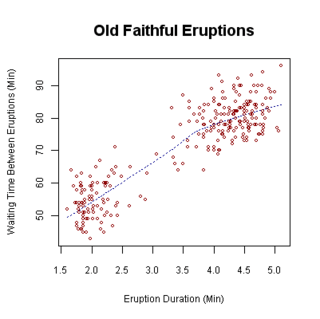
Common forms of bivariate analysis involve creating a percentage table or a scatterplot graph and computing a simple correlation coefficient.[1] The types of analysis that are suited to particular pairs of variables vary in accordance with the level of measurement of the variables of interest (e.g. nominal/categorical, ordinal, interval/ratio). If the dependent variable—the one whose value is determined to some extent by the other, independent variable— is a categorical variable, such as the preferred brand of cereal, then probit or logit regression (or multinomial probit or multinomial logit) can be used. If both variables are ordinal, meaning they are ranked in a sequence as first, second, etc., then a rank correlation coefficient can be computed. If just the dependent variable is ordinal, ordered probit or ordered logit can be used. If the dependent variable is continuous—either interval level or ratio level, such as a temperature scale or an income scale—then simple regression can be used.
If both variables are time series, a particular type of causality known as Granger causality can be tested for, and vector autoregression can be performed to examine the intertemporal linkages between the variables.
See also
References
| ||||||||||||||||||||||||||||||||||||||||||||||||||||||||||||||||||||||||||||||||||||||||||||||||||||||||||||||||||||||||||||||||||||||||||||||||||||||||||||||||||||||||||||||||||||||||||||||||||||||||||||||||||||||