Birmingham Perry Barr (UK Parliament constituency)
Coordinates: 52°31′30″N 1°54′15″W / 52.5249°N 1.9042°W
| Birmingham, Perry Barr | |
|---|---|
|
Borough constituency for the House of Commons | |
|
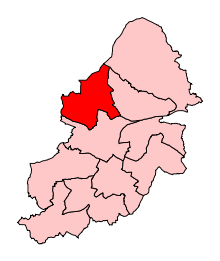
Boundary of Birmingham, Perry Barr in Birmingham. | |
|
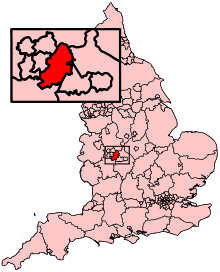
Location of Birmingham within England. | |
| County | West Midlands |
| Population | 107,090 (2011 census)[1] |
| Electorate | 71,794 (December 2010)[2] |
| Current constituency | |
| Created | 1950 |
| Member of parliament | Khalid Mahmood (Labour) |
| Number of members | One |
| Overlaps | |
| European Parliament constituency | West Midlands |
Birmingham, Perry Barr is a constituency[n 1] of part of the city of Birmingham represented in the House of Commons of the UK Parliament since 2001 by Khalid Mahmood of the Labour Party.[n 2]
Boundaries
The constituency covers a broad area of north-west Birmingham comprising the electoral wards of:
- Handsworth Wood
- Lozells and East Handsworth
- Oscott
- Perry Barr
Members of Parliament
| Election | Member[3] | Party | |
|---|---|---|---|
| 1950 | Cecil Charles Poole | Labour | |
| 1955 | Charles Howell | Labour | |
| 1964 | Dr Wyndham Davies | Conservative | |
| 1966 | Christopher Price | Labour | |
| 1970 | Joseph Kinsey | Conservative | |
| Feb 1974 | Jeff Rooker | Labour | |
| 2001 | Khalid Mahmood | Labour | |
Elections
Elections in the 2010s
| General Election 2015: Birmingham Perry Barr [4] | |||||
|---|---|---|---|---|---|
| Party | Candidate | Votes | % | ±% | |
| Conservative | Charlotte Hodivala | ||||
| Green | James Lovatt[5] | ||||
| Labour | Khalid Mahmood | ||||
| TUSC | Robert Punton [6] | ||||
| Liberal Democrat | Arjun Singh | ||||
| UKIP | Harjinder Singh | ||||
| General Election 2010: Birmingham Perry Barr[7][8] | |||||
|---|---|---|---|---|---|
| Party | Candidate | Votes | % | ±% | |
| Labour | Khalid Mahmood | 21,142 | 50.3 | +4.0 | |
| Liberal Democrat | Karen Hamilton | 9,234 | 22.0 | −4.2 | |
| Conservative | William G.D. Norton | 8,960 | 21.3 | +4.0 | |
| UKIP | Melvin J. Ward | 1,675 | 4.0 | +1.6 | |
| Socialist Labour | John Tyrrell | 527 | 1.3 | −1.0 | |
| Christian | Deborah Hey-Smith | 507 | 1.2 | +1.2 | |
| Majority | 11,908 | 28.3 | |||
| Turnout | 42,045 | 59.0 | +5.1 | ||
| Labour hold | Swing | +4.1 | |||
Elections in the 2000s
| General Election 2005: Birmingham Perry Barr | |||||
|---|---|---|---|---|---|
| Party | Candidate | Votes | % | ±% | |
| Labour | Khalid Mahmood | 18,269 | 47.0 | +0.5 | |
| Liberal Democrat | Jon P.A. Hunt | 10,321 | 26.5 | +3.6 | |
| Conservative | Naweed Khan | 6,513 | 16.7 | −6.4 | |
| Respect | Dr Mohammad Naseem | 2,173 | 5.6 | N/A | |
| Socialist Labour | Rajinder Clair | 890 | 2.3 | −1.8 | |
| UKIP | Miss Bimla Balu | 745 | 1.9 | +1.0 | |
| Majority | 7,948 | 20.5 | |||
| Turnout | 38,911 | 55.5 | +2.9 | ||
| Labour hold | Swing | − | |||
| General Election 2001: Birmingham Perry Barr | |||||
|---|---|---|---|---|---|
| Party | Candidate | Votes | % | ±% | |
| Labour | Khalid Mahmood | 17,415 | 46.5 | −16.5 | |
| Conservative | David Binns | 8,662 | 23.1 | +1.4 | |
| Liberal Democrat | Jon P.A. Hunt | 8,566 | 22.9 | +13.0 | |
| Socialist Labour | Avtar S. Jouhl | 1,544 | 4.1 | N/A | |
| Socialist Alliance | Miss Caroline N. Johnson | 465 | 1.2 | N/A | |
| UKIP | Miss Natalya Nattrass | 352 | 0.9 | N/A | |
| Marxist Party | Michael F. Roche | 221 | 0.6 | N/A | |
| Muslim Party | Robert L. Davidson | 192 | 0.5 | N/A | |
| Majority | 8,753 | 23.4 | |||
| Turnout | 37,417 | 52.6 | −11.9 | ||
| Labour hold | Swing | ||||
Elections in the 1990s
| General Election 1997: Birmingham Perry Barr | |||||
|---|---|---|---|---|---|
| Party | Candidate | Votes | % | ±% | |
| Labour | Jeff Rooker | 28,921 | 63.0 | +12.8 | |
| Conservative | Andrew P. Dunnett | 9,964 | 21.7 | −14.9 | |
| Liberal Democrat | Ray G. Hassall | 4,523 | 9.9 | −0.3 | |
| Referendum Party | Saeed Mahmood | 843 | 1.8 | N/A | |
| Liberal | Alasdair Baxter | 718 | 1.6 | N/A | |
| BNP | Lee Windridge | 544 | 1.2 | N/A | |
| Independent | Avtar S. Panesar | 374 | 0.8 | N/A | |
| Majority | 18,957 | 41.3 | |||
| Turnout | 45,887 | 64.5 | −7.1 | ||
| Labour hold | Swing | +13.9 | |||
| General Election 1992: Birmingham Perry Barr[9] | |||||
|---|---|---|---|---|---|
| Party | Candidate | Votes | % | ±% | |
| Labour | Jeff Rooker | 27,507 | 53.2 | +2.8 | |
| Conservative | Graham G. Green | 18,917 | 36.6 | −0.3 | |
| Liberal Democrat | Toby P.J.G. Philpott | 5,261 | 10.2 | −2.5 | |
| Majority | 8,590 | 16.6 | +3.1 | ||
| Turnout | 51,685 | 71.6 | +2.0 | ||
| Labour hold | Swing | +1.6 | |||
Elections in the 1980s
| General Election 1987: Birmingham Perry Barr[10] | |||||
|---|---|---|---|---|---|
| Party | Candidate | Votes | % | ±% | |
| Labour | Jeff Rooker | 25,894 | 50.4 | −2.1 | |
| Conservative | John David Beckett Taylor | 18,961 | 36.9 | −1.3 | |
| Liberal | David D. Webb | 6,514 | 12.7 | +3.4 | |
| Majority | 6,933 | 13.5 | |||
| Turnout | 51,369 | 69.6 | +0.4 | ||
| Labour hold | Swing | −0.4 | |||
| General Election 1983: Birmingham Perry Barr[11] | |||||
|---|---|---|---|---|---|
| Party | Candidate | Votes | % | ±% | |
| Labour | Jeff Rooker | 27,061 | 52.5 | +4.9 | |
| Conservative | Michael Portillo | 19,659 | 38.2 | −8.1 | |
| Liberal | C.E.G. Williams | 4,773 | 9.3 | +4.7 | |
| Majority | 7,402 | 14.4 | |||
| Turnout | 51,493 | 69.2 | −6.6 | ||
| Labour hold | Swing | +6.5 | |||
Elections in the 1970s
| General Election 1979: Birmingham Perry Barr[12] | |||||
|---|---|---|---|---|---|
| Party | Candidate | Votes | % | ±% | |
| Labour | Jeff Rooker | 18,674 | 47.6 | +0.1 | |
| Conservative | Joseph Kinsey | 18,183 | 46.3 | +7.1 | |
| Liberal | O.L. Griffiths | 1,811 | 4.6 | −6.4 | |
| National Front | Keith Axon | 582 | 1.5 | −0.6 | |
| Majority | 491 | 1.2 | |||
| Turnout | 39,250 | 75.8 | +2.4 | ||
| Labour hold | Swing | −3.5 | |||
| General Election October 1974: Birmingham Perry Barr[13] | |||||
|---|---|---|---|---|---|
| Party | Candidate | Votes | % | ±% | |
| Labour | Jeff Rooker | 18,291 | 47.5 | +3.5 | |
| Conservative | Joseph Kinsey | 15,087 | 39.2 | +0.1 | |
| Liberal | Kenneth John Hovers | 4,231 | 11.0 | −3.8 | |
| National Front | R.J. Warren | 826 | 2.1 | +0.0 | |
| More Prosperous Britain | Tom Keen | 86 | 0.2 | N/A | |
| Majority | 3,204 | 8.3 | |||
| Turnout | 38,521 | 73.4 | −4.9 | ||
| Labour hold | Swing | +1.7 | |||
| General Election February 1974: Birmingham Perry Barr[14] | |||||
|---|---|---|---|---|---|
| Party | Candidate | Votes | % | ±% | |
| Labour | Jeff Rooker | 17,960 | 44.0 | −4.2 | |
| Conservative | Joseph Kinsey | 15,937 | 39.1 | −12.7 | |
| Liberal | Kenneth John Hovers | 6,044 | 14.8 | N/A | |
| National Front | Arthur Cosham Shorthouse | 853 | 2.1 | N/A | |
| Majority | 2,023 | 5.0 | |||
| Turnout | 40,794 | 78.3 | +7.7 | ||
| Labour gain from Conservative | Swing | +4.3 | |||
| General Election 1970: Birmingham Perry Barr[15] | |||||
|---|---|---|---|---|---|
| Party | Candidate | Votes | % | ±% | |
| Conservative | Joseph Kinsey | 18,083 | 51.8 | +6.8 | |
| Labour | Christopher Price | 16,817 | 48.2 | −6.8 | |
| Majority | 1,266 | 3.6 | |||
| Turnout | 34,900 | 70.6 | −5.6 | ||
| Conservative gain from Labour | Swing | +6.8 | |||
Elections in the 1960s
| General Election 1966: Birmingham Perry Barr[16] | |||||
|---|---|---|---|---|---|
| Party | Candidate | Votes | % | ±% | |
| Labour | Christopher Price | 20,222 | 55.0 | +5.5 | |
| Conservative | Wyndham Davies | 16,557 | 45.0 | −4.5 | |
| Majority | 3,665 | 10.0 | |||
| Turnout | 36,779 | 76.2 | +1.3 | ||
| Labour gain from Conservative | Swing | +5.5 | |||
| General Election 1964: Birmingham Perry Barr[17] | |||||
|---|---|---|---|---|---|
| Party | Candidate | Votes | % | ±% | |
| Conservative | Wyndham Davies | 18,483 | 50.5 | +8.3 | |
| Labour | Charles Howell | 18,156 | 49.5 | +6.9 | |
| Majority | 327 | 0.9 | |||
| Turnout | 36,639 | 74.9 | −3.6 | ||
| Conservative gain from Labour | Swing | +0.7 | |||
Elections in the 1950s
| General Election 1959: Birmingham Perry Barr[18] | |||||
|---|---|---|---|---|---|
| Party | Candidate | Votes | % | ±% | |
| Labour | Charles Howell | 16,811 | 42.6 | −8.4 | |
| Conservative | S.C. Greatrix | 16,628 | 42.2 | −4.3 | |
| Liberal | Wallace Leslie Lawler | 5,611 | 14.2 | N/A | |
| Communist | H. Pearce | 424 | 1.1 | −1.4 | |
| Majority | 183 | 0.5 | |||
| Turnout | 39,474 | 78.5 | +5.7 | ||
| Labour hold | Swing | −2.1 | |||
| General Election 1955: Birmingham Perry Barr[19] | |||||
|---|---|---|---|---|---|
| Party | Candidate | Votes | % | ±% | |
| Labour | Charles Howell | 18,732 | 51.0 | −7.1 | |
| Conservative | F.B. Hingston | 17,052 | 46.5 | +4.5 | |
| Communist | H. Pearce | 928 | 2.5 | N/A | |
| Majority | 1,680 | 4.6 | |||
| Turnout | 36,712 | 72.8 | −8.3 | ||
| Labour hold | Swing | −5.8 | |||
| General Election 1951: Birmingham Perry Barr[20] | |||||
|---|---|---|---|---|---|
| Party | Candidate | Votes | % | ±% | |
| Labour | Cecil Charles Poole | 23,322 | 58.1 | +1.5 | |
| Conservative | S.A. Ward | 16,855 | 42.0 | +4.9 | |
| Majority | 6,467 | 16.1 | |||
| Turnout | 40,177 | 81.1 | −1.9 | ||
| Labour hold | Swing | −1.7 | |||
| General Election 1950: Birmingham Perry Barr[21] | |||||
|---|---|---|---|---|---|
| Party | Candidate | Votes | % | ±% | |
| Labour | Cecil Charles Poole | 23,178 | 56.6 | N/A | |
| Conservative | E. Boyle | 15,172 | 37.1 | N/A | |
| Liberal | Frances Nora Hinks | 2,581 | 6.3 | N/A | |
| Majority | 8,006 | 19.6 | N/A | ||
| Turnout | 40,931 | 83.0 | N/A | ||
| Labour win (new seat) | |||||
See also
Notes and references
- Notes
- References
- ↑ "Birmingham, Perry Barr: Usual Resident Population, 2011". Neighbourhood Statistics. Office for National Statistics. Retrieved 30 January 2015.
- ↑ "Electorate Figures - Boundary Commission for England". 2011 Electorate Figures. Boundary Commission for England. 4 March 2011. Retrieved 13 March 2011.
- ↑ Leigh Rayment's Historical List of MPs – Constituencies beginning with "P" (part 1)
- ↑ http://ukpollingreport.co.uk/2015guide/birminghamperrybarr/
- ↑ West Midlands Green Party
- ↑ http://www.tusc.org.uk/txt/320.pdf
- ↑ Statement of Persons Nominated and Notice of Poll 2010
- ↑ Birmingham City Council: General Election 2010
- ↑ "UK General Election results April 1992". Richard Kimber's Political Science Resources. Politics Resources. 9 April 1992. Retrieved 2010-12-06.
- ↑ "UK General Election results June 1992". Richard Kimber's Political Science Resources. Politics Resources. 11 June 1987. Retrieved 2012-12-24.
- ↑ "UK General Election results June 1983". Richard Kimber's Political Science Resources. Politics Resources. 9 June 1983. Retrieved 2012-12-24.
- ↑ "UK General Election results May 1979". Richard Kimber's Political Science Resources. Politics Resources. 28 May 1979. Retrieved 2012-12-24.
- ↑ "UK General Election results October 1974". Richard Kimber's Political Science Resources. Politics Resources. 10 October 1974. Retrieved 2012-12-24.
- ↑ "UK General Election results February 1974". Richard Kimber's Political Science Resources. Politics Resources. 28 February 1974. Retrieved 2012-12-24.
- ↑ "UK General Election results June 1970". Richard Kimber's Political Science Resources. Politics Resources. 18 June 1970. Retrieved 2012-12-24.
- ↑ "UK General Election results March 1966". Richard Kimber's Political Science Resources. Politics Resources. 31 March 1966. Retrieved 2012-12-24.
- ↑ "UK General Election results October 1964". Richard Kimber's Political Science Resources. Politics Resources. 15 October 1964. Retrieved 2012-12-24.
- ↑ "UK General Election results October 1959". Richard Kimber's Political Science Resources. Politics Resources. 8 October 1959. Retrieved 2012-12-24.
- ↑ "UK General Election results May 1955". Richard Kimber's Political Science Resources. Politics Resources. 26 May 1955. Retrieved 2012-12-24.
- ↑ "UK General Election results October 1951". Richard Kimber's Political Science Resources. Politics Resources. 25 October 1951. Retrieved 2012-12-24.
- ↑ "UK General Election results February 1950". Richard Kimber's Political Science Resources. Politics Resources. 23 February 1974. Retrieved 2012-12-24.
External links
| ||||||||||