Berthier—Maskinongé
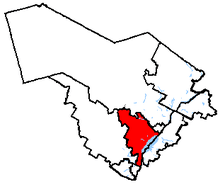 Berthier—Maskinongé in relation to other Quebec federal electoral districts | |||
| Federal electoral district | |||
| Legislature | House of Commons | ||
| MP |
| ||
| District created | 1924 | ||
| First contested | 1925 | ||
| Last contested | 2011 | ||
| District webpage | profile, map | ||
| Demographics | |||
| Population (2011)[1] | 112,341 | ||
| Electors (2011) | 88,326 | ||
| Area (km²)[2] | 3,580.47 | ||
| Pop. density (per km²) | 31.4 | ||
| Census divisions | D'Autray, Maskinongé, Trois-Rivières | ||
| Census subdivisions | Berthierville, Charette, Lanoraie, Lavaltrie, Louiseville, Mandeville, Maskinongé, Saint-Alexis-des-Mont, Saint-Barnabé, Saint-Barthélemy, Saint-Boniface-de-Shawinigan, Saint-Cuthbert, Saint-Didace, Sainte-Angèle-de-Prémont, Saint-Édouard-de-Maskinongé, Sainte-Élisabeth, Sainte-Geneviève-de-Berthier, Saint-Élie-de-Caxton, Saint-Étienne-des-Grès, Sainte-Ursule, Saint-Gabriel, Saint-Gabriel-de-Brandon, Saint-Justin, Saint-Léon-le-Grand, Saint-Mathieu-du-Parc, Saint-Norbert, Saint-Paulin, Saint-Sévère, Trois-Rivières, Yamachiche | ||
Berthier—Maskinongé (formerly known as Berthier and Berthier—Maskinongé—Lanaudière) is a federal electoral district in Quebec, Canada, that has been represented in the House of Commons of Canada from 1925 to 1953, from 1968 to 1988, and since 2004. Its population in 2001 was 103,516.
Geography
The riding extends along the north bank of the Saint Lawrence River between the north suburbs of Montreal and Trois-Rivières, straddling the Quebec regions of Lanaudière and Mauricie.
The district includes the Regional County Municipalities of D'Autray and Maskinongé, and the former cities of Pointe-du-Lac and Trois-Rivières-Ouest in the City of Trois-Rivières.
The neighbouring ridings are Joliette, Repentigny, Verchères—Les Patriotes, Bas-Richelieu—Nicolet—Bécancour, Trois-Rivières, and Saint-Maurice—Champlain.
History
The riding was created in 1924 from Berthier and Maskinongé. It consisted of Berthier County and Maskinongé County.
In 1947, it was redefined to consist of the county of Berthier and the town of Berthierville, the county of Maskinongé and the town of Louiseville, and Gouin township in the county of Joliette.
In 1952, it was abolished when it was merged into Berthier—Maskinongé—delanaudière riding.
The riding was recreated in 1966 as "Berthier" from the districts of Berthier—Maskinongé—delanaudière, Chapleau, Joliette—L'Assomption—Montcalm, St-Maurice—Laflèche, and Three Rivers.
In 1975, the name of the riding was changed to "Berthier-Maskinongé". After the 1980 election, the name of the district was changed to Berthier—Maskinongé—Lanaudière.
In the 1984 election, the seat was won by Progressive Conservative Robert de Cotret, who held it until the 1988 election. The riding was abolished in 1987. It was divided between Berthier—Montcalm, Champlain, and Saint-Maurice.
Berthier—Maskinongé was re-created in 2003. 44.8% of the riding came from Trois-Rivières, 36.0% from Berthier—Montcalm, and 19.2% from Saint-Maurice.
In the 2004 election and the 2006 election, Bloc Québécois MP Guy André was elected in the riding.
Members of Parliament
This riding has elected the following Members of Parliament:
| Parliament | Years | Member | Party | |
|---|---|---|---|---|
| Berthier—Maskinongé Riding created from Berthier and Maskinongé |
||||
| 15th | 1925 − 1926 | Joseph-Charles-Théodore Gervais | Liberal | |
| 16th | 1926 − 1930 | |||
| 17th | 1930 − 1935 | Joseph Arthur Barrette | Conservative | |
| 18th | 1935 − 1940 | J.-Émile Ferron | Liberal | |
| 19th | 1940 − 1945 | |||
| 20th | 1945 − 1949 | Aldéric Laurendeau | Liberal | |
| 21st | 1949 − 1953 | Joseph Langlois | Liberal | |
| Riding dissolved into Berthier—Maskinongé—Delanaudière | ||||
| Berthier Riding re-created from Berthier—Maskinongé—Delanaudière, Chapleau, Joliette—L'Assomption—Montcalm, St-Maurice—Laflèche and Three Rivers |
||||
| 28th | 1968 − 1972 | Antonio Yanakis | Liberal | |
| 29th | 1972 − 1974 | |||
| 30th | 1974 − 1979 | |||
| Riding renamed — Berthier—Maskinongé | ||||
| 31st | 1979 − 1980 | Antonio Yanakis | Liberal | |
| 32nd | 1980 − 1984 | |||
| Riding renamed — Berthier—Maskinongé—Lanaudière | ||||
| 33rd | 1984 − 1988 | Robert de Cotret | Progressive Conservative | |
| Riding dissolved into Berthier—Montcalm, Champlain and Saint-Maurice | ||||
| Berthier—Maskinongé Riding re-created from Trois-Rivières, Berthier—Montcalm and Saint-Maurice |
||||
| 38th | 2004 − 2006 | Guy André | Bloc Québécois | |
| 39th | 2006 − 2008 | |||
| 40th | 2008 − 2011 | |||
| 41st | 2011 − Present | Ruth Ellen Brosseau | New Democratic | |
Election results
Berthier—Maskinongé, 2004-present
| Canadian federal election, 2011 | ||||||||
|---|---|---|---|---|---|---|---|---|
| Party | Candidate | Votes | % | |||||
| New Democratic | Ruth Ellen Brosseau | 22,484 | 39.63% | |||||
| Bloc Québécois | Guy André | 16,668 | 29.38% | |||||
| Liberal | Francine Gaudet | 8,109 | 14.29% | |||||
| Conservative | Marie-Claude Godue | 7,909 | 13.94% | |||||
| Green | Léonie Matteau | 1,193 | 2.10% | |||||
| Rhinoceros | Martin Jubinville | 375 | 0.66% | |||||
| Total | 56,738 | 100.00% | ||||||
| Source: "Berthier—Maskinongé election results". Elections Canada. May 2, 2011. Retrieved April 4, 2011. | ||||||||
| Canadian federal election, 2008 | ||||||||
|---|---|---|---|---|---|---|---|---|
| Party | Candidate | Votes | % | ∆% | Expenditures | |||
| Bloc Québécois | Guy André | 24,945 | 45.83 | -3.7 | $51,026 | |||
| Conservative | Marie-Claude Godue | 12,078 | 22.19 | -8.9 | $84,917 | |||
| Liberal | Jean-Luc Matteau | 10,035 | 18.44 | +8.0 | $27,551 | |||
| New Democratic | André Chauvette | 5,684 | 10.44 | +4.1 | $1,358 | |||
| Green | Denis Lefebvre | 1,691 | 3.11 | -0.5 | $109 | |||
| Total valid votes/Expense limit | 54,433 | 100.00 | $90,701 | |||||
| Total rejected ballots | 994 | 1.8 | ||||||
| Turnout | 55,427 | – | ||||||
| Canadian federal election, 2006 | ||||||||
|---|---|---|---|---|---|---|---|---|
| Party | Candidate | Votes | % | ∆% | Expenditures | |||
| Bloc Québécois | Guy André | 25,032 | 48.5 | -11.4 | $36,769 | |||
| Conservative | Marie-Claude Godue | 16,039 | 31.1 | +19.8 | $22,363 | |||
| Liberal | Serge Lafrénière | 5,386 | 10.4 | -12.3 | $24,384 | |||
| New Democratic | Anne-Marie Aubert | 3,274 | 6.3 | +3.0 | $5 | |||
| Green | Nathalie Gratton | 1,839 | 3.6 | +0.9 | ||||
| Total valid votes/Expense limit | 51,570 | 100.0 | $83,453 | |||||
| Canadian federal election, 2004 | ||||||||
|---|---|---|---|---|---|---|---|---|
| Party | Candidate | Votes | % | ∆% | Expenditures | |||
| Bloc Québécois | Guy André | 29,432 | 59.9 | – | $47,895 | |||
| Liberal | Laurier Thibault | 11,198 | 22.8 | – | $35,533 | |||
| Conservative | Ann Julie Fortier | 5,535 | 11.3 | – | $13,200 | |||
| New Democratic | Denis McKinnon | 1,653 | 3.4 | – | $2,990 | |||
| Green | Eric Labrecque | 1,314 | 2.7 | – | $0 | |||
| Total valid votes/Expense limit | 49,132 | 100.0 | $81,153 | |||||
Berthier—Maskinongé, 1975-1988
| Canadian federal election, 1984 | ||||||||
|---|---|---|---|---|---|---|---|---|
| Party | Candidate | Votes | % | ∆% | ||||
| Progressive Conservative | Robert De Cotret | 31,189 | 69.6 | +26.2 | ||||
| Liberal | Antonio Yanakis | 11,736 | 26.2 | -26.5 | ||||
| New Democratic | Jean Philip Penner | 1,200 | 2.7 | |||||
| Parti nationaliste | Marcel Rocheleau | 608 | 1.4 | |||||
| Commonwealth of Canada | Germain Rouzioux | 68 | 0.2 | |||||
| Total valid votes | 44,801 | 100.0 | ||||||
| Canadian federal election, 1980 | ||||||||
|---|---|---|---|---|---|---|---|---|
| Party | Candidate | Votes | % | ∆% | ||||
| Liberal | Antonio Yanakis | 21,232 | 52.7 | -4.7 | ||||
| Progressive Conservative | Robert De Cotret | 17,483 | 43.4 | +11.7 | ||||
| Rhinoceros | Ti-Pit Claude Des Gagne | 728 | 1.8 | |||||
| Social Credit | Camille Schmidt | 546 | 1.4 | -6.2 | ||||
| Marxist–Leninist | Ginette Cardinal | 146 | 0.4 | -0.3 | ||||
| Union populaire | France Guimond | 132 | 0.3 | -0.1 | ||||
| Total valid votes | 40,267 | 100.0 | ||||||
| Canadian federal election, 1979 | ||||||||
|---|---|---|---|---|---|---|---|---|
| Party | Candidate | Votes | % | |||||
| Liberal | Antonio Yanakis | 21,725 | 57.4 | |||||
| Progressive Conservative | Fernand Giroux | 11,995 | 31.7 | |||||
| Social Credit | Camille Schmidt | 2,851 | 7.5 | |||||
| New Democratic | Richard Leclercq | 841 | 2.2 | |||||
| Marxist–Leninist | Ginette Cardinal | 235 | 0.6 | |||||
| Union populaire | Réjean Maille | 179 | 0.5 | |||||
| Total valid votes | 37,826 | 100.0 | ||||||
Berthier—Maskinongé, 1925-1953
| Canadian federal election, 1949 | ||||||||
|---|---|---|---|---|---|---|---|---|
| Party | Candidate | Votes | % | ∆% | ||||
| Liberal | Joseph Langlois | 11,770 | 58.8 | -0.7 | ||||
| Progressive Conservative | René Beland | 8,242 | 41.2 | +38.0 | ||||
| Total valid votes | 20,012 | 100.0 | ||||||
| Canadian federal election, 1945 | ||||||||
|---|---|---|---|---|---|---|---|---|
| Party | Candidate | Votes | % | ∆% | ||||
| Liberal | Aldéric Laurendeau | 10,604 | 59.6 | -15.7 | ||||
| Independent | Azellus Lavallee | 6,639 | 37.3 | |||||
| Progressive Conservative | Joseph-Edouard Hamelin | 562 | 3.2 | -21.6 | ||||
| Total valid votes | 17,805 | 100.0 | ||||||
Note: Progressive Conservative vote is compared to "National Government" vote in 1940 election.
| Canadian federal election, 1940 | ||||||||
|---|---|---|---|---|---|---|---|---|
| Party | Candidate | Votes | % | ∆% | ||||
| Liberal | J-Emile Ferron | 10,119 | 75.3 | +20.6 | ||||
| National Government | Joseph Arthur Barrette | 3,323 | 24.7 | -7.8 | ||||
| Total valid votes | 13,442 | 100.0 | ||||||
Note: "National Government" vote is compared to Conservative vote in 1935 election.
| Canadian federal election, 1935 | ||||||||
|---|---|---|---|---|---|---|---|---|
| Party | Candidate | Votes | % | ∆% | ||||
| Liberal | J-Emile Ferron | 8,459 | 54.7 | +6.0 | ||||
| Conservative | Joseph Arthur Barrette | 5,022 | 32.5 | -18.8 | ||||
| Reconstruction | Joseph Desjarlais | 1,978 | 12.8 | |||||
| Total valid votes | 15,459 | 100.0 | ||||||
| Canadian federal election, 1930 | ||||||||
|---|---|---|---|---|---|---|---|---|
| Party | Candidate | Votes | % | ∆% | ||||
| Conservative | Joseph Arthur Barrette | 7,206 | 51.3 | +10.1 | ||||
| Liberal | Jean-Charles Théodore Gervais | 6,850 | 48.7 | -10.1 | ||||
| Total valid votes | 14,056 | 100.0 | ||||||
| Canadian federal election, 1926 | ||||||||
|---|---|---|---|---|---|---|---|---|
| Party | Candidate | Votes | % | ∆% | ||||
| Liberal | Joseph-Charles-Théodore Gervais | 6,606 | 58.8 | -2.2 | ||||
| Conservative | Joseph Arthur Barrette | 4,626 | 41.2 | +2.2 | ||||
| Total valid votes | 11,232 | 100.0 | ||||||
| Canadian federal election, 1925 | ||||||||
|---|---|---|---|---|---|---|---|---|
| Party | Candidate | Votes | % | |||||
| Liberal | Joseph-Charles-Théodore Gervais | 6,664 | 61.0 | |||||
| Conservative | Joseph Arthur Barrette | 4,264 | 39.0 | |||||
| Total valid votes | 10,928 | 100.0 | ||||||
See also
- List of Canadian federal electoral districts
- Past Canadian electoral districts
References
- "(Code 24008) Census Profile". 2011 census. Statistics Canada. 2012. Retrieved 2011-03-07.
- Campaign expense data from Elections Canada
- Riding history from the Library of Parliament
- (1924 - 1952
- (1975 - 1980)
- (1981 - 1987)
- (2003 - present)
Notes
- ↑ Statistics Canada: 2012
- ↑ Statistics Canada: 2012
| ||||||||||||||||||||||||||||
.png)