Benford's law


Benford's law, also called the First-Digit Law, refers to the frequency distribution of digits in many (but not all) real-life sources of data. In this distribution, 1 occurs as the leading digit about 30% of the time, while larger digits occur in that position less frequently: 9 as the first digit less than 5% of the time. Benford's law also concerns the expected distribution for digits beyond the first, which approach a uniform distribution.
It has been shown that this result applies to a wide variety of data sets, including electricity bills, street addresses, stock prices, population numbers, death rates, lengths of rivers, physical and mathematical constants,[1] and processes described by power laws (which are very common in nature). It tends to be most accurate when values are distributed across multiple orders of magnitude.
The graph here shows Benford's law for base 10. There is a generalization of the law to numbers expressed in other bases (for example, base 16), and also a generalization from leading 1 digit to leading n digits.
It is named after physicist Frank Benford, who stated it in 1938,[2] although it had been previously stated by Simon Newcomb in 1881.[3]
Mathematical statement

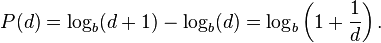
A set of numbers is said to satisfy Benford's law if the leading digit d (d ∈ {1, ..., 9}) occurs with probability

Numerically, the leading digits have the following distribution in Benford's law, where d is the leading digit and P(d) the probability:
| d | P(d) | Relative size of P(d) |
|---|---|---|
| 1 | 30.1% | |
| 2 | 17.6% | |
| 3 | 12.5% | |
| 4 | 9.7% | |
| 5 | 7.9% | |
| 6 | 6.7% | |
| 7 | 5.8% | |
| 8 | 5.1% | |
| 9 | 4.6% | |
The quantity P(d) is proportional to the space between d and d + 1 on a logarithmic scale. Therefore, this is the distribution expected if the mantissae of the logarithms of the numbers (but not the numbers themselves) are uniformly and randomly distributed. For example, a number x, constrained to lie between 1 and 10, starts with the digit 1 if 1 ≤ x < 2, and starts with the digit 9 if 9 ≤ x < 10. Therefore, x starts with the digit 1 if log 1 ≤ log x < log 2, or starts with 9 if log 9 ≤ log x < log 10. The interval [log 1, log 2] is much wider than the interval [log 9, log 10] (0.30 and 0.05 respectively); therefore if log x is uniformly and randomly distributed, it is much more likely to fall into the wider interval than the narrower interval, i.e. more likely to start with 1 than with 9. The probabilities are proportional to the interval widths, and this gives the equation above. (The above discussion assumed x is between 1 and 10, but the result is the same no matter how many digits x has before the decimal point.)
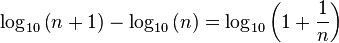
An extension of Benford's law predicts the distribution of first digits in other bases besides decimal; in fact, any base b ≥ 2. The general form is:
For b = 2 (the binary number system), Benford's law is true but trivial: All binary numbers (except for 0) start with the digit 1. (On the other hand, the generalization of Benford's law to second and later digits is not trivial, even for binary numbers.) Also, Benford's law does not apply to unary systems such as tally marks.
Example

Examining a list of the heights of the 60 tallest structures in the world by category shows that 1 is by far the most common leading digit, irrespective of the unit of measurement:
| Leading digit | meters | feet | In Benford's law | ||
|---|---|---|---|---|---|
| Count | % | Count | % | ||
| 1 | 26 | 43.3% | 18 | 30.0% | 30.1% |
| 2 | 7 | 11.7% | 8 | 13.3% | 17.6% |
| 3 | 9 | 15.0% | 8 | 13.3% | 12.5% |
| 4 | 6 | 10.0% | 6 | 10.0% | 9.7% |
| 5 | 4 | 6.7% | 10 | 16.7% | 7.9% |
| 6 | 1 | 1.7% | 5 | 8.3% | 6.7% |
| 7 | 2 | 3.3% | 2 | 3.3% | 5.8% |
| 8 | 5 | 8.3% | 1 | 1.7% | 5.1% |
| 9 | 0 | 0.0% | 2 | 3.3% | 4.6% |
History
The discovery of Benford's law goes back to 1881, when the American astronomer Simon Newcomb noticed that in logarithm tables (used at that time to perform calculations) the earlier pages (which contained numbers that started with 1) were much more worn than the other pages.[3] Newcomb's published result is the first known instance of this observation and includes a distribution on the second digit, as well. Newcomb proposed a law that the probability of a single number N being the first digit of a number was equal to log(N + 1) − log(N).
The phenomenon was again noted in 1938 by the physicist Frank Benford,[2] who tested it on data from 20 different domains and was credited for it. His data set included the surface areas of 335 rivers, the sizes of 3259 US populations, 104 physical constants, 1800 molecular weights, 5000 entries from a mathematical handbook, 308 numbers contained in an issue of Reader's Digest, the street addresses of the first 342 persons listed in American Men of Science and 418 death rates. The total number of observations used in the paper was 20,229. This discovery was later named after Benford (making it an example of Stigler's Law).
In 1995, Ted Hill proved the result about mixed distributions mentioned below.[4]
Explanations
Arno Berger and Ted Hill have stated that, "The widely known phenomenon called Benford’s law continues to defy attempts at an easy derivation".[5]
However, limited explanations of Benford's law have been offered.
Overview
Benford's law states that the fractional part of the logarithm of the data is uniformly distributed between 0 and 1. It tends to apply most accurately to data that are distributed uniformly across many orders of magnitude. As a rule, the more orders of magnitude that the data evenly covers, the more accurately Benford's law applies.
For instance, one can expect that Benford's law would apply to a list of numbers representing the populations of UK villages, or representing the values of small insurance claims. But if a "village" is defined as a settlement with population between 300 and 999, or a "small insurance claim" is defined as a claim between $50 and $99, then Benford's law will not apply.[6][7]
Consider the probability distributions shown below, referenced to a log scale.[8] In each case, the total area in red is the relative probability that the first digit is 1, and the total area in blue is the relative probability that the first digit is 8.

 A narrow probability distribution of the log of a variable, shown on a log scale[8] |
For the left distribution, the size of the areas of red and blue are approximately proportional to the widths of each red and blue bar. Therefore the numbers drawn from this distribution will approximately follow Benford's law. On the other hand, for the right distribution, the ratio of the areas of red and blue is very different from the ratio of the widths of each red and blue bar. Rather, the relative areas of red and blue are determined more by the height of the bars than the widths. Accordingly, the first digits in this distribution do not satisfy Benford's law at all.[7]
Thus, real-world distributions that span several orders of magnitude rather uniformly (e.g. populations of villages / towns / cities, stock-market prices), are likely to satisfy Benford's law to a very high accuracy. On the other hand, a distribution that is mostly or entirely within one order of magnitude (e.g. heights of human adults, or IQ scores) is unlikely to satisfy Benford's law very accurately, or at all.[6][7] However, it is not a sharp line: As the distribution gets narrower, the discrepancies from Benford's law typically increase gradually.
In terms of conventional probability density (referenced to a linear scale rather than log scale, i.e. P(x)dx rather than P(log x) d(log x)), the equivalent criterion is that Benford's law will be very accurately satisfied when P(x) is approximately proportional to 1/x over several orders-of-magnitude variation in x.[8]
This discussion is not a full explanation of Benford's law, because we have not explained why we so often come across data-sets that, when plotted as a probability distribution of the logarithm of the variable, are relatively uniform over several orders of magnitude.[9] The following sections give examples of how this might happen.
Outcomes of exponential growth processes
Here is a simple example where Benford's law would occur. 1000 cells of bacteria are introduced into a dish full of food. The number of bacteria grows exponentially, doubling each day. Every few hours for 30 days, you count the number of bacteria that are in the dish, and write down that number on a list. (By the end of 30 days, there will be a trillion bacteria.) Then this list of numbers will follow Benford's law quite accurately.
Why? Remember, the number of bacteria is growing exponentially, doubling each day. On the first day, the number of bacteria is increasing from 1000 towards 2000: The first digit is 1 the whole day. On the second day, there are 2000 bacteria increasing towards 4000: The first digit is 2 for fourteen hours and 3 for six hours. On the third day, there are 4000 bacteria increasing towards 8000: The first digit will pass through 4, 5, 6, and 7, spending less and less time in each digit. The next day, there are 8000 bacteria increasing towards 16,000. The leading digit will pass rapidly through 8 and 9 in a few hours, but then once there are 10,000 bacteria, the first digit will be 1 for a whole 24 hours, until the number of bacteria gets to 20,000.
From this example, it can be seen that the first digit is 1 with the highest probability, and 9 with the lowest.
Another way to think about it is: An exponentially-growing quantity is moving rightward on a log-scale at a constant rate. If we measure the number of bacteria at a random time in the 30-day window, we will get a random point on the log-scale, uniformly distributed in that corresponding window (about 6 orders of magnitude). As explained in the previous section, we expect this kind of probability distribution to satisfy Benford's law with high accuracy.
This example makes it plausible that data tables that involve measurements of exponentially growing quantities will agree with Benford's Law. But the law also describes many data-sets which do not have any apparent relation to exponential growth.
Scale invariance
If there is a list of lengths, the distribution of first digits of numbers in the list may be generally similar regardless of whether all the lengths are expressed in metres, or yards, or feet, or inches, etc.
This is not always the case. For example, the height of adult humans almost always starts with a 1 or 2 when measured in meters, and almost always starts with 4, 5, 6, or 7 when measured in feet.
But consider a list of lengths that is spread evenly over many orders of magnitude. For example, a list of 1000 lengths mentioned in scientific papers will include the measurements of molecules, bacteria, plants, and galaxies. If you write all those lengths in meters, or write them all in feet, it is reasonable to expect that the distribution of first digits should be the same on the two lists.
In these situations, where the distribution of first digits of a data set is scale invariant (or independent of the units that the data are expressed in), the distribution of first digits is always given by Benford's Law.[10][11] To be sure of approximate agreement with Benford's Law, the data has to be approximately invariant when scaled up by any factor up to 10. A lognormally distributed data set with wide dispersion has this approximate property, as do some of the examples mentioned above.
For example, the first (non-zero) digit on this list of lengths should have the same distribution whether the unit of measurement is feet or yards. But there are three feet in a yard, so the probability that the first digit of a length in yards is 1 must be the same as the probability that the first digit of a length in feet is 3, 4, or 5. Applying this to all possible measurement scales gives the logarithmic distribution of Benford's law.
Multiple probability distributions
For numbers drawn from certain distributions (IQ scores, human heights) the Law fails to hold because these variates obey a normal distribution which is known not to satisfy Benford's law,[12] since normal distributions can't span several orders of magnitude and the mantissae of their logarithms will not be (even approximately) uniformly distributed.
However, if one "mixes" numbers from those distributions, for example by taking numbers from newspaper articles, Benford's law reappears. This can also be proven mathematically: if one repeatedly "randomly" chooses a probability distribution (from an uncorrelated set) and then randomly chooses a number according to that distribution, the resulting list of numbers will obey Benford's Law.[4][13] A similar probabilistic explanation for the appearance of Benford's Law in everyday-life numbers has been advanced by showing that it arises naturally when one considers mixtures of uniform distributions.[14]
Applications
Accounting fraud detection
In 1972, Hal Varian suggested that the law could be used to detect possible fraud in lists of socio-economic data submitted in support of public planning decisions. Based on the plausible assumption that people who make up figures tend to distribute their digits fairly uniformly, a simple comparison of first-digit frequency distribution from the data with the expected distribution according to Benford's Law ought to show up any anomalous results.[15] Following this idea, Mark Nigrini showed that Benford's Law could be used in forensic accounting and auditing as an indicator of accounting and expenses fraud.[16] In practice, applications of Benford's Law for fraud detection routinely use more than the first digit.[16]
Legal status
In the United States, evidence based on Benford's law has been admitted in criminal cases at the federal, state, and local levels.[17]
Election data
Benford's Law has been invoked as evidence of fraud in the 2009 Iranian elections,[18] and also used to analyze other election results. However, other experts consider Benford's Law essentially useless as a statistical indicator of election fraud in general.[19][20]
Macroeconomic data
Similarly, the macroeconomic data the Greek government reported to the European Union before entering the eurozone was shown to be probably fraudulent using Benford's law, albeit years after the country joined.[21]
Genome data
The number of open reading frames and their relationship to genome size differs between eukaryotes and prokaryotes with the former showing a log-linear relationship and the latter a linear relationship. Benford's law has been used to test this observation with an excellent fit to the data in both cases.[22]
Scientific fraud detection
A test of regression coefficients in published papers showed agreement with Benford's law.[23] As a comparison group subjects were asked to fabricate statistical estimates. The fabricated results failed to obey Benford's law.
Statistical tests
Although the chi squared test has been used to test for compliance with Benford's law it has low statistical power when used with small samples.
The Kolmogorov–Smirnov test and the Kuiper test are more powerful when the sample size is small particularly when Stephens's corrective factor is used.[24] These tests may be overly conservative when applied to discrete distribution. Values for the Benford test have been generated by Morrow.[25] The critical values of the test statistics are shown below:
| α = 0.10 | α = 0.05 | α = 0.01 | |
|---|---|---|---|
| Kuiper Test | 1.191 | 1.321 | 1.579 |
| Kolmogorov–Smirnov | 1.012 | 1.148 | 1.420 |
Two alternative tests specific to this law have been published: first, the max (m) statistic[26] is given by

and secondly, the distance (d) statistic[27] is given by
![d= \sqrt{N \cdot \sum_{i=1}^{9}\Big[\Pr ( X \text{ has FSD}=i ) - \log_{10}(1+1/i) \Big]^{2}},](../I/m/11a0840866d11ffc3b78878159a4a267.png)
where FSD is the First Significant Digit and  is the sample size. Morrow has determined the critical values for both these statistics, which are shown below:[25]
| α = 0.10 | α = 0.05 | α = 0.01 | |
|---|---|---|---|
| Leemis' m | 0.851 | 0.967 | 1.212 |
| Cho–Gaines' d | 1.212 | 1.330 | 1.569 |
Nigrini[28] has suggested the use of a z statistic
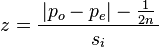
with
![s_i = \left[ \frac { p_e ( 1 - p_e ) } { n } \right]^{1/2},](../I/m/ae8ebe67b7bfe14c365c31277db6b3ac.png)
where |x| is the absolute value of x, n is the sample size, 1/(2n) is a continuity correction factor, pe is the proportion expected from Benford's law and po is the observed proportion in the sample.
Morrow has also shown that for any random variable X (with a continuous pdf) divided by its standard deviation (σ), a value A can be found such that the probability of the distribution of the first significant digit of the random variable ( X / σ )A will differ from Benford's Law by less than ε > 0.[25] The value of A depends on the value of ε and the distribution of the random variable.
A method of accounting fraud detection based on bootstrapping and regression has been proposed.[29]
Generalization to digits beyond the first
It is possible to extend the law to digits beyond the first.[30] In particular, the probability of encountering a number starting with the string of digits n is given by:
(For example, the probability that a number starts with the digits 3, 1, 4 is log10(1 + 1/314) ≈ 0.0014.) This result can be used to find the probability that a particular digit occurs at a given position within a number. For instance, the probability that a "2" is encountered as the second digit is[30]

And the probability that d (d = 0, 1, ..., 9) is encountered as the n-th (n > 1) digit is
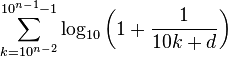
The distribution of the n-th digit, as n increases, rapidly approaches a uniform distribution with 10% for each of the ten digits.[30] Four digits is often enough to assume a uniform distribution of 10% as '0' appears 10.0176% of the time in the fourth digit while '9' appears 9.9824% of the time.
Tests with common distributions
Benford's law was empirically tested against the numbers (up to the 10th digit) generated by a number of important distributions, including the uniform distribution, the exponential distribution, the half-normal distribution, the right-truncated normal, the normal distribution, the chi square distribution and the log normal distribution. [12] In addition to these the ratio distribution of two uniform distributions, the ratio distribution of two exponential distributions, the ratio distribution of two half-normal distributions, the ratio distribution of two right-truncated normal distributions, the ratio distribution of two chi-square distributions (the F distribution) and the log normal distribution were tested.
The uniform distribution as might be expected does not obey Benford's law. In contrast, the ratio distribution of two uniform distributions is well described by Benford's law. Benford's law also describes the exponential distribution and the ratio distribution of two exponential distributions well. Although the half-normal distribution does not obey Benford's law, the ratio distribution of two half-normal distributions does. Neither the right-truncated normal distribution nor the ratio distribution of two right-truncated normal distributions are well described by Benford's law. This is not surprising as this distribution is weighted towards larger numbers. Neither the normal distribution nor the ratio distribution of two normal distributions (the Cauchy distribution) obey Benford's law. The fit of chi square distribution depends on the degrees of freedom (df) with good agreement with df = 1 and decreasing agreement as the df increases. The F distribution is fitted well for low degrees of freedom. With increasing dfs the fit decreases but much more slowly than the chi square distribution. The fit of the log-normal distribution depends on the mean and the variance of the distribution. The variance has a much greater effect on the fit than does the mean. Larger values of both parameters result in better agreement with the law. The ratio of two log normal distributions is a log normal so this distribution was not examined.
Other distributions that have been examined include the Muth distribution, Gompertz distribution, Weibull distribution, gamma distribution, log-logistic distribution and the exponential power distribution all of which show reasonable agreement with the law.[26][31] The Gumbel distribution – a density increases with increasing value of the random variable – does not show agreement with this law.[31]
Distributions known to obey Benford's law
Some well-known infinite integer sequences provably satisfy Benford's Law exactly (in the asymptotic limit as more and more terms of the sequence are included). Among these are the Fibonacci numbers,[32][33] the factorials,[34] the powers of 2,[35][36] and the powers of almost any other number.[35]
Likewise, some continuous processes satisfy Benford's Law exactly (in the asymptotic limit as the process continues longer and longer). One is an exponential growth or decay process: If a quantity is exponentially increasing or decreasing in time, then the percentage of time that it has each first digit satisfies Benford's Law asymptotically (i.e., more and more accurately as the process continues for more and more time).
Distributions known to not obey Benford's law
Square roots and reciprocals do not obey this law.[37] The 1974 Vancouver, Canada telephone book violates Benford's law because regulations require that telephone numbers have a fixed number of digits and do not begin with 1. Benford's law is violated by the populations of all places with population at least 2500 from five US states according to the 1960 and 1970 censuses, where only 19% began with digit 1 but 20% began with digit 2, for the simple reason that the truncation at 2500 introduces bias.[37] The terminal digits in pathology reports violate Benford's law due to rounding, and the fact that terminal digits are never expected to follow Benford's law in the first place.[38]
Criteria for distributions expected and not expected to obey Benford's Law
A number of criteria—applicable particularly to accounting data—have been suggested where Benford's Law can be expected to apply and not to apply.[39]
Distributions that can be expected to obey Benford's Law
- When the mean is greater than median and the skew is positive
- Numbers that result from mathematical combination of numbers: e.g., quantity × price
- Transaction level data: e.g., disbursements, sales
Distributions that would not be expected to obey Benford's Law
- Where numbers are assigned sequentially: e.g., check numbers, invoice numbers
- Where numbers are influenced by human thought: e.g., prices set by psychological thresholds ($1.99)
- Accounts with a large number of firm-specific numbers: e.g., accounts set up to record $100 refunds
- Accounts with a built-in minimum or maximum
- Where no transaction is recorded
Moments
Moments of random variables for the digits 1 to 9 following this law have been calculated:[40]
For the first and second digit distribution these values are also known:[41]
A table of the exact probabilities for the joint occurrence of the first two digits according to Benford's law is available,[41] as is the population correlation between the first and second digits:[41] ρ = 0.0561.
See also
References
- ↑ Paul H. Kvam, Brani Vidakovic, Nonparametric Statistics with Applications to Science and Engineering, p. 158
- ↑ 2.0 2.1 Frank Benford (March 1938). "The law of anomalous numbers". Proceedings of the American Philosophical Society 78 (4): 551–572. JSTOR 984802. (subscription required)
- ↑ 3.0 3.1 Simon Newcomb (1881). "Note on the frequency of use of the different digits in natural numbers". American Journal of Mathematics (American Journal of Mathematics, Vol. 4, No. 1) 4 (1/4): 39–40. doi:10.2307/2369148. JSTOR 2369148. (subscription required)
- ↑ 4.0 4.1 Theodore P. Hill (1995). "A Statistical Derivation of the Significant-Digit Law" (PDF). Statistical Science 10: 354–363.
- ↑ Arno Berger and Theodore P Hill, Benford's Law Strikes Back: No Simple Explanation in Sight for Mathematical Gem, 2011
- ↑ 6.0 6.1 Steven W. Smith. "The Scientist and Engineer's Guide to Digital Signal Processing, chapter 34, Explaining Benford's Law". Retrieved 15 December 2012. (especially section 10).
- ↑ 7.0 7.1 7.2 Fewster, R. M. (2009). "A simple explanation of Benford's Law". The American Statistician 63 (1): 26–32. doi:10.1198/tast.2009.0005.
- ↑ 8.0 8.1 8.2 8.3 This section discusses and plots probability distributions of the logarithms of a variable. This is not the same as taking a regular probability distribution of a variable, and simply plotting it on a log scale. Instead, you have to multiply the distribution by a certain function. The log scale distorts the horizontal distances, so the height has to be changed also, in order for the area under each section of the curve to remain true to the original distribution. See, for example, . Specifically:
 .
. - ↑ Arno Berger and Theodore P Hill, Benford's Law Strikes Back: No Simple Explanation in Sight for Mathematical Gem, 2011. The authors describe this argument, but say it "still leaves open the question of why it is reasonable to assume that the logarithm of the spread, as opposed to the spread itself—or, say, the log log spread—should be large." Moreover, they say: "assuming large spread on a logarithmic scale is equivalent to assuming an approximate conformance with [Benford's law]" (italics added), something which they say lacks a "simple explanation".
- ↑ Roger S. Pinkham, On the Distribution of First Significant Digits, Ann. Math. Statist. Volume 32, Number 4 (1961), 1223-1230.
- ↑ MathWorld – Benford's Law
- ↑ 12.0 12.1 Formann, A. K. (2010). Morris, Richard James, ed. "The Newcomb-Benford Law in Its Relation to Some Common Distributions". PLoS ONE 5 (5): e10541. Bibcode:2010PLoSO...510541F. doi:10.1371/journal.pone.0010541. PMC 2866333. PMID 20479878.
- ↑ Theodore P. Hill (July–August 1998). "The first digit phenomenon" (PDF). American Scientist 86 (4): 358. Bibcode:1998AmSci..86..358H. doi:10.1511/1998.4.358.
- ↑ Élise Janvresse and Thierry de la Rue (2004), "From Uniform Distributions to Benford's Law", Journal of Applied Probability, 41 1203–1210 doi:10.1239/jap/1101840566 MR 2122815 preprint
- ↑ Varian, Hal (1972). "Benford's Law (Letters to the Editor)". The American Statistician 26 (3): 65. doi:10.1080/00031305.1972.10478934.
- ↑ 16.0 16.1 Nigrini, Mark J. (May 1999). "I've Got Your Number:How a mathematical phenomenon can help CPAs uncover fraud and other irregulaities". Journal of Accountancy.
- ↑ "From Benford to Erdös". Radio Lab. Episode 2009-10-09. 2009-09-30.
- ↑ Stephen Battersby Statistics hint at fraud in Iranian election New Scientist 24 June 2009
- ↑ Joseph Deckert, Mikhail Myagkov and Peter C. Ordeshook, (2010) The Irrelevance of Benford’s Law for Detecting Fraud in Elections, Caltech/MIT Voting Technology Project Working Paper No. 9
- ↑ Charles R. Tolle, Joanne L. Budzien, and Randall A. LaViolette (2000) Do dynamical systems follow Benford?s Law?, Chaos 10, 2, pp.331–336 (2000); doi:10.1063/1.166498
- ↑ Müller, Hans Christian: Greece Was Lying About Its Budget Numbers. Forbes. 12 September 2011.
- ↑ Friar, JL; Goldman, T; Pérez-Mercader, J (2012). "Genome sizes and the benford distribution". PLOS ONE 7 (5): e36624. doi:10.1371/journal.pone.0036624.
- ↑ Diekmann A (2007) Not the First Digit! Using Benford's Law to detect fraudulent scientific data. J Appl Stat 34 (3) 321–329, doi:10.1080/02664760601004940
- ↑ Stephens, M. A. (1970). "Use of the Kolmogorov–Smirnov, Cramér–Von Mises and Related Statistics without Extensive Tables". Journal of the Royal Statistical Society, Series B 32 (1): 115–122. Retrieved 2013-03-09.
- ↑ 25.0 25.1 25.2 Morrow, J. (2010) "Benford’s Law, Families of Distributions and a test basis", UW-Madison
- ↑ 26.0 26.1 Leemis, L. M.; Schmeiser, B. W.; Evans, D. L. (2000). "Survival distributions satisfying Benford's Law". The Amererican Statistician 54 (4): 236–241. doi:10.1080/00031305.2000.10474554.
- ↑ Cho, W. K. T.; Gaines, B. J. (2007). "Breaking the (Benford) law: Statistical fraud detection in campaign finance". The Amererican Statistician 61 (3): 218–223. doi:10.1198/000313007X223496.
- ↑ Nigrini, M. (1996). "A taxpayer compliance application of Benford's Law". J Amer Tax Assoc 18: 72–91.
- ↑ Suh, I. S.; Headrick, T. C.; Minaburo, S. (2011). "An effective and efficient analytic technique: A bootstrap regression procedure and Benford's Law". J Forensic & Investigative Accounting 3 (3).
- ↑ 30.0 30.1 30.2 Theodore P. Hill, "The Significant-Digit Phenomenon", The American Mathematical Monthly, Vol. 102, No. 4, (Apr., 1995), pp. 322–327. Official web link (subscription required). Alternate, free web link.
- ↑ 31.0 31.1 Dümbgen, L; Leuenberger, C (2008). "Explicit bounds for the approximation error in Benford's Law". Elect Comm in Probab 13: 99–112. doi:10.1214/ECP.v13-1358.
- ↑ L. C. Washington, "Benford's Law for Fibonacci and Lucas Numbers", The Fibonacci Quarterly, 19.2, (1981), 175–177
- ↑ Duncan, R. L. (1967). "An Application of Uniform Distribution to the Fibonacci Numbers". The Fibonacci Quarterly 5: 137–140.
- ↑ Sarkar, P. B. (1973). "An Observation on the Significant Digits of Binomial Coefficients and Factorials", Sankhya". B, 35: 363–364.
- ↑ 35.0 35.1 In general, the sequence k1, k2, k3, etc., satisfies Benford's Law exactly, under the condition that log10 k is an irrational number. This is a straightforward consequence of the equidistribution theorem.
- ↑ That the first 100 powers of 2 approximately satisfy Benford's Law is mentioned by Ralph Raimi. Raimi, Ralph A. (1976). "The First Digit Problem". American Mathematical Monthly 83 (7): 521–538. doi:10.2307/2319349.
- ↑ 37.0 37.1 Raimi, RA (1976). "The first digit problem". American Mathematical Monthly 83: 521–538. doi:10.2307/2319349.
- ↑ Beer, TW (2009). "Terminal digit preference: beware of Benford's Law". J Clin Pathol 62: 192. doi:10.1136/jcp.2008.061721.
- ↑ Durtschi, C; Hillison, W; Pacini, C (2004). "The effective use of Benford's Law to assist in detecting fraud in accounting data". J Forensic Accounting 5: 17–34.
- ↑ Scott, P.D.; Fasli, M. (2001) "Benford’s Law: An empirical investigation and a novel explanation". CSM Technical Report 349, Department of Computer Science, Univ. Essex
- ↑ 41.0 41.1 41.2 Suh, I.S.; Headrick, T.C. (2010). "A comparative analysis of the bootstrap versus traditional statistical procedures applied to digital analysis based on Benford's Law" (PDF). Journal of Forensic and Investigative Accounting 2 (2): 144–175.
Further reading
- Alex Ely Kossovsky. Benford's Law: Theory, the General Law of Relative Quantities, and Forensic Fraud Detection Applications, 2014, World Scientific Publishing. ISBN 978-981-4583-68-8.
- "Benford's Law – from Wolfram MathWorld". Mathworld.wolfram.com. 14 June 2012. Retrieved 2012-06-26.
- Mark J. Nigrini (2012). Benford's Law: Applications for Forensic Accounting, Auditing, and Fraud Detection. John Wiley & Sons. p. 330. ISBN 978-1-118-15285-0.
- Alessandro Gambini, Giovanni Mingari Scarpello, Daniele Ritelli et al. (2012). "Probability of digits by dividing random numbers: A ψ and ζ functions approach". Expositiones Mathematicae 30 (4): 223–238. doi:10.1016/j.exmath.2012.03.001.
- Sehity; Hoelzl, Erik; Kirchler, Erich (2005). "Price developments after a nominal shock: Benford's Law and psychological pricing after the euro introduction". International Journal of Research in Marketing 22 (4): 471–480. doi:10.1016/j.ijresmar.2005.09.002.
- Nicolas Gauvrit; Jean-Paul Delahaye (2011). "Scatter and regularity implies Benford's Law...and more". Zenil: Randomness through computation: some answers, more questions. ISBN 9814327751: 58–69. arXiv:0910.1359. Bibcode:2009arXiv0910.1359G. doi:10.1142/9789814327756_0004.
- Bernhard Rauch1, Max Göttsche, Gernot Brähler, Stefan Engel (August 2011). "Fact and Fiction in EU-Governmental Economic Data". German Economic Review 12 (3): 243–255. doi:10.1111/j.1468-0475.2011.00542.x.
- Wendy Cho and Brian Gaines (August 2007). "Breaking the (Benford) Law: statistical fraud detection in campaign finance". The American Statistician 61 (3): 218–223. doi:10.1198/000313007X223496.
- Geiringer, Hilda; Furlan, L. V. (1948). "The Law of Harmony in Statistics: An Investigation of the Metrical Interdependence of Social Phenomena. by L. V. Furlan". Journal of the American Statistical Association (American Statistical Association) 43 (242): 325–328. doi:10.2307/2280379. JSTOR 2280379.
External links
| Wikimedia Commons has media related to Benford's law. |
General audience
- Benford Online Bibliography, an online bibliographic database on Benford's Law.
- Companion website for Benford's Law by Mark Nigrini Website includes 15 data sets, 10 Excel templates, photos, documents, and other miscellaneous items related to Benford's Law
- Following Benford's Law, or Looking Out for No. 1, 1998 article from The New York Times.
- A further five numbers: number 1 and Benford's law, BBC radio segment by Simon Singh
- From Benford to Erdös, Radio segment from the Radiolab program
- Looking out for number one by Jon Walthoe, Robert Hunt and Mike Pearson, Plus Magazine, September 1999
- Video showing Benford's Law applied to Web Data (incl. Minnesota Lakes, US Census Data and Digg Statistics)
- An illustration of Benford's Law, showing first-digit distributions of various sequences evolve over time, interactive.
- Generate your own Benford numbers A script for generating random numbers compliant with Benford's Law.
- Testing Benford's Law An open source project showing Benford's Law in action against publicly available datasets.
- Mould, Steve. "Number 1 and Benford's Law". Numberphile. Brady Haran.
- A third of property values begin with a 1 An example of Benford's Law appearing in house price data.
- Benford's Very Strange Law - Professor John D. Barrow, lecture on Benford's Law.
More mathematical
- Weisstein, Eric W., "Benford's Law", MathWorld.
- Benford’s law, Zipf’s law, and the Pareto distribution by Terence Tao
- Country Data and Benford's Law, Benford's Law from Ratios of Random Numbers at Wolfram Demonstrations Project.
- Benford's Law Solved with Digital Signal Processing
- Interactive graphic: Univariate Distribution Relationships