Belgian local elections, 2012
| | ||||
| ||||
|
| ||||
|
| ||||
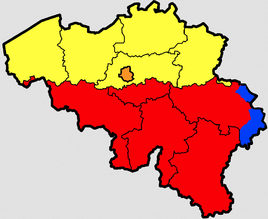
| Dutch-speaking |
French-speaking | ||
| German-speaking |
Bilingual Du./Fr. | ||
| Community: | Region: | ||
| Flemish | Flemish (Flanders) | ||
| Capital (Brussels) | |||
| French | |||
| Walloon | (Wallonia) | ||
| German-speaking | |||
The Belgian provincial, municipal and district elections of 2012 took place on 14 October. As with the previous 2006 elections, these are no longer organised by the Belgian federal state but instead by the respective regions:
- Brussels with 19 municipalities
- Flanders with 5 provinces and 308 municipalities
- In the city of Antwerp, elections will also be held for its districts
- Wallonia with 5 provinces and 262 municipalities
In the municipalities with language facilities of Voeren, Comines-Warneton and the 6 of the Brussels Periphery, the aldermen and members of the OCMW/CPAS council are directly elected.[1]
Mayors are not directly elected, instead the respective regional government (of Brussels, Flanders and Wallonia) appoint one of the elected municipal councillors. The councillors usually propose a candidate.
The result in Wallonia was largely a continuation of the major parties, without any big power shifts. In Flanders however, the nationalist party N-VA, which won in previous regional and federal elections, continued their success and became (one of) the largest party in many municipalities and the largest in three out of five provinces.
Parties
National political parties are mostly separated by language community. A lot of municipalities have local parties as well as a presence of national parties. Here are the most important national parties:
- Dutch-speaking, generally contending in Flanders and Brussels: N-VA (nationalist), CD&V (Christian-democrats), sp.a (socialists), Open VLD (liberals), Groen (ecologists), Vlaams Belang (far-right) PvdA (marxist)
- French-speaking, generally contending in Wallonia and Brussels: PS (socialists), MR (liberals), FDF (liberals), CdH (Christian-democrats), Ecolo (ecologists), FN (far-right), PTB (marxist)
- German-speaking, generally contending in several German-speaking municipalities in Wallonia
Brussels
The Brussels-Capital Region is made up of 19 municipalities (of which one is the city of Brussels) which are not part of any province.
In these municipalities, French-speaking parties are usually the largest ones, mostly PS and MR. FDF, previously forming a cartel with MR and also strong in Brussels municipalities, will now contend on its own, but dissidents from both former partners are contending on the other party's list, particularly in the municipalities where they are currently part of the majority coalition.
Dutch-speaking parties will in some municipalities form a cartel either with their French counterpart or in a larger "Mayor's List", as is the case this time between Ecolo and Groen! in all 19 municipalities, and with PS and SP.A in 17 out of 19. The only Dutch-speaking list with support from most Dutch-speaking parties is Samen (CD&V, Open VLD, SP.A and independents) in Auderghem. N-VA announced it will contend on its own in at least 10 out of the 19 municipalities.[2] 78 Dutch-speaking Dutch-speaking candidates were elected this time in the municipal councils.
Flanders
The nationalist party N-VA became the largest party in the 2010 federal election. It was expected that the party would now achieve a number of seats in many Flemish municipalities, which was indeed the case. Local lists include cartels between two parties and independents, varying from one municipality to another, e.g. SP.A and CD&V in the city of Antwerp, but SP.A and Groen! in the districts of Antwerp and in Ghent, Open VLD and Groen! (and a splinter group from the CD&V) in Mechelen.
General trends
Parties on the right, CD&V, Open VLD and Vlaams Belang, generally lose votes in previous elections whereas N-VA has grown a lot.
The socialist party SP.A is especially successful in large cities, but has slightly been losing votes in previous elections too.
The green party Groen remains stable with a relatively low percentage of votes.
Cities
A lot of attention goes to the city of Antwerp, where Bart De Wever, the president of N-VA, wants to become mayor and put an end to decades of socialist mayors, the current one being Patrick Janssens (sp.a). Christian-democrat CD&V and socialist sp.a will form one list. Also Wouter Van Besien (president of Groen) is contending for the position of mayor, and Filip Dewinter of extreme-right Vlaams Belang is campaigning in Antwerp. According to a poll, N-VA would get 42,9% of the votes, giving 26 out of 55 seats in the municipal party, and 46,5% would like to see De Wever become the new mayor.[3]
In Ghent, the incumbent mayor Daniël Termont is very popular. SP.A, his party, now formed a cartel with Groen. Polls predict the cartel will get about 43% of the votes. The parties Open VLD of Mathias De Clercq and N-VA of Siegfried Bracke follow after a gap.[4]
Leuven has a similar situation where polls indicate that SP.A, the party of incumbent mayor Louis Tobback, would still be the largest. N-VA, CD&V and Groen follow after a gap.[5]
In Bruges, the incumbent mayor Patrick Moenaert (CD&V), who led a coalition of CD&V/N-VA, SP.A and VLD (which were all represented parties except Groen and VB), quits so all possibilities remain open. Polls give CD&V, SP.A and N-VA as major parties.[6]
Provinces
The provincial councils of Antwerp, Flemish Brabant, East Flanders, West Flanders and Limburg were elected. The number of councillors has been reduced.
In East Flanders, Flemish Brabant and especially Antwerp, N-VA became the largest party in the province, followed by CD&V. In Limburg and West Flanders, CD&V remained the biggest party followed by N-VA.
Wallonia
PS and MR are generally the two largest parties, followed by Ecolo and CDH. In the province of Luxembourg, CDH is generally more successful. No major trends or shifts were expected nor happened.
Provinces
The provincial councils of Namur, Walloon Brabant, Liège, Hainaut and Luxembourg were elected. The number of councillors has been reduced.
Results
Brussels
Results are available via http://bruxelleselections2012.irisnet.be/
| Municipality | CDH-CD&V | Ecolo-Green | LB | MR-Open VLD | PS-SP.A | Flemish Interest | N-VA | Other |
|---|---|---|---|---|---|---|---|---|
| Anderlecht | * | 5 | 14 | * | 1 | 21 (PS-SP.A-CDH) | ||
| Brussels | 10 | 7 | 10 | 18 | - | 1 | 1 (FDF) | |
| Elsene | ||||||||
| Evere | 3 | 4 | 16 | 6 | * | - | 1 | 4 (FDF) |
| Koekelberg | - | 3 | 16 | - | 8 | - | - | - |
| Oudergem | 1 | 4 | 23 | 2 | - | - | 1 | |
| Schaarbeek | 4 | 7 | 18 | 4 | 13 | - | - | 1 |
| Sint-Gillis | 2 | 8 | 19 | 6 | - | - | - | - |
| Sint-Jans-Molenbeek | 6 | 4 | 16 | 15 | - | - | 1 | 3 |
| Sint-Pieters-Woluwe | - | 3 | 14 | - | 1 | - | - | 15 |
| Ukkel | 3 | 7 | - | 21 | 5 | - | - | 5 (FDF) |
| Vorst | 3 | 7 | - | 10 | 14 | - | - | 3 (FDF) |
| Watermaal-Bosvoorde | - | 7 | 10 | 3 | 2 | - | - | - |
Flanders
Results are available via http://vlaanderenkiest.be/verkiezingen2012/
Provincial elections
| Party | Votes | % | +/– (2006) | Seats | +/– (2006) | |
|---|---|---|---|---|---|---|
| New Flemish Alliance (N-VA) | 1,165,938 | 28.5 | * | 104 | * | |
| Christian Democratic and Flemish (CD&V) | 877,019 | 21.5 | * | 82 | * | |
| Open Flemish Liberals and Democrats (Open VLD) | 595,932 | 14.6 | | 54 | ||
| Socialist Party–Different (SP.A) | 580,078 | 11.5 | | 51† | ||
| Flemish Interest (VB) | 365,439 | 8.9 | | 29 | ||
| Green | 314,538 | 7.7 | | 24† | ||
| Union des Francophones (UF) | 48,920 | 1.2 | 5 | | ||
| Workers' Party of Belgium (PVDA+) | 84,037 | 2.1 | | 2 | | |
| Other parties | 55,284 | 1.4 | — | |||
| Valid votes | 4,087,185 | |||||
| Invalid votes | ||||||
| Blanco votes | ||||||
| Total | 351 | |||||
| Province | CD&V | Vlaams Belang | Groen | N-VA | Open VLD | PVDA+ | SP.A | UF |
|---|---|---|---|---|---|---|---|---|
| 16.8 (13) | 10.8 (7) | 9.3 (6) | 35.9 (27) | 10.1 (7) | 3.4 (2) | 12.8 (10) | — | |
| 19.8 (15) | 9.3 (6) | 9 (6) | 26.1 (21) | 19.3 (15) | 1.7 (0) | 12.7 (9) | — | |
| 19.5 (15) | 6.7 (5) | 9.6 (7) | 25.8 (19) | 16.8 (13) | 1.2 (0) | 12.1 (8) | 7.1 (5) | |
| 27.5 (18) | 9.1 (6) | † | 26.1 (17) | 14.1 (9) | 2.2 (0) | 20.1 (13)† | — | |
| 27.6 (21) | 7.7 (5) | 7.5 (4) | 25.3 (20) | 13.4 (10) | 1.3 (0) | 15.8 (12) | — | |
† In Limburg: coalition SP.A - Groen. Only one of the 13 elected candidates (Hassan Amaghlaou) is a member of Groen.
Municipal elections
| City (Provincial capital) | CD&V | Flemish Interest | Green | N-VA | Open VLD | PVDA+ | SP.A | Other |
|---|---|---|---|---|---|---|---|---|
| Antwerp | * | 5 | 4 | 23 | 2 | 4 | * | 17 (SP.A-CD&V) |
| Bruges | 13 | 2 | 3 | 10 | 5 | — | 14 | — |
| Ghent | 4 | 3 | * | 9 | 9 | — | * | 26 (SP.A-Green) |
| Hasselt | 10 | 1 | * | 11 | 4 | — | * | 14 (SP.A-Green) |
| Leuven | 9 | 1 | 7 | 9 | 3 | — | 16 | — |
Wallonia
Results are available via http://elections2012.wallonie.be/results/fr/
Municipal elections
| City (Provincial capital) | CDH | Ecolo | MR | PS | Other |
|---|---|---|---|---|---|
| Arlon | 11 | 4 | 6 | 8 | — |
| Liège | 7 | 6 | 11 | 22 | 3 |
| Mons | 3 | 3 | 8 | 29 | 2 |
| Namur | 16 | 6 | 10 | 15 | — |
| Wavre | 3 | 4 | * | 4 | 20 (LB) |
Provincial elections
| Province | CDH | CSP | Ecolo | FDF | MR | PFF-MR | PS | PTB+ | SP | |||||||||
|---|---|---|---|---|---|---|---|---|---|---|---|---|---|---|---|---|---|---|
| 14.39 | 6 ( | — | 10.88 | 4 ( | — | 23.17 | 16 ( | — | 39.68 | 30 ( | — | — | ||||||
| 13.76 | 7 ( | 1.72 | 1 ( | 14.76 | 8 ( | — | 25.16 | 16 ( | 1.74 | 1 ( | 32.22 | 20 ( | 4.71 | 2 ( | 0.72 | 1 ( | ||
| 34.95 | 14 ( | — | 11.58 | 2 ( | — | 26.06 | 11 ( | — | 23.03 | 10 ( | — | — | ||||||
| 19.87 | 8 ( | — | 13.97 | 4 ( | — | 29.79 | 13 ( | — | 27.82 | 12 ( | — | — | ||||||
| 12.26 | 5 ( | — | 16.29 | 6 ( | 4.78 | 2 ( | 42.44 | 17 ( | — | 17.33 | 7 ( | — | — | |||||
| Total | 1 | 2 | 2 | 1 | ||||||||||||||
Foreign residents
For the third time, non-Belgian EU residents may vote and be candidate for the municipal elections under the same conditions as Belgian residents, and for the second time non-Belgian non-EU residents may vote, but not be candidate, after 5 years residency. As voting is compulsory and Belgium may not impose voting on foreign residents, would-be voters from both categories have to fill a document and go to their municipal administration before August 1, 2012 to be included on the list of electors. Non-EU residents have to sign a document accepting to conform to Belgian laws and Constitution.[7] The percentage of foreign residents who are enlisted as electors has severely declined from 2006 to 2012: from 20.9% to 14.85% for EU residents, from 15.7% to 6.30% for non-EU residents (still including Bulgarians and Rumanians in 2006).[8]
References
- ↑ "http://vlaanderenkiest.be". Retrieved 2011-10-17.
- ↑ N-VA neemt in minstens tien Brusselse gemeenten deel aan gemeenteraadsverkiezingen, 23 May 2012, n-va.be
- ↑ "Antwerpenaars kiezen massaal voor De Wever in peiling" (in Dutch). deredactie.be.
- ↑ "Kartel van Termont blaast tegenstand weg in Gent" (in Dutch). Deredactie.be.
- ↑ "Tobback blijft stevig in het zadel in Leuven" (in Dutch). Deredactie.be.
- ↑ "Nek-aan-nekrace tussen CD&V en SP.A in Brugge" (in Dutch). Deredactie.be.
- ↑ Document for EU residents (French), Dutch), for non-EU residents (French), (Dutch), Website of the Interior Ministry
- ↑ Statistiques officielles des électeurs, Website of the Interior Ministry
External links
- Electoral leaflets and posters, Tractothèque